
FirstNameHelen
@t_FirstNameHelen

What symbols does the trader recommend buying?
Purchase History
پیام های تریدر
Filter
FirstNameHelen
HelenP. I Gold may reach resistance zone and then drop
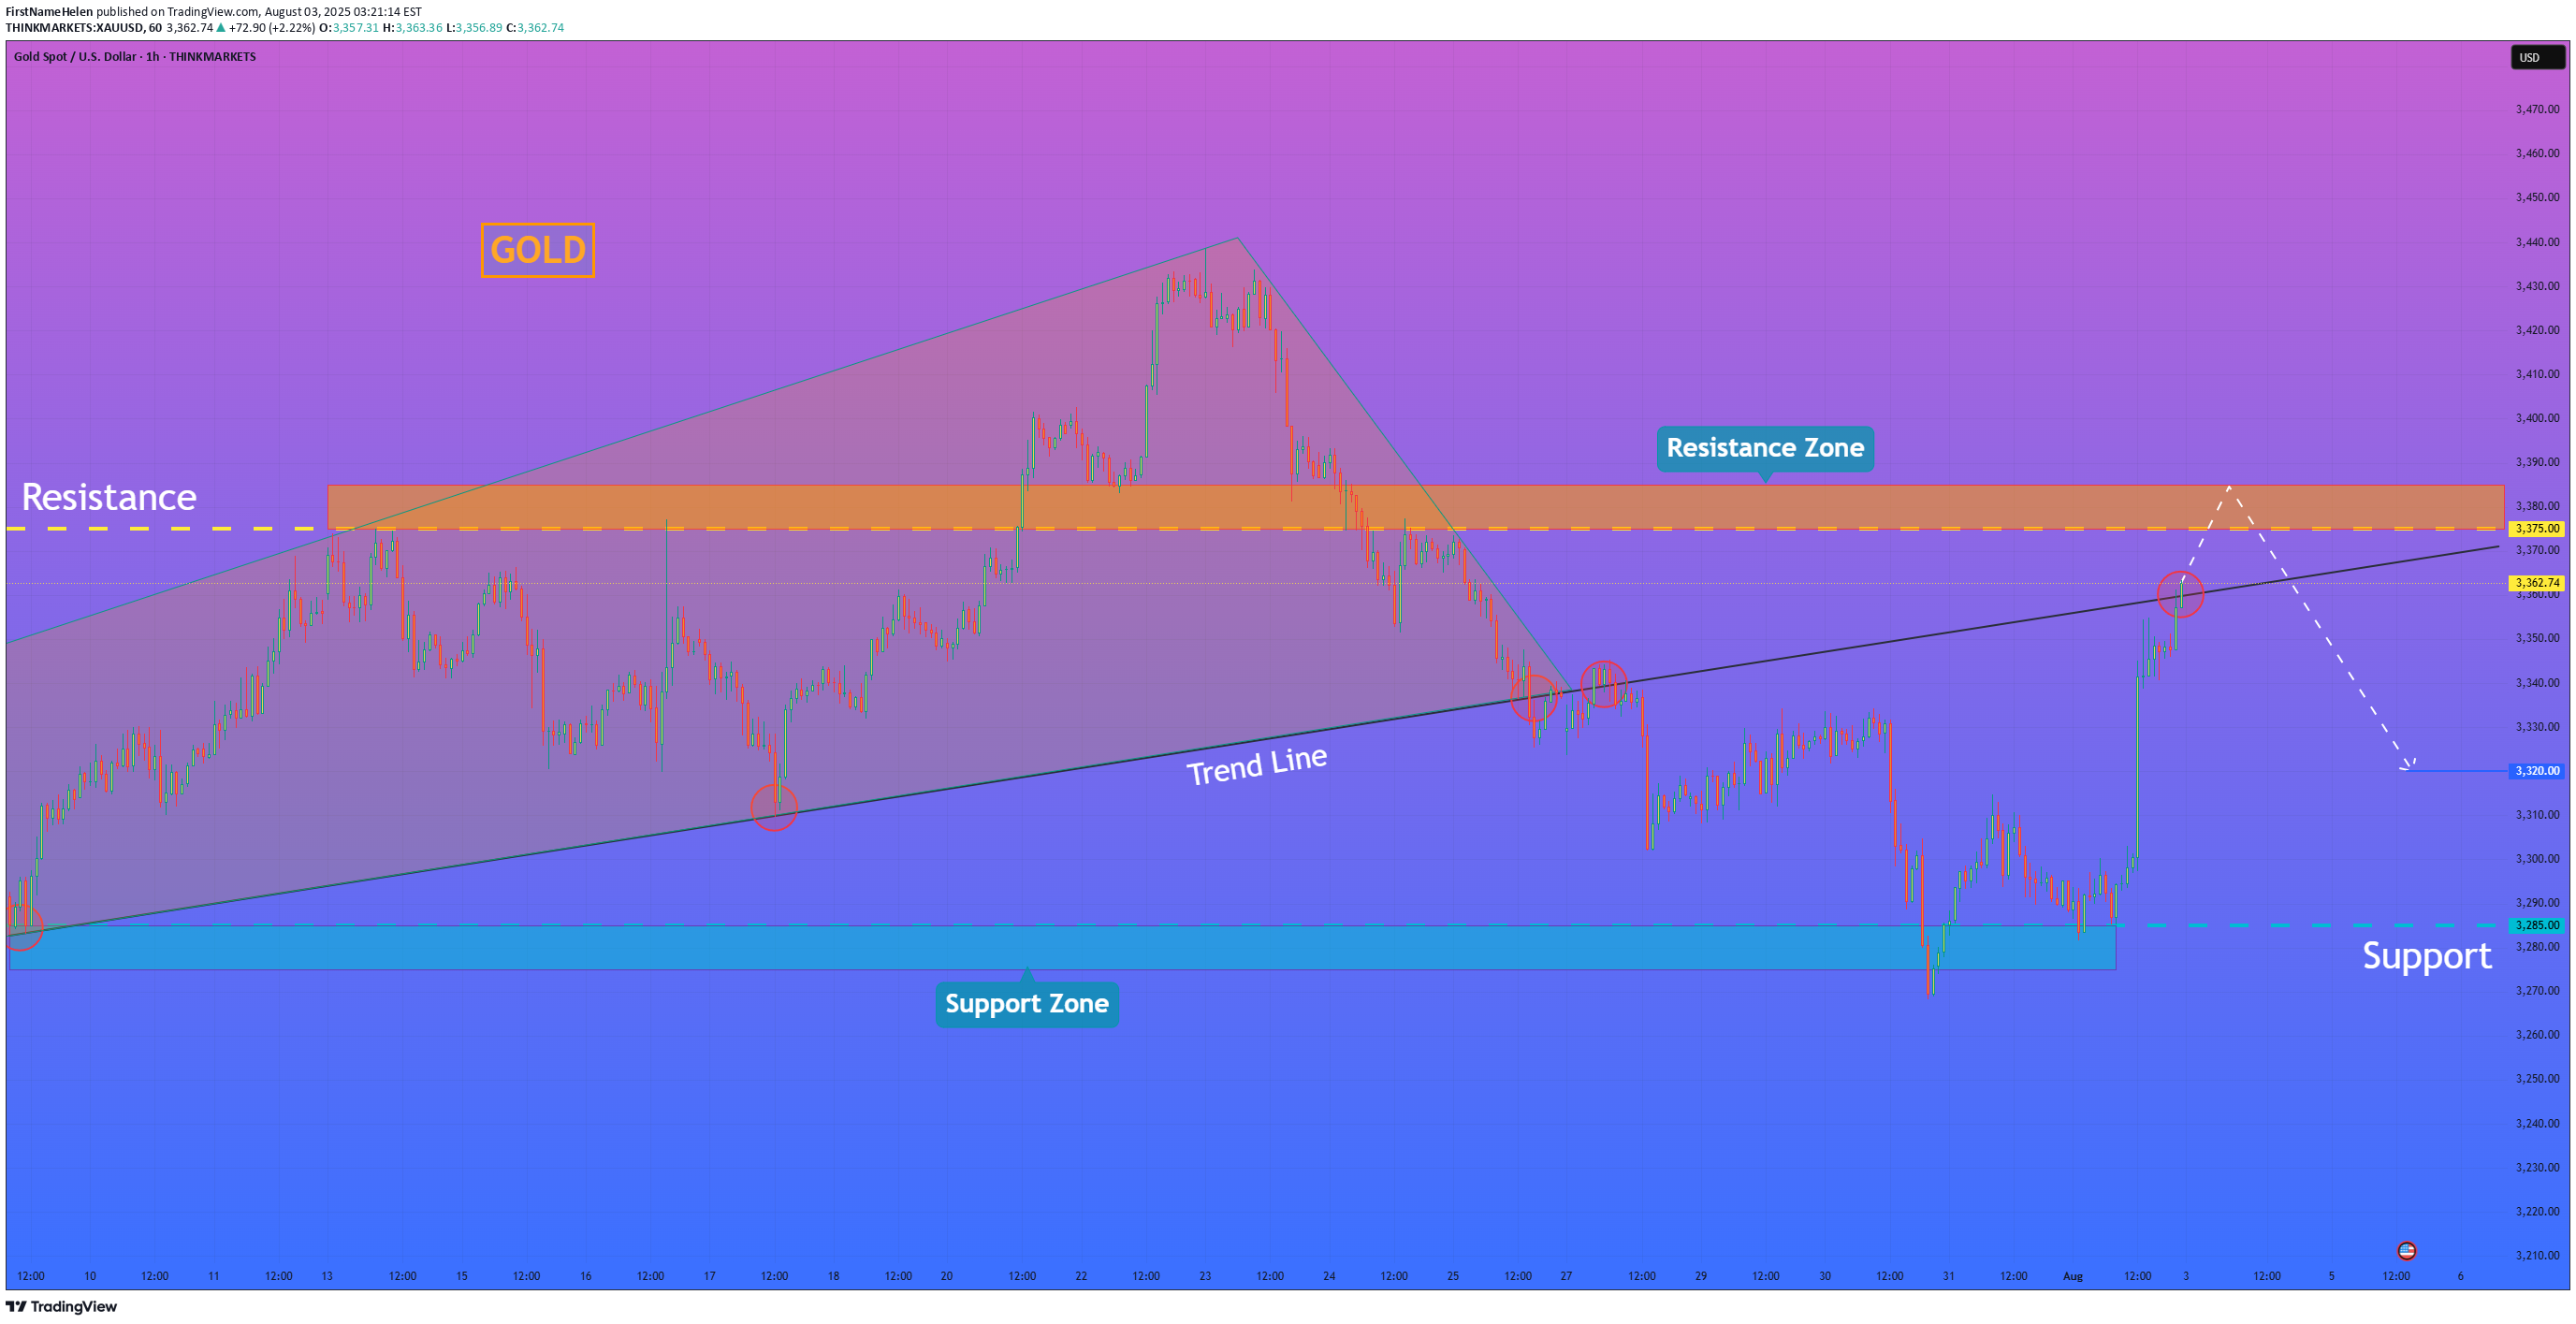
Hi folks today I'm prepared for you Gold analytics. From a structural perspective, the XAU chart indicates a recent shift to a bearish bias, following a clear breakdown from a large broadening wedge pattern. This development suggests that sellers have gained a significant advantage in the market. The price is now staging a corrective rally back towards the point of the breakdown, creating a critical test at the confluence of the broken trend line and the major horizontal resistance zone at 3375 - 3385. My analysis for a short position is based on a potential 'bull trap' scenario within this area. I believe the price may briefly push above the trend line to trap buyers, but the key condition is a swift and forceful rejection from within the resistance zone. If the price fails to hold its gains and reverses back below the trend line, it would be a strong confirmation of the underlying bearish pressure. This would likely trigger the next impulsive move downwards, and therefore, the primary goal for this scenario is set at the 3320 level, a logical objective following such a powerful rejection. If you like my analytics you may support me with your like/comment ❤️ Disclaimer: As part of ThinkMarkets’ Influencer Program, I am sponsored to share and publish their charts in my analysis.
FirstNameHelen
HelenP. I Bitcoin will rebound down from resistance level
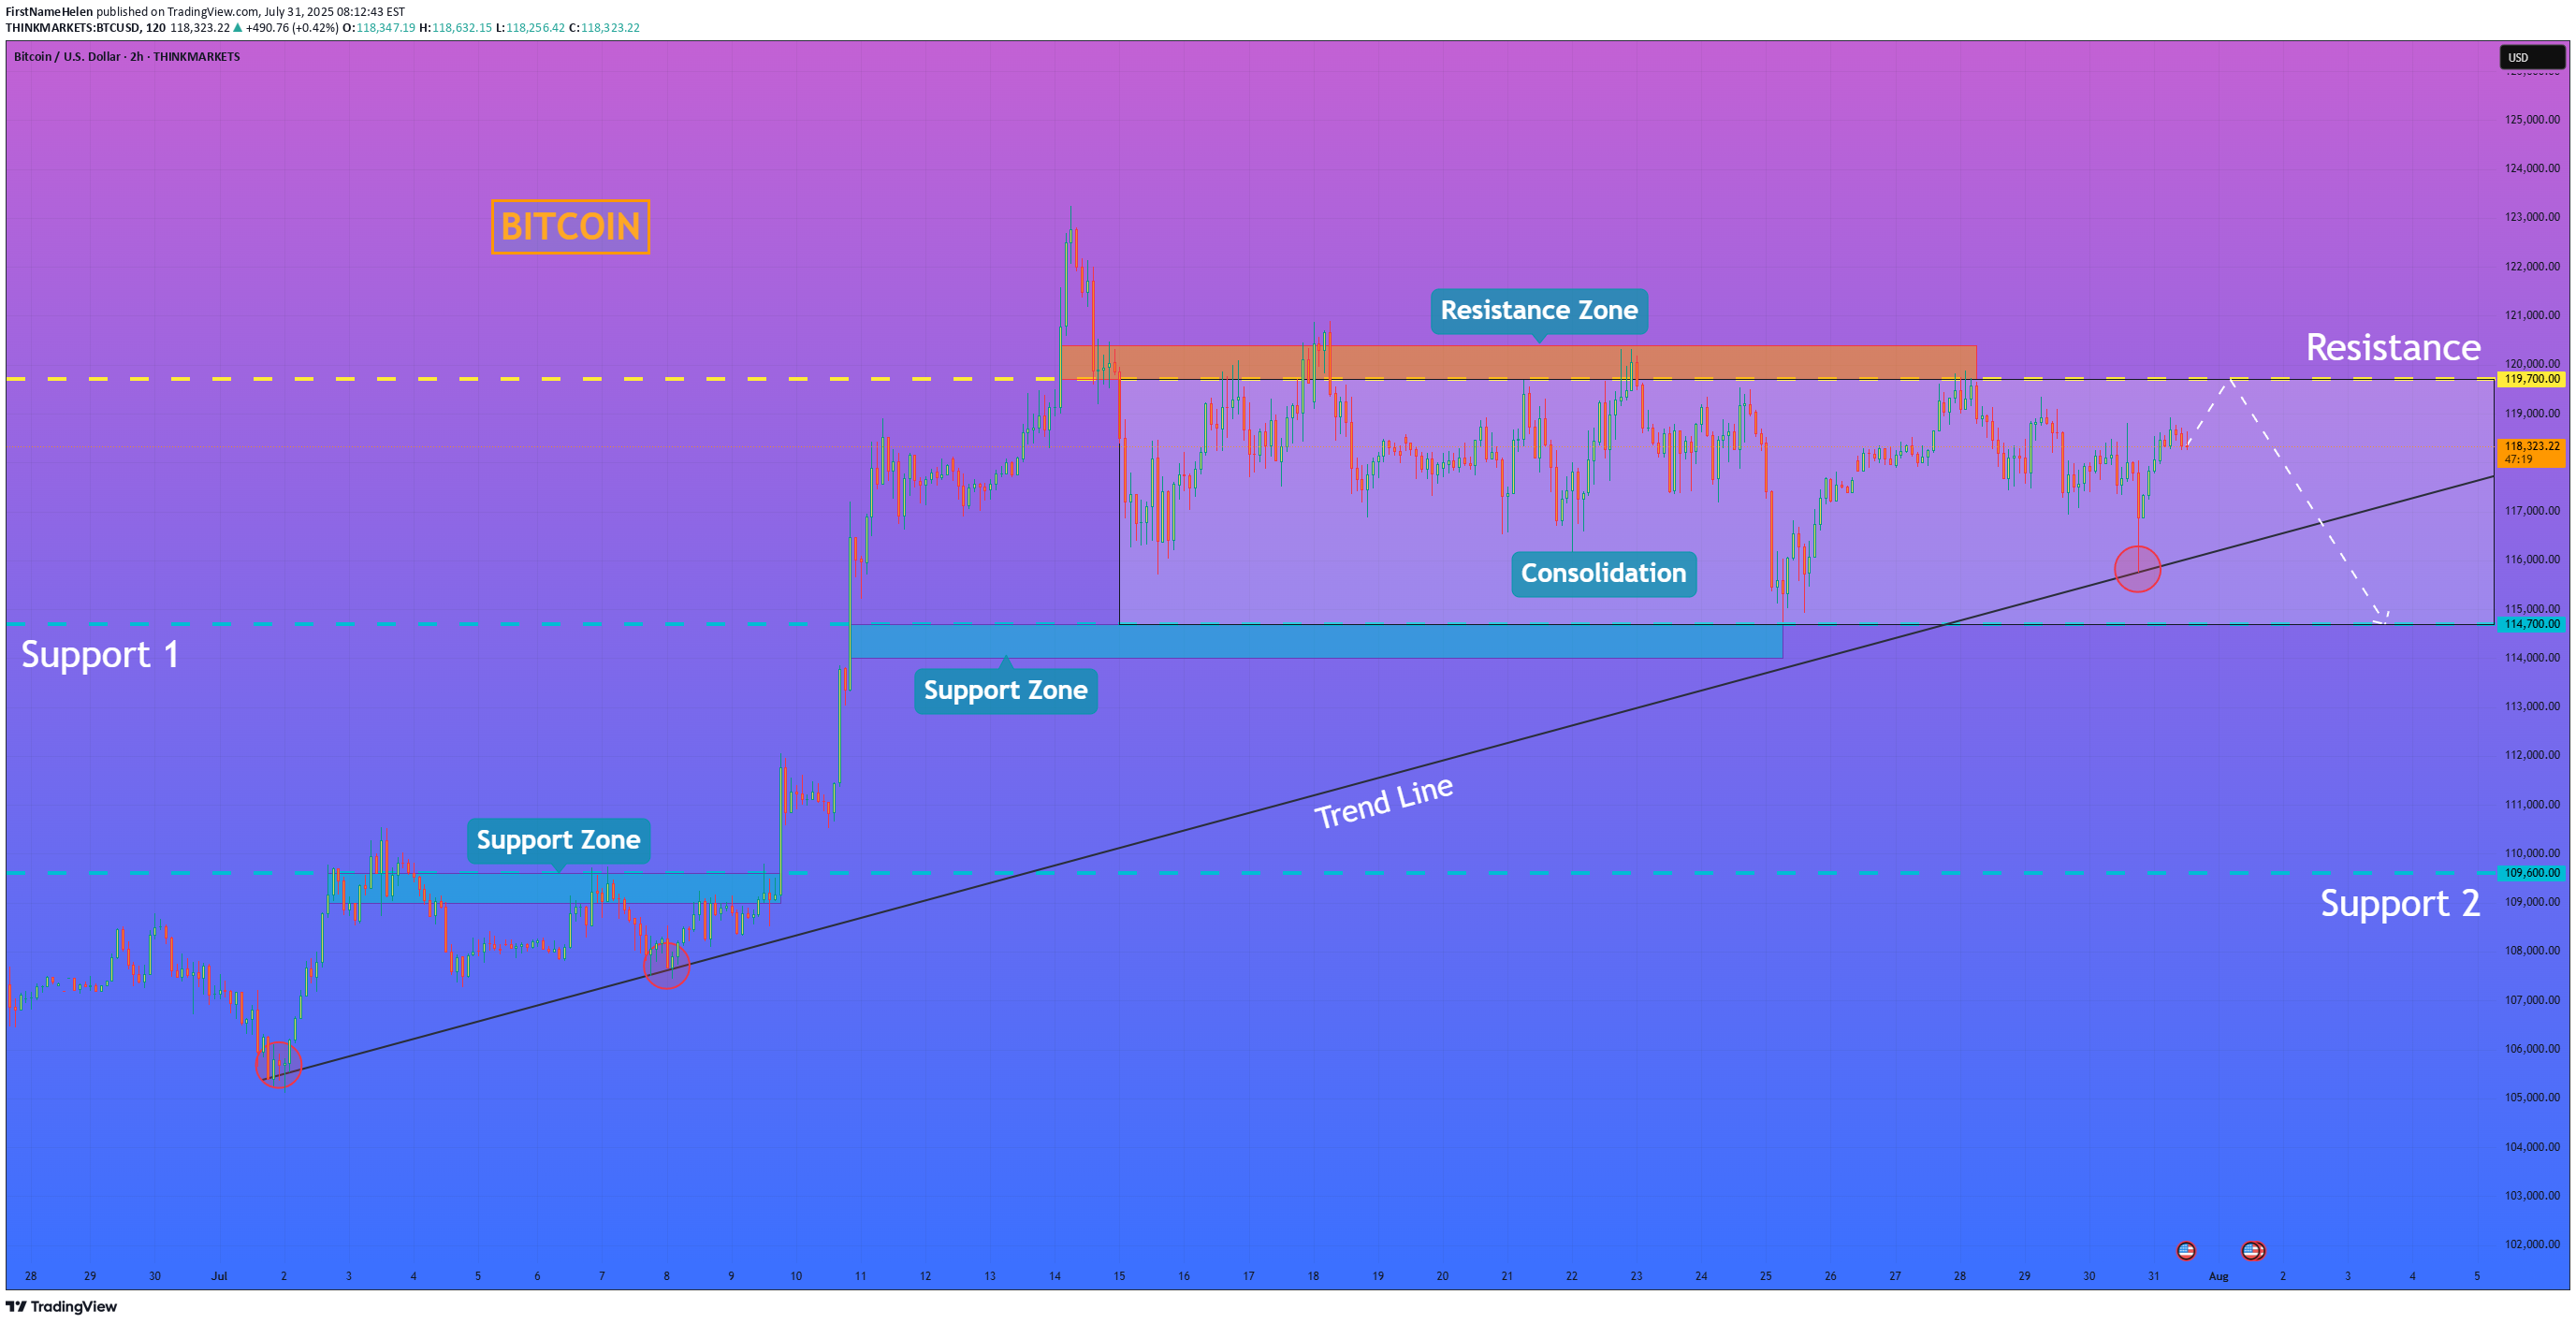
Hi folks today I'm prepared for you Bitcoin analytics. A technical review of the chart reveals a prolonged period of horizontal consolidation, during which the price has been trading within a well-defined range between support at 114700 and resistance near 119700. This phase of balance follows a significant prior uptrend, and a major ascending trend line is currently intersecting this range. My analysis for a short position is based on the expectation of a final 'test and fail' at the top of this consolidation. I believe the price will make one more attempt to rally towards the resistance zone around 119700. A strong rejection from this area, demonstrating sellers' control, would serve as the main confirmation for a bearish bias. Such a rejection would likely initiate a powerful downward move across the range, with sufficient momentum to break the critical ascending trend line. This would be a significant structural event, signaling a potential reversal of the larger trend. Therefore, the primary goal for this scenario is logically set at the 114700 support level, the bottom of the consolidation range. If you like my analytics you may support me with your like/comment ❤️ Disclaimer: As part of ThinkMarkets’ Influencer Program, I am sponsored to share and publish their charts in my analysis.
FirstNameHelen
HelenP. I After correction to support level, Gold start to grow
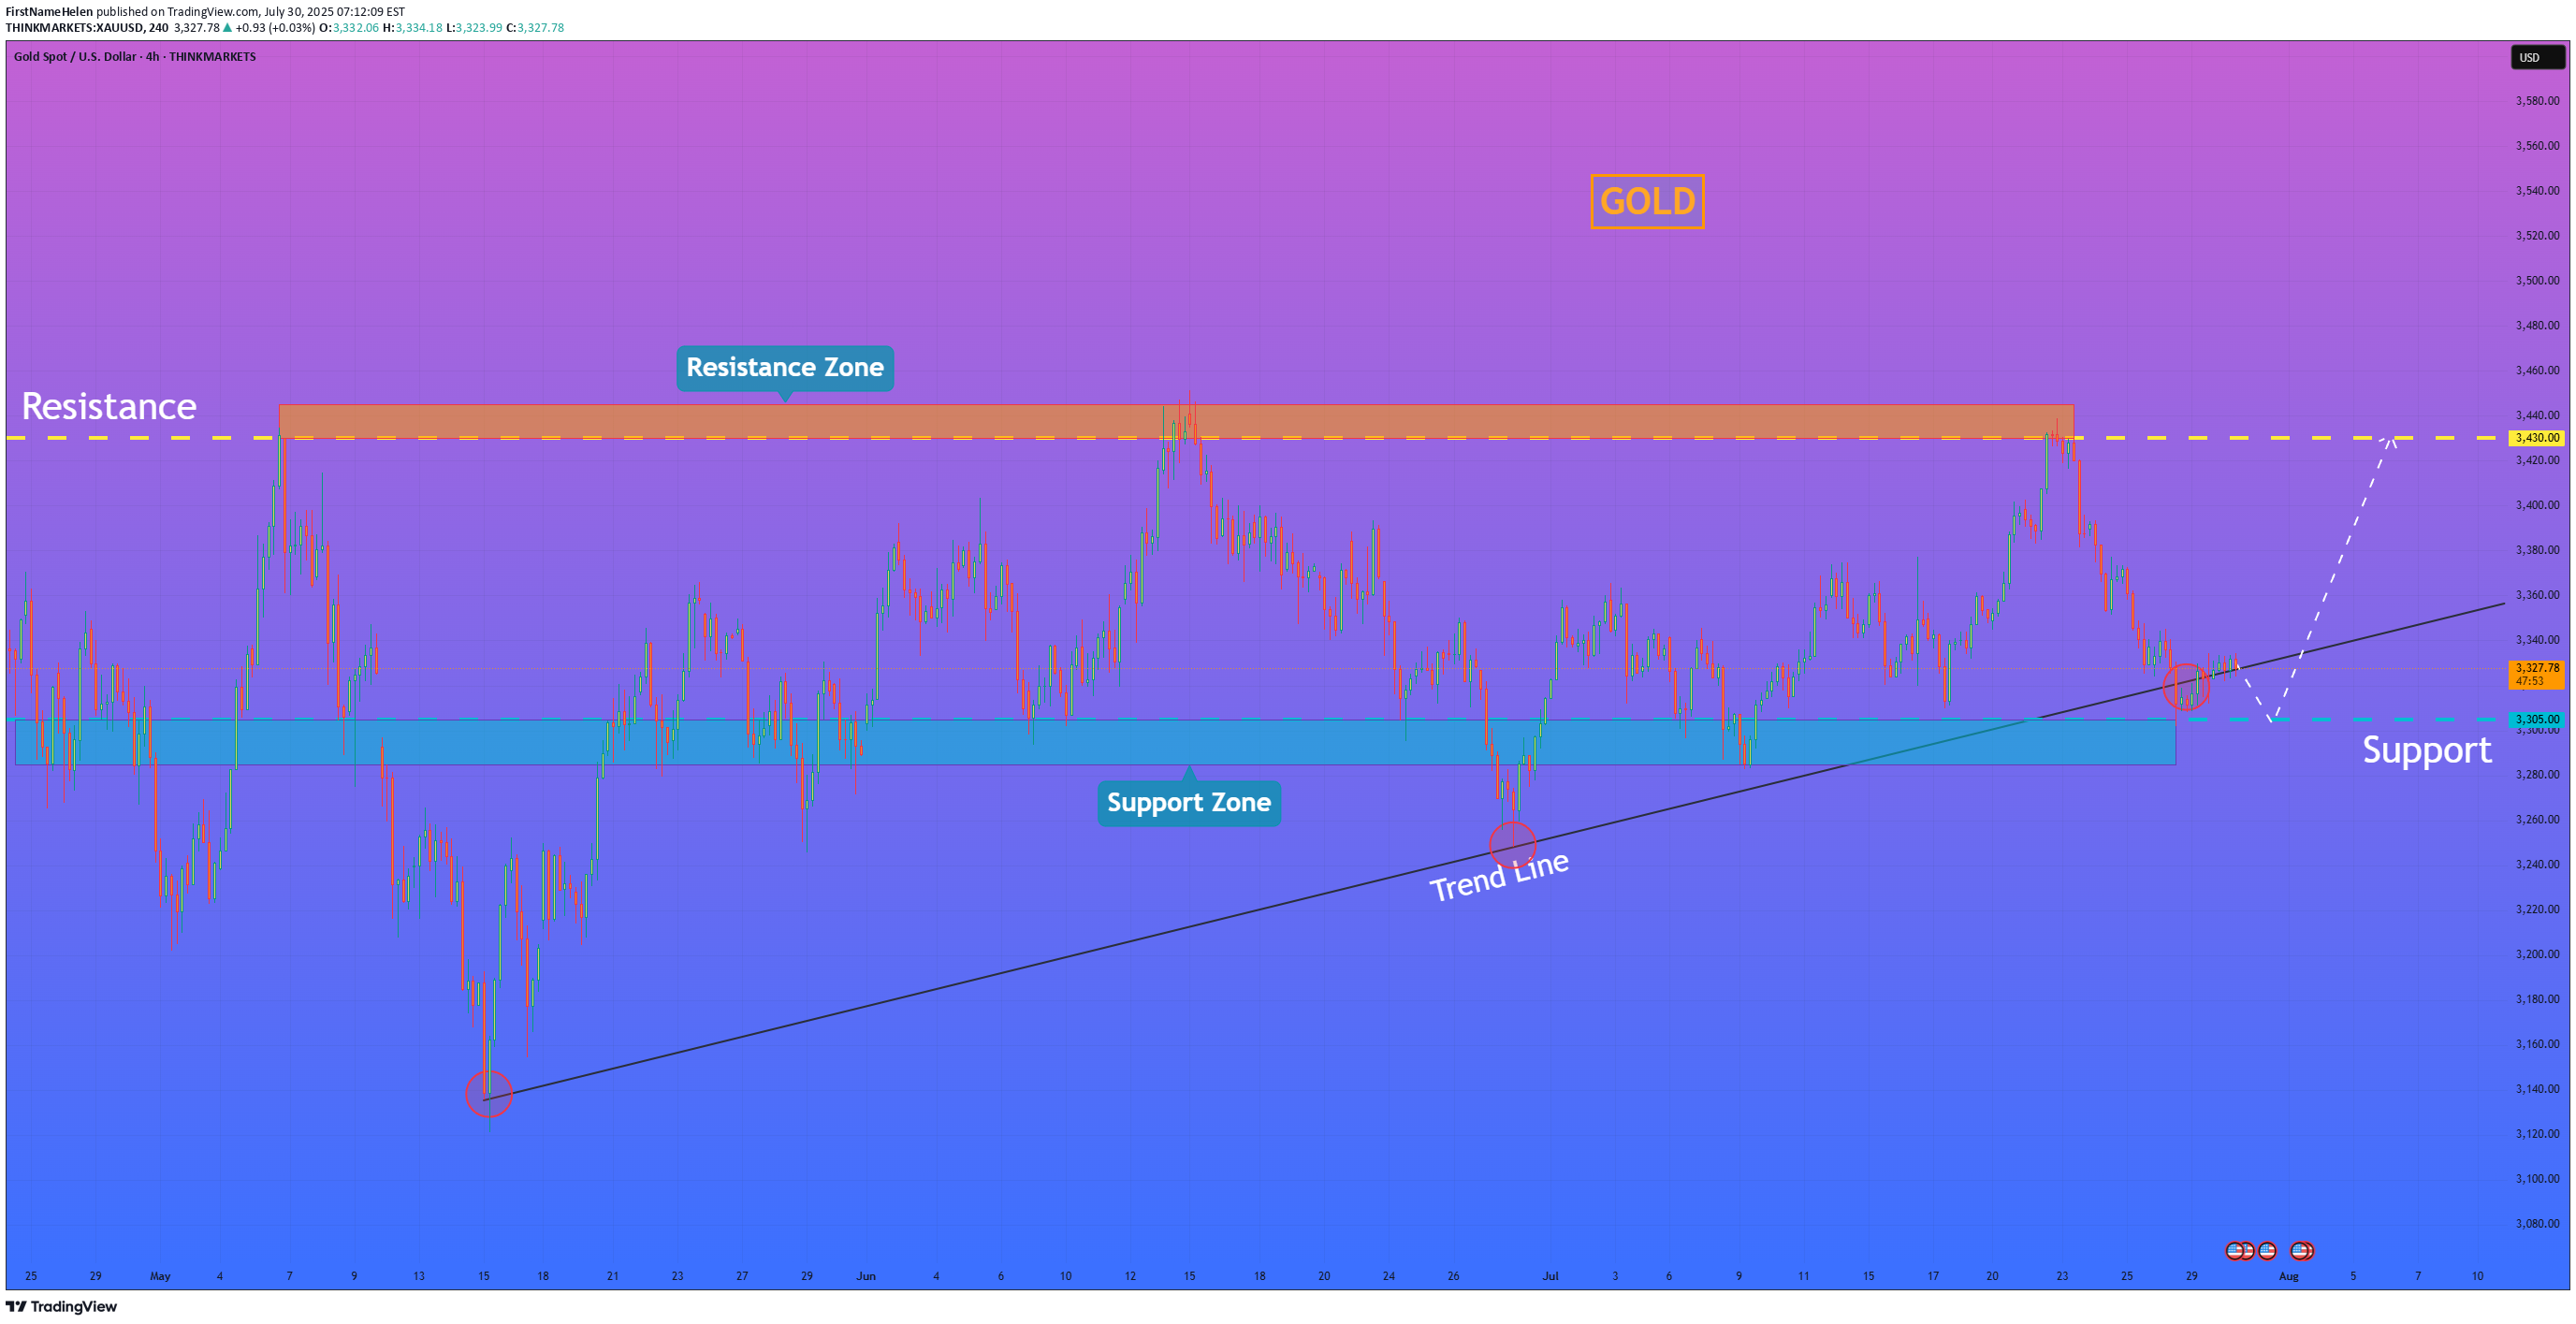
Hi folks today I'm prepared for you Gold analytics. An examination of the chart highlights a well-established long-term uptrend, with the bullish structure being clearly defined by a major ascending trend line that has consistently provided dynamic support. Currently, the price is undergoing a healthy correction after being rejected from the major resistance zone around 3430. This pullback is now guiding the price towards a critical confluence of support, where the aforementioned ascending trend line intersects with a strong horizontal support zone at 3305 - 3285. My analysis for a long position is based on the high probability of a bullish reaction from this key area. I believe that as the price enters this support confluence, it will be met with strong buying pressure, as it represents a logical point for buyers to defend the trend. A confirmed bounce from this zone, demonstrated by a rejection of lower prices, would be the main condition to validate the continuation of the uptrend. Therefore, the primary goal for the subsequent rally is set at the 3430 resistance level, as a retest of the recent high is the most logical objective following a successful defense of the trend. If you like my analytics you may support me with your like/comment ❤️ Disclaimer: As part of ThinkMarkets’ Influencer Program, I am sponsored to share and publish their charts in my analysis.Good! Price declined, even below support level and recently it started to grow.Price continues to decline.
FirstNameHelen
HelenP. I Bitcoin will rise to trend line and then drop
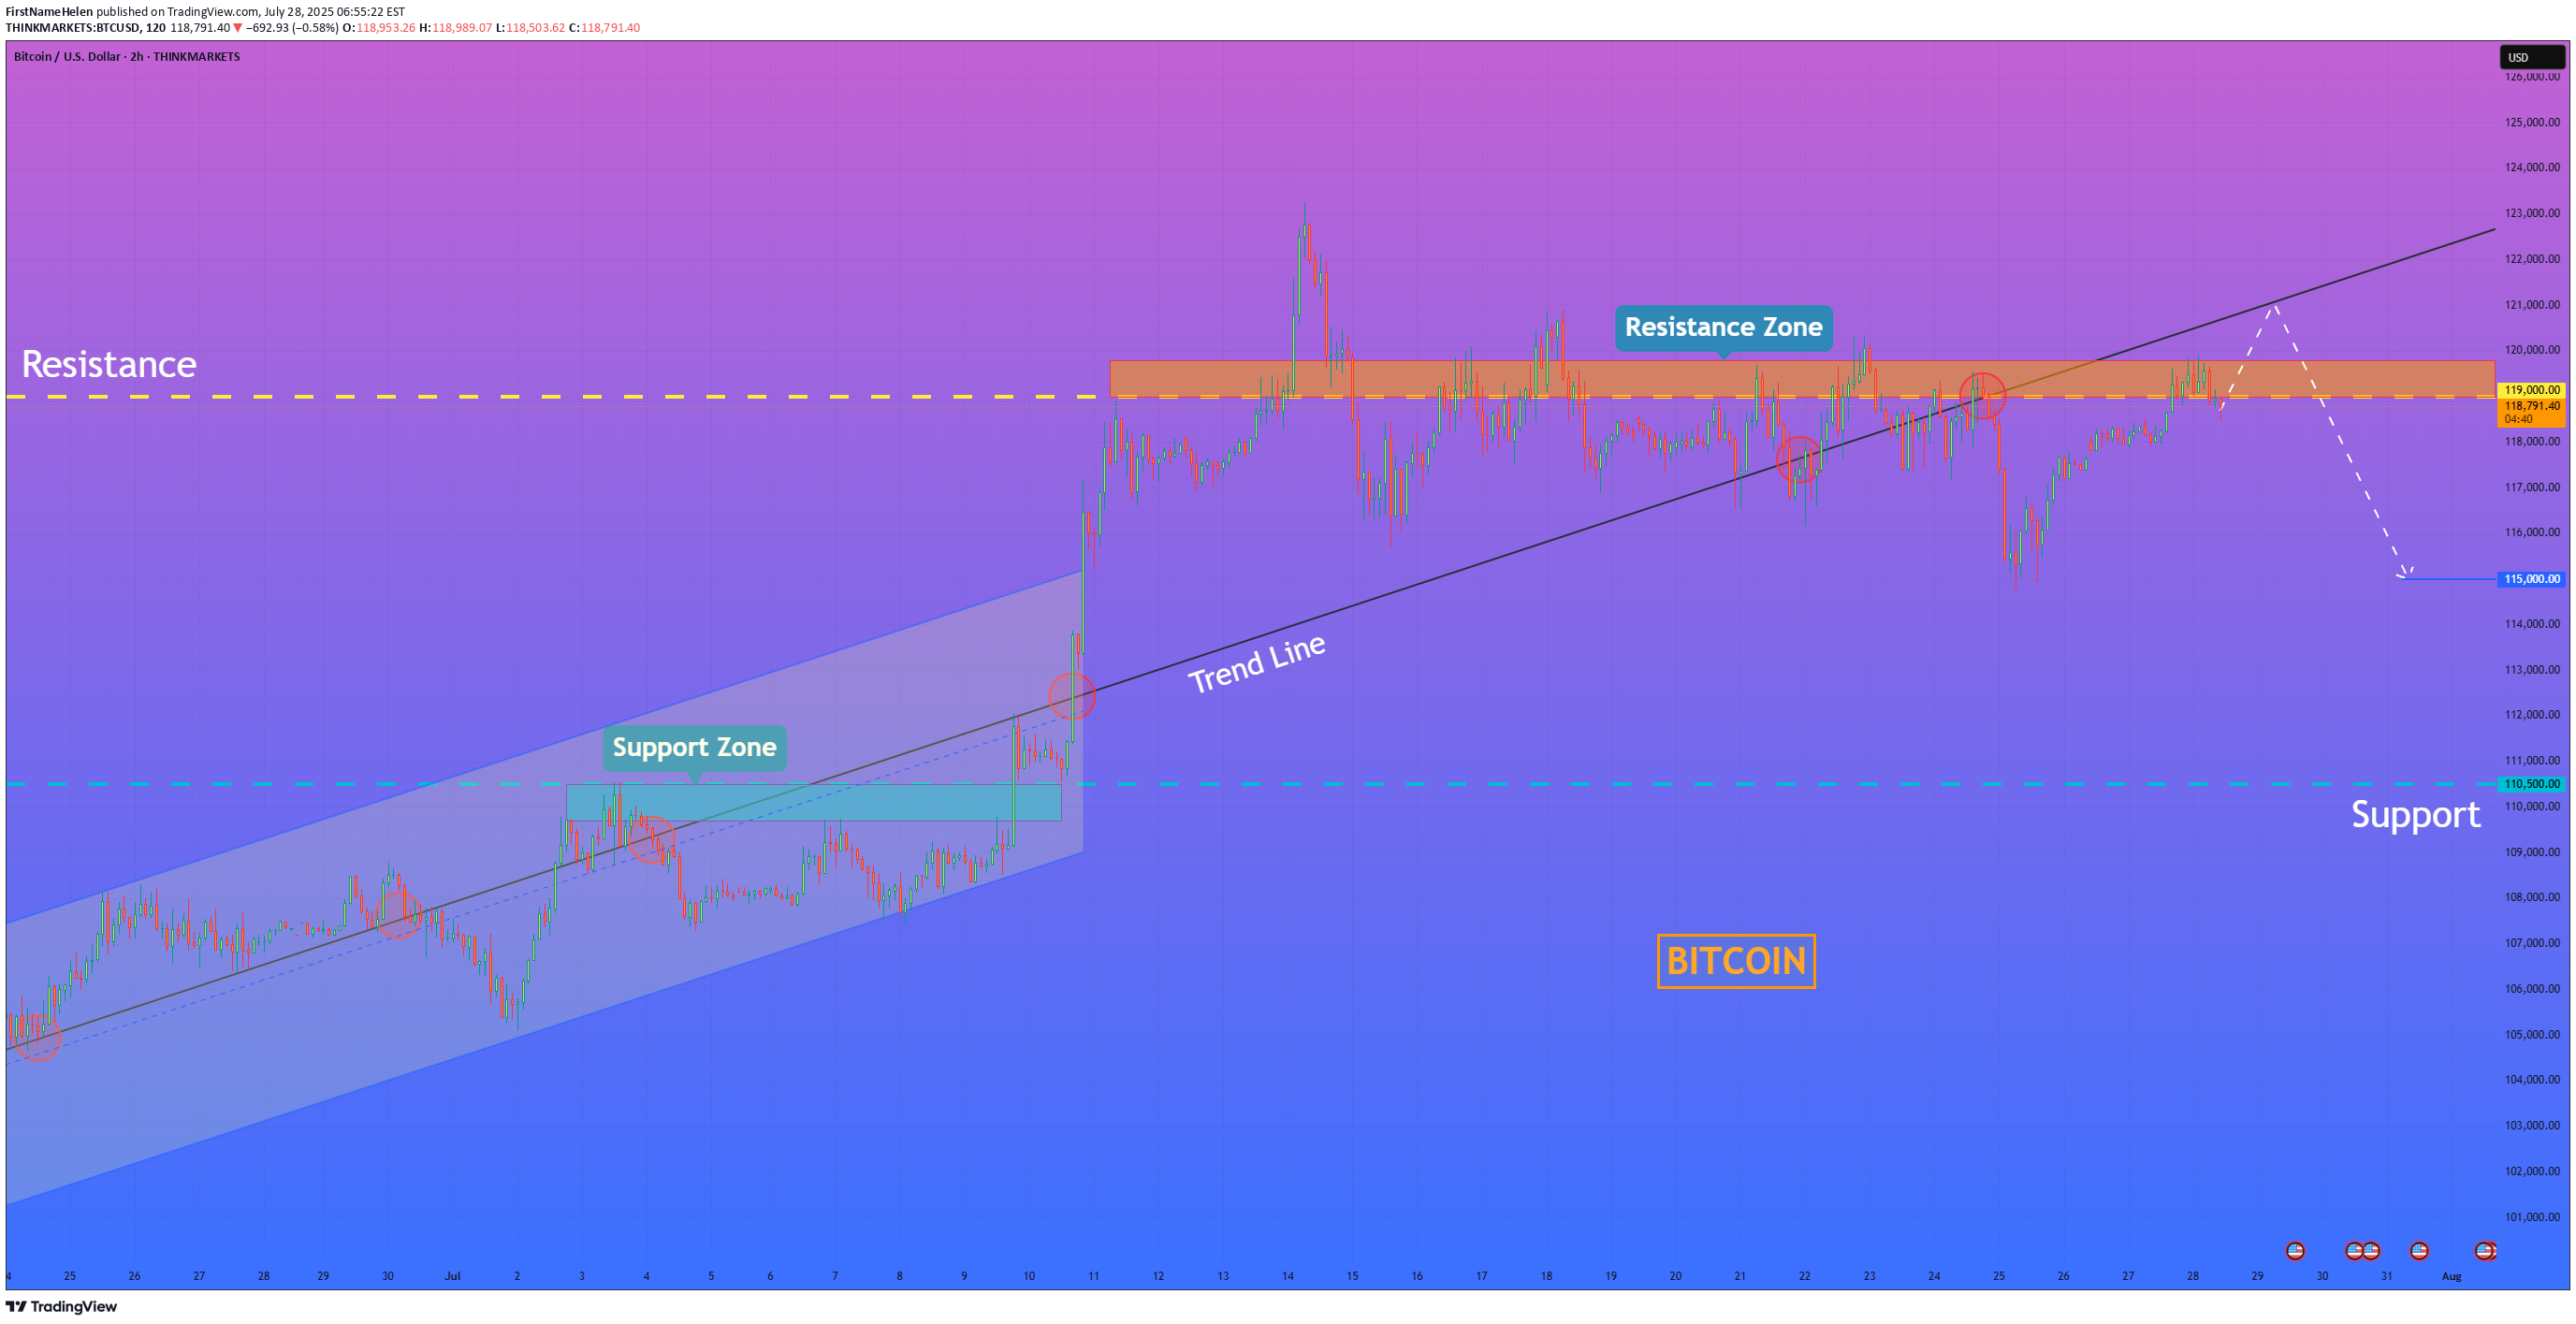
Hi folks today I'm prepared for you Bitcoin analytics. If we look at the Bitcoin chart, a significant structural change has recently taken place, with the price decisively breaking below the major ascending trend line that had defined the long-term uptrend. This breakdown is a strong signal that the market character has shifted from bullish to bearish, with sellers now in control. The price is currently consolidating below this broken structure, and I believe the former support levels, including the trend line and the horizontal resistance zone at 119000 - 119800, will now act as a formidable confluence of resistance. My analysis for a short position is based on the classic break-and-retest principle. I expect the price can rise to the trend line and then drop. A strong and clear rejection from this area would serve as the primary confirmation that the breakdown is valid and that the path of least resistance is now to the downside. Therefore, I have set the goal for this developing downward move at the 115000 level. If you like my analytics you may support me with your like/comment ❤️ Disclaimer: As part of ThinkMarkets’ Influencer Program, I am sponsored to share and publish their charts in my analysis.
FirstNameHelen
HelenP. I Gold can continue to decline to support zone
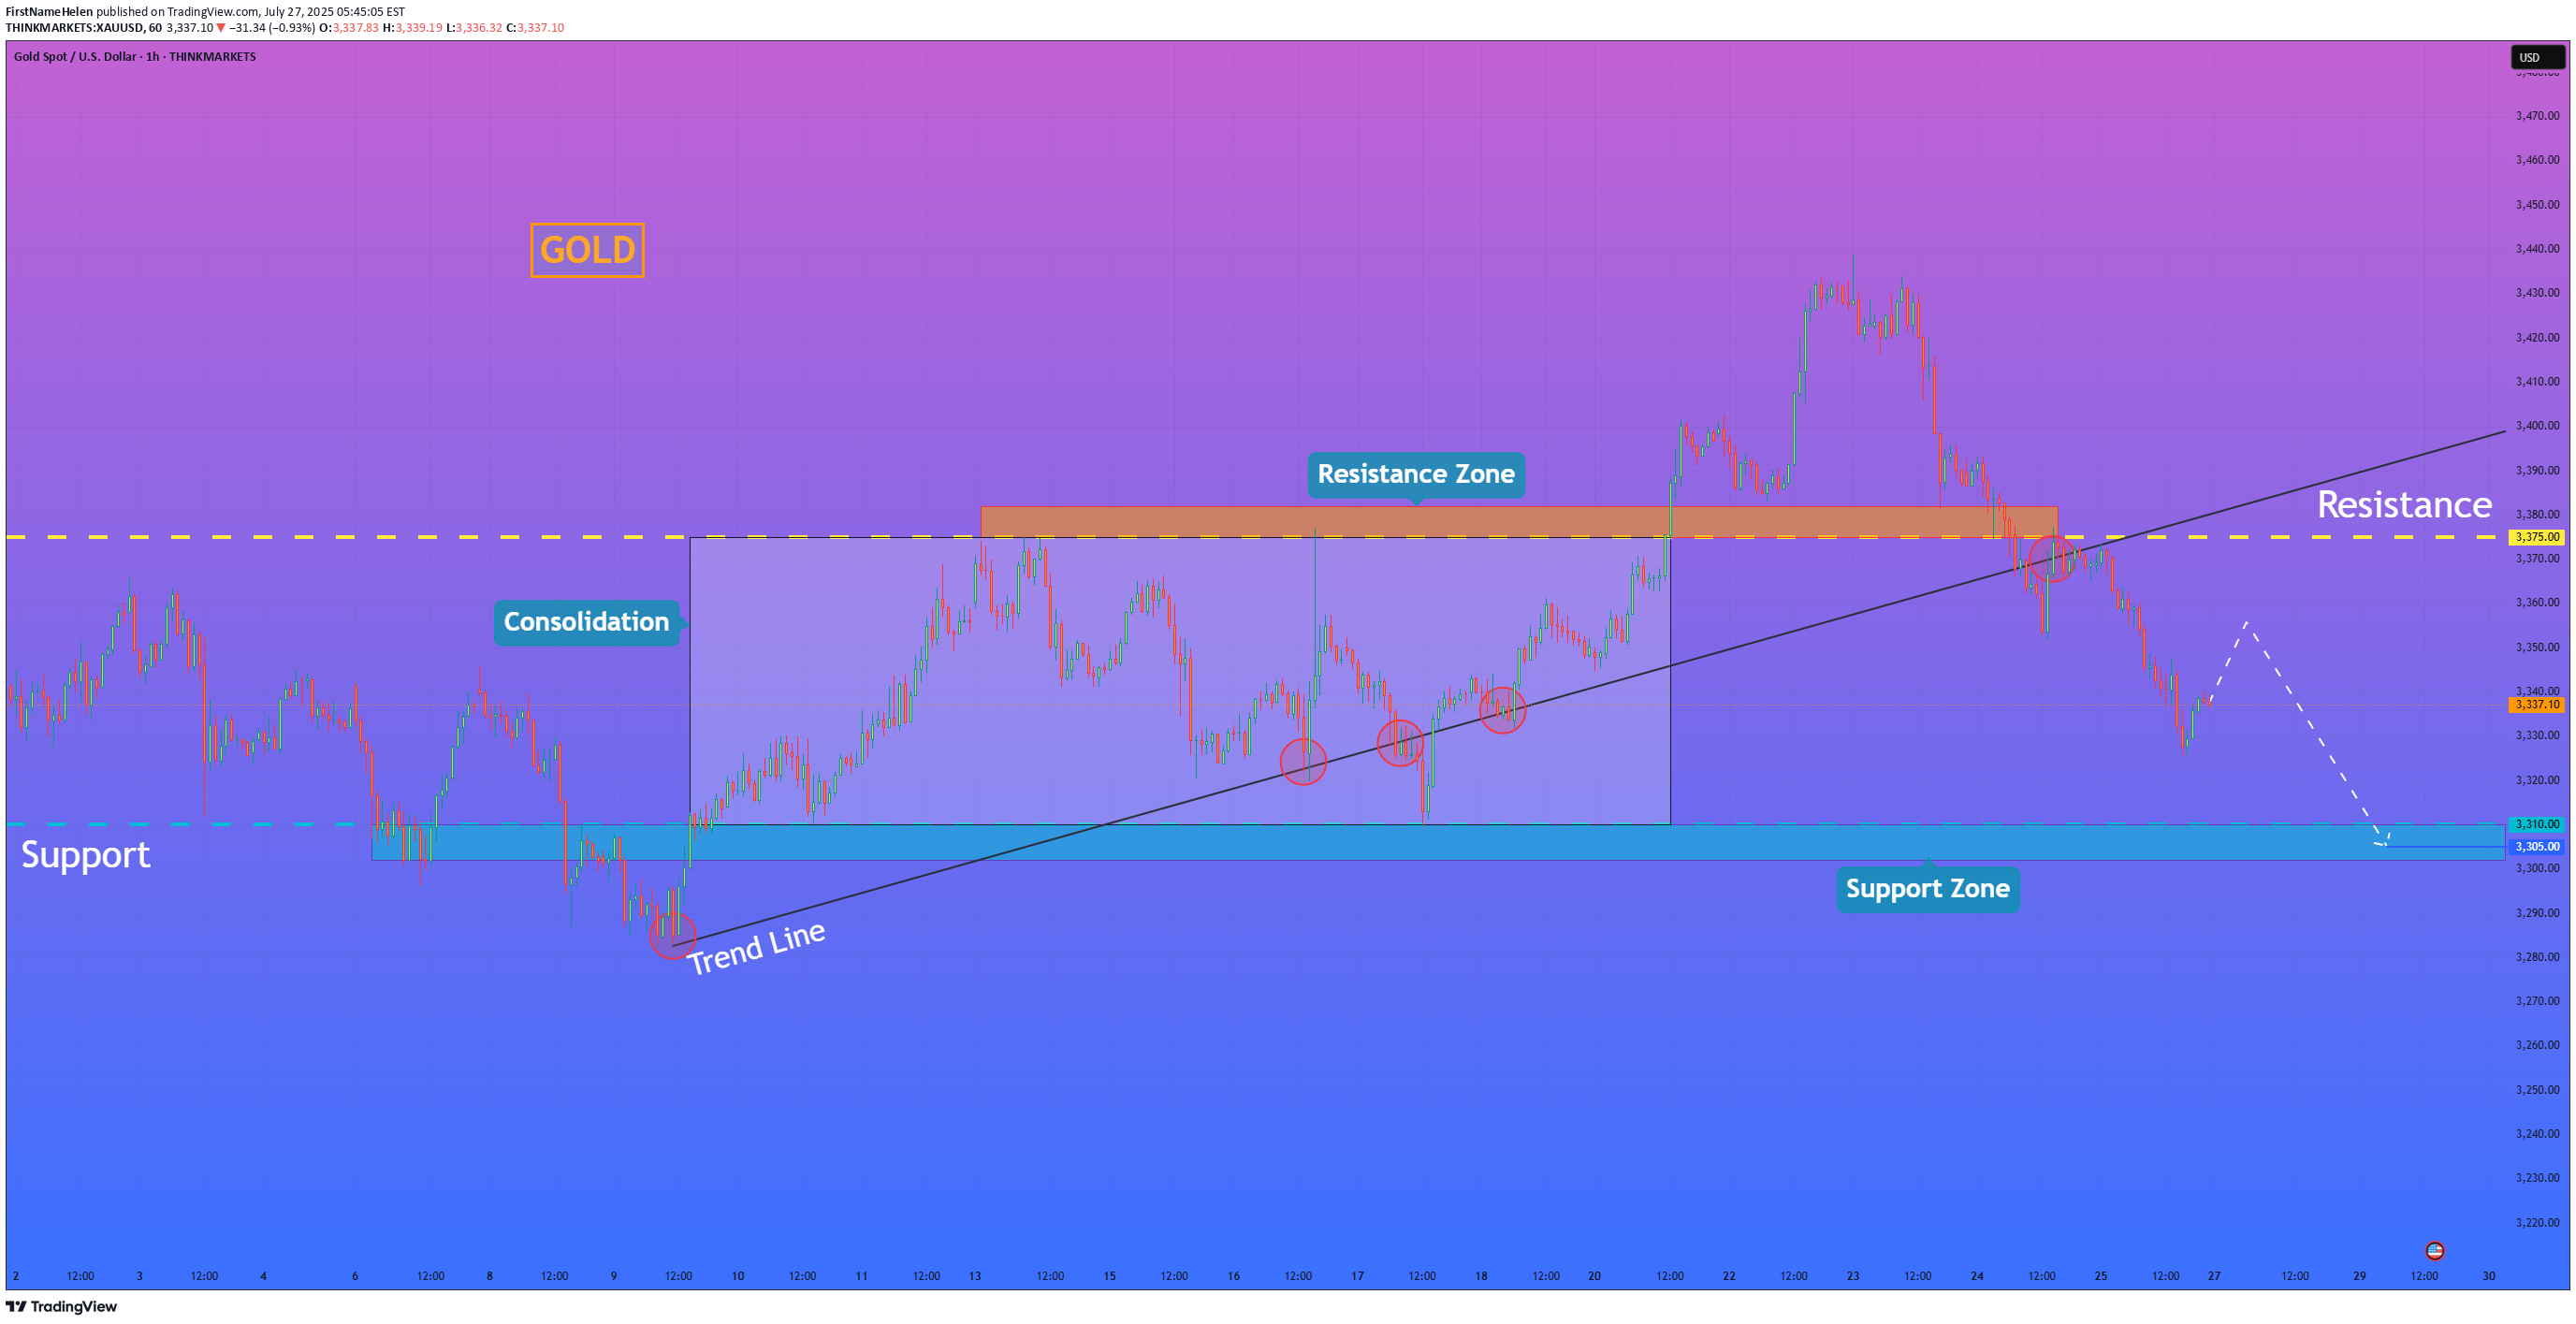
Hi folks today I'm prepared for you Gold analytics. If we look at the price chart, we can observe a significant shift in the market structure, highlighted by the recent decisive break of a long-standing ascending trend line. This event suggests that the previous bullish momentum has been exhausted and that sellers are now taking control. The bearish case is further strengthened by the price trading below the key horizontal zone around 3375, which previously acted as support during the consolidation phase and is now poised to act as strong resistance. My analysis for a short position is built on this structural change. I believe that any attempt by the price to rally back towards the broken trend line or the 3375 resistance zone will likely be met with significant selling pressure, confirming the new downward trend. A rejection from this area would be the key condition validating the bearish bias. Therefore, the primary goal for this developing downward impulse is set at the 3305 level, as this aligns with the next major support zone where the price is likely to find its next pause. If you like my analytics you may support me with your like/comment.❤️ Disclaimer: As part of ThinkMarkets’ Influencer Program, I am sponsored to share and publish their charts in my analysis.Price rose a little and now continue to decline.
FirstNameHelen
HelenP. I Bitcoin can fall to support zone and then start rise
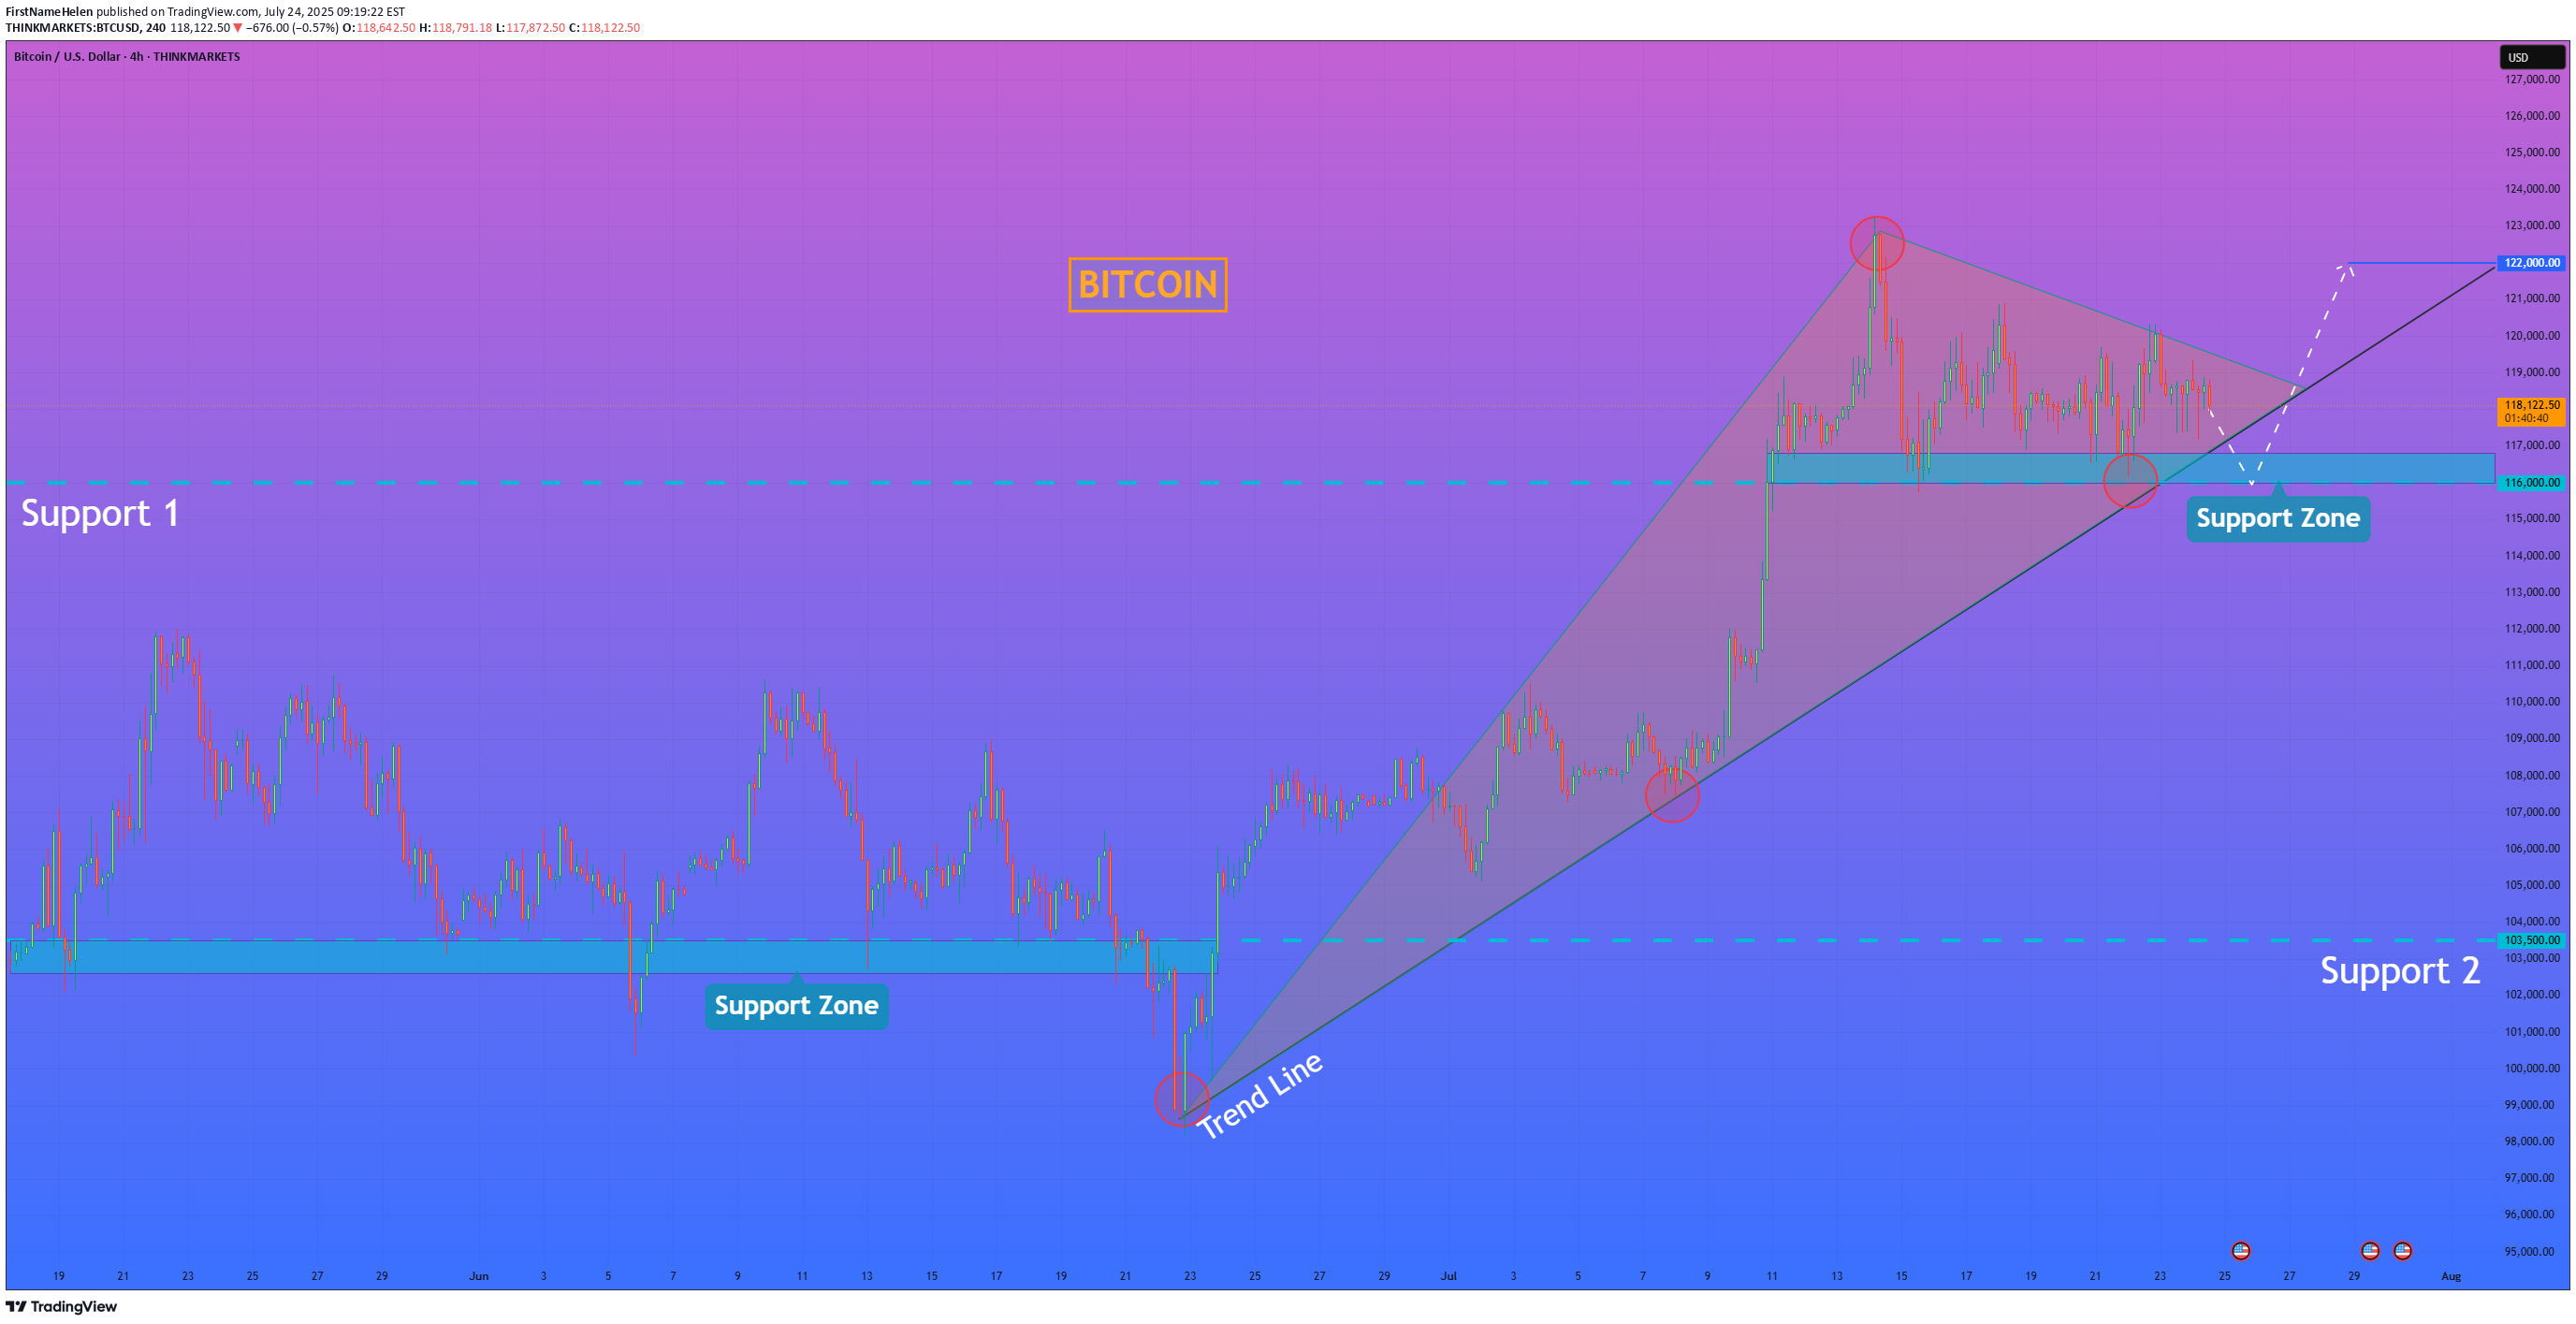
Hi folks today I'm prepared for you Bitcoin analytics. If we look at the Bitcoin chart, the most prominent feature is the formation of a large bullish pennant following a strong upward impulse. This type of consolidation pattern typically suggests that the market is pausing to gather strength before continuing in the direction of the primary trend. The price is currently consolidating within the boundaries of this pennant, which are defined by an upper resistance line and a strong ascending trend line acting as the lower support. It is crucial to note the confluence of this ascending trend line with the horizontal support zone between 116000 and 116800, creating a powerful area of potential support. My analysis is based on the expectation that the price will make a final test of this key support confluence. I believe that a dip towards the 116000 - 116800 zone will be met with strong buying interest. A clear rejection from this area, confirming that buyers are defending both the horizontal and dynamic support, would be the critical condition validating a long position. A successful bounce should provide the catalyst for a bullish breakout from the top of the pennant, signaling the resumption of the uptrend. Therefore, I have set the primary goal for this subsequent upward move at the 122000 level, a logical target that would confirm the continuation of the bullish market structure. If you like my analytics you may support me with your like/comment ❤️ Disclaimer: As part of ThinkMarkets’ Influencer Program, I am sponsored to share and publish their charts in my analysis.Ok, price declined, now I expect that BTC will start to move up.
FirstNameHelen
HelenP I. Gold, after small correction, can continue to move up
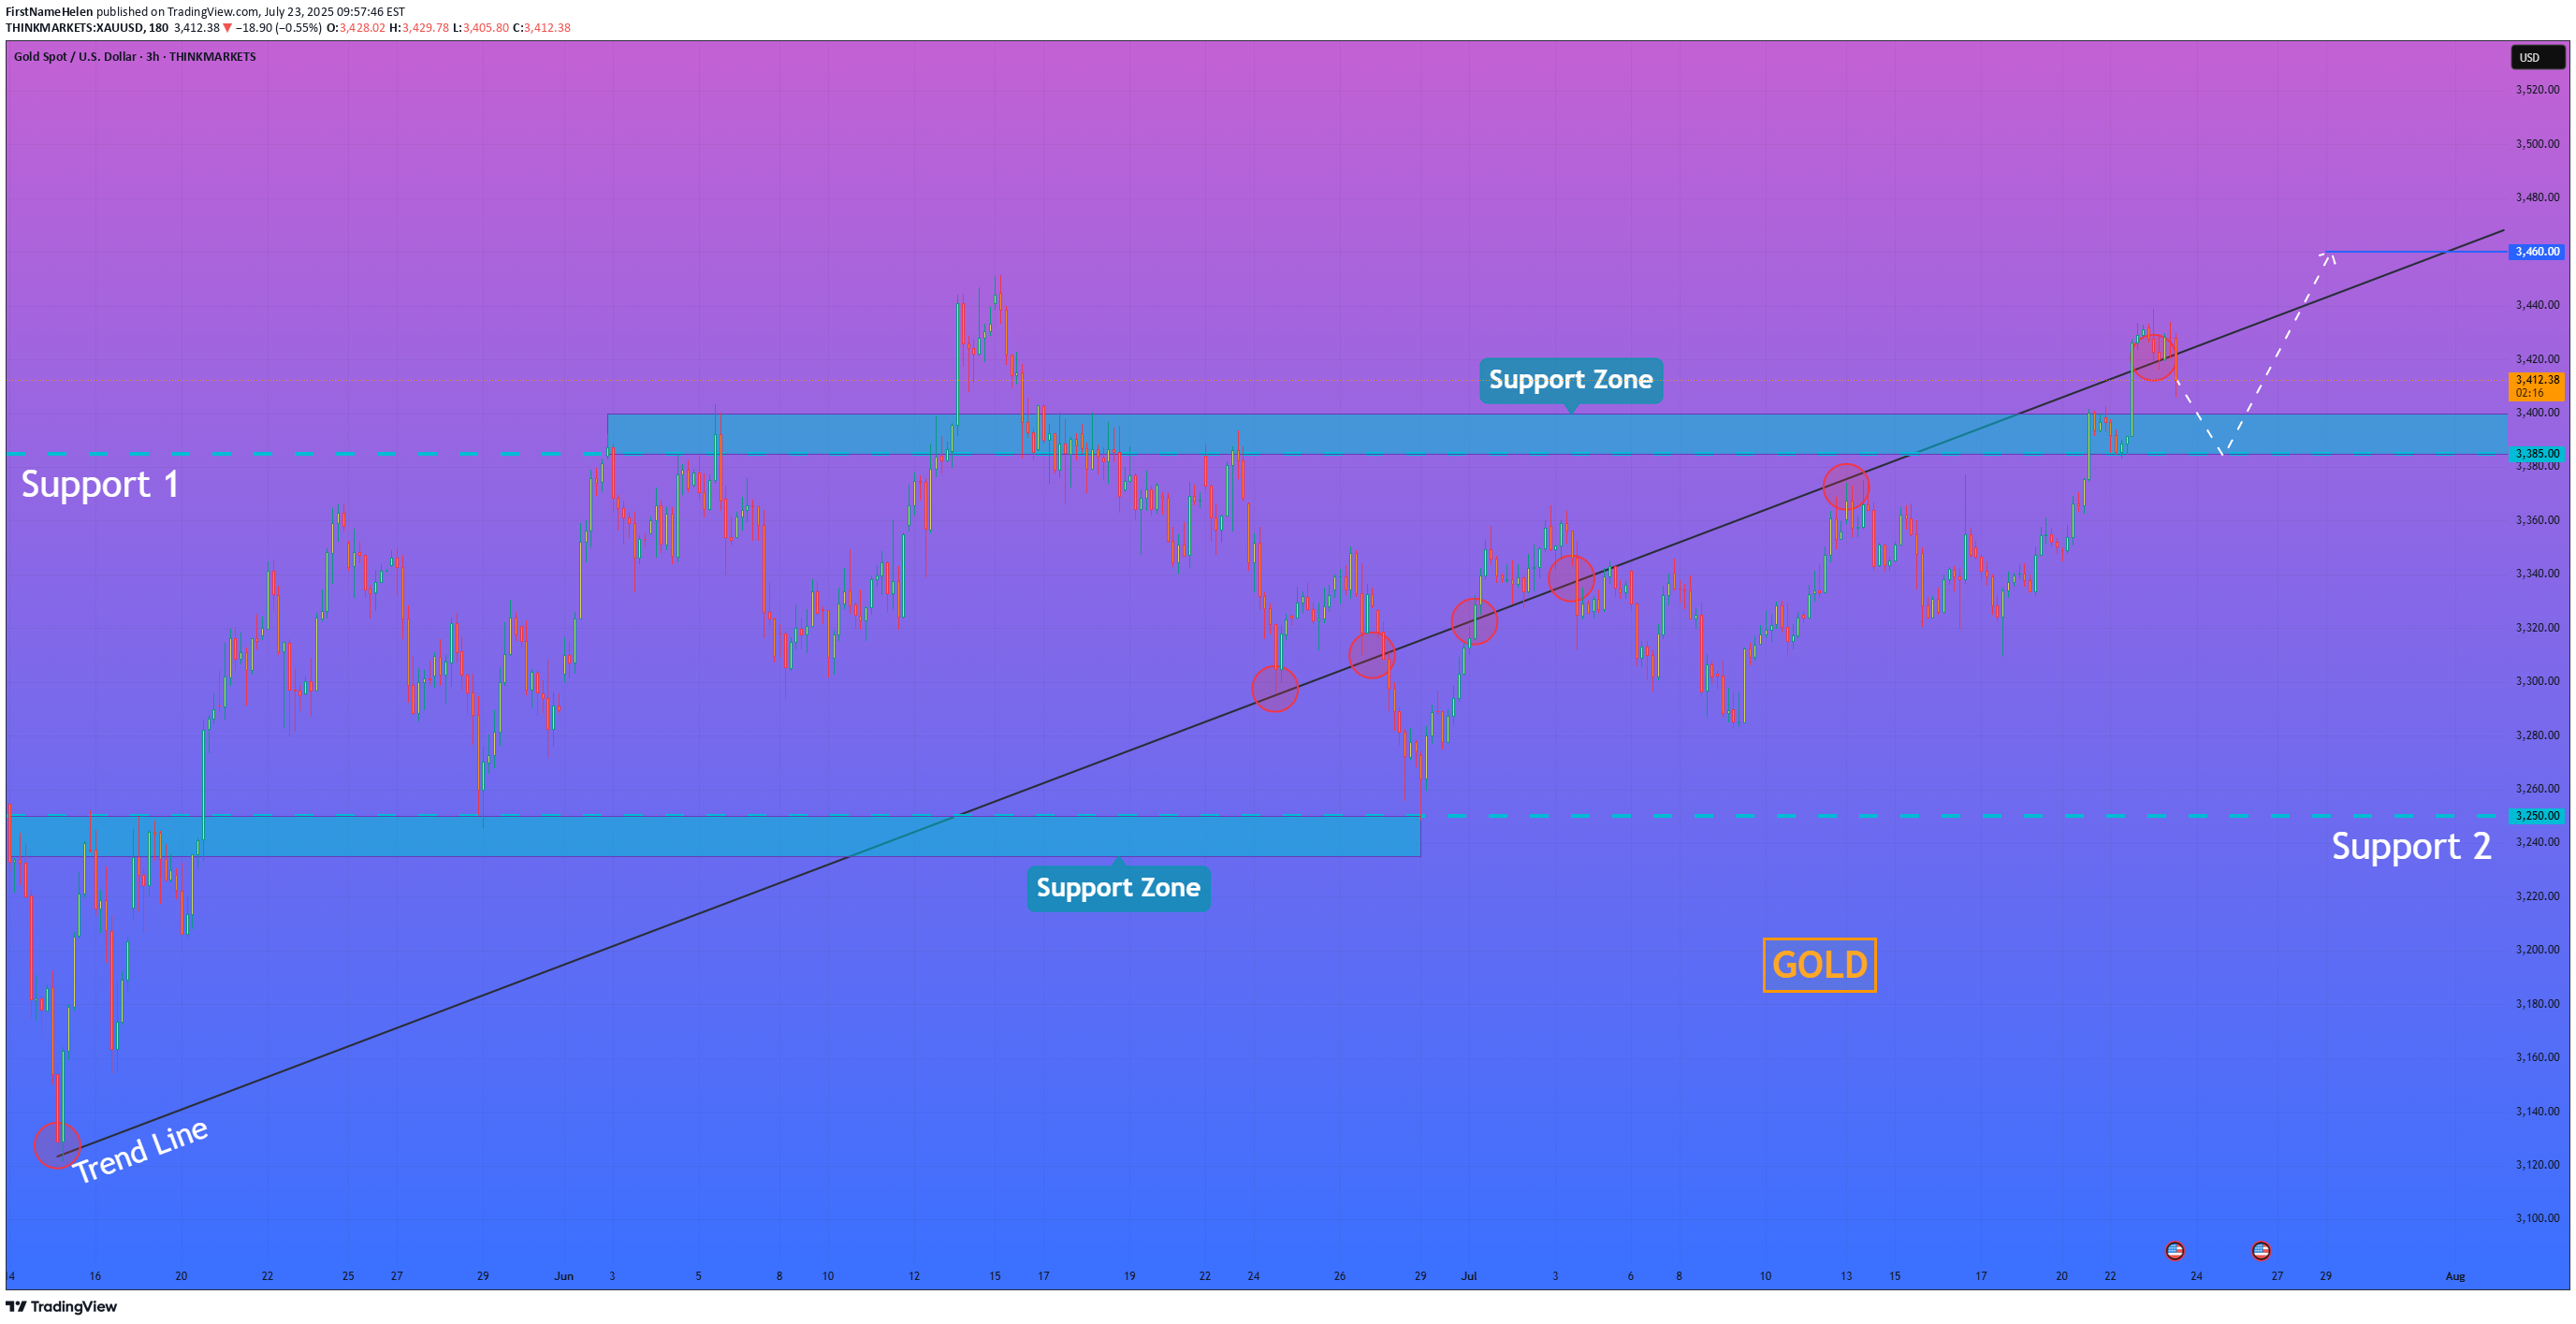
Hi folks today I'm prepared for you Gold analytics. If we look at the chart, the dominant feature is a strong, sustained bullish trend defined by a major ascending trend line that has repeatedly served as a reliable foundation for the price, confirming that buyers currently maintain firm control. At present, the price action is consolidating above a crucial horizontal pivot area, the support zone between 3385 and 3400. The significance of this zone is high, as it's a classic polarity point where previous resistance has flipped to become support, suggesting a concentration of buying interest. My core analysis hinges on the scenario of a brief, healthy corrective move down to retest this support zone. I believe this retest is a key market dynamic to confirm buyers' commitment. If the price dips into the 3385-3400 area and is met with a decisive rejection of lower prices, it would provide a powerful signal that the underlying bullish sentiment remains fully intact. A successful defense of this zone would be the primary trigger, creating the momentum for the next upward leg. Therefore, I have set the primary goal for this move at the 3460 level. If you like my analytics you may support me with your like/comment.❤️ Disclaimer: As part of ThinkMarkets’ Influencer Program, I am sponsored to share and publish their charts in my analysis.
FirstNameHelen
HelenP. I Bitcoin will rebound from trend line and rise to $123K
Hi folks today I'm prepared for you Bitcoin analytics. If we look at the chart, we can see a very clear and long-term bullish structure. The entire uptrend is supported by a major ascending trend line that has acted as a reliable foundation for the price for a significant amount of time. Currently, the price is consolidating above this crucial trend line and is interacting with the key support zone between 117500 and 116700 points. I believe that the most probable scenario here is a brief corrective move downwards for the price to properly retest the main ascending trend line. This type of retest is often a healthy sign in a strong trend, as it allows for the confirmation of support and gathers momentum for the next leg up. A strong rebound from this trend line would serve as a powerful signal that the buyers are still in control. Therefore, once the price confirms its bounce from this dynamic support, the path should be clear for a continuation of the uptrend. For this reason, my primary goal for this trade idea is set at the 123000 points. If you like my analytics you may support me with your like/comment ❤️ Disclaimer: As part of ThinkMarkets’ Influencer Program, I am sponsored to share and publish their charts in my analysis.
FirstNameHelen
HelenP I. Gold will little correct and then rise to top of wedge
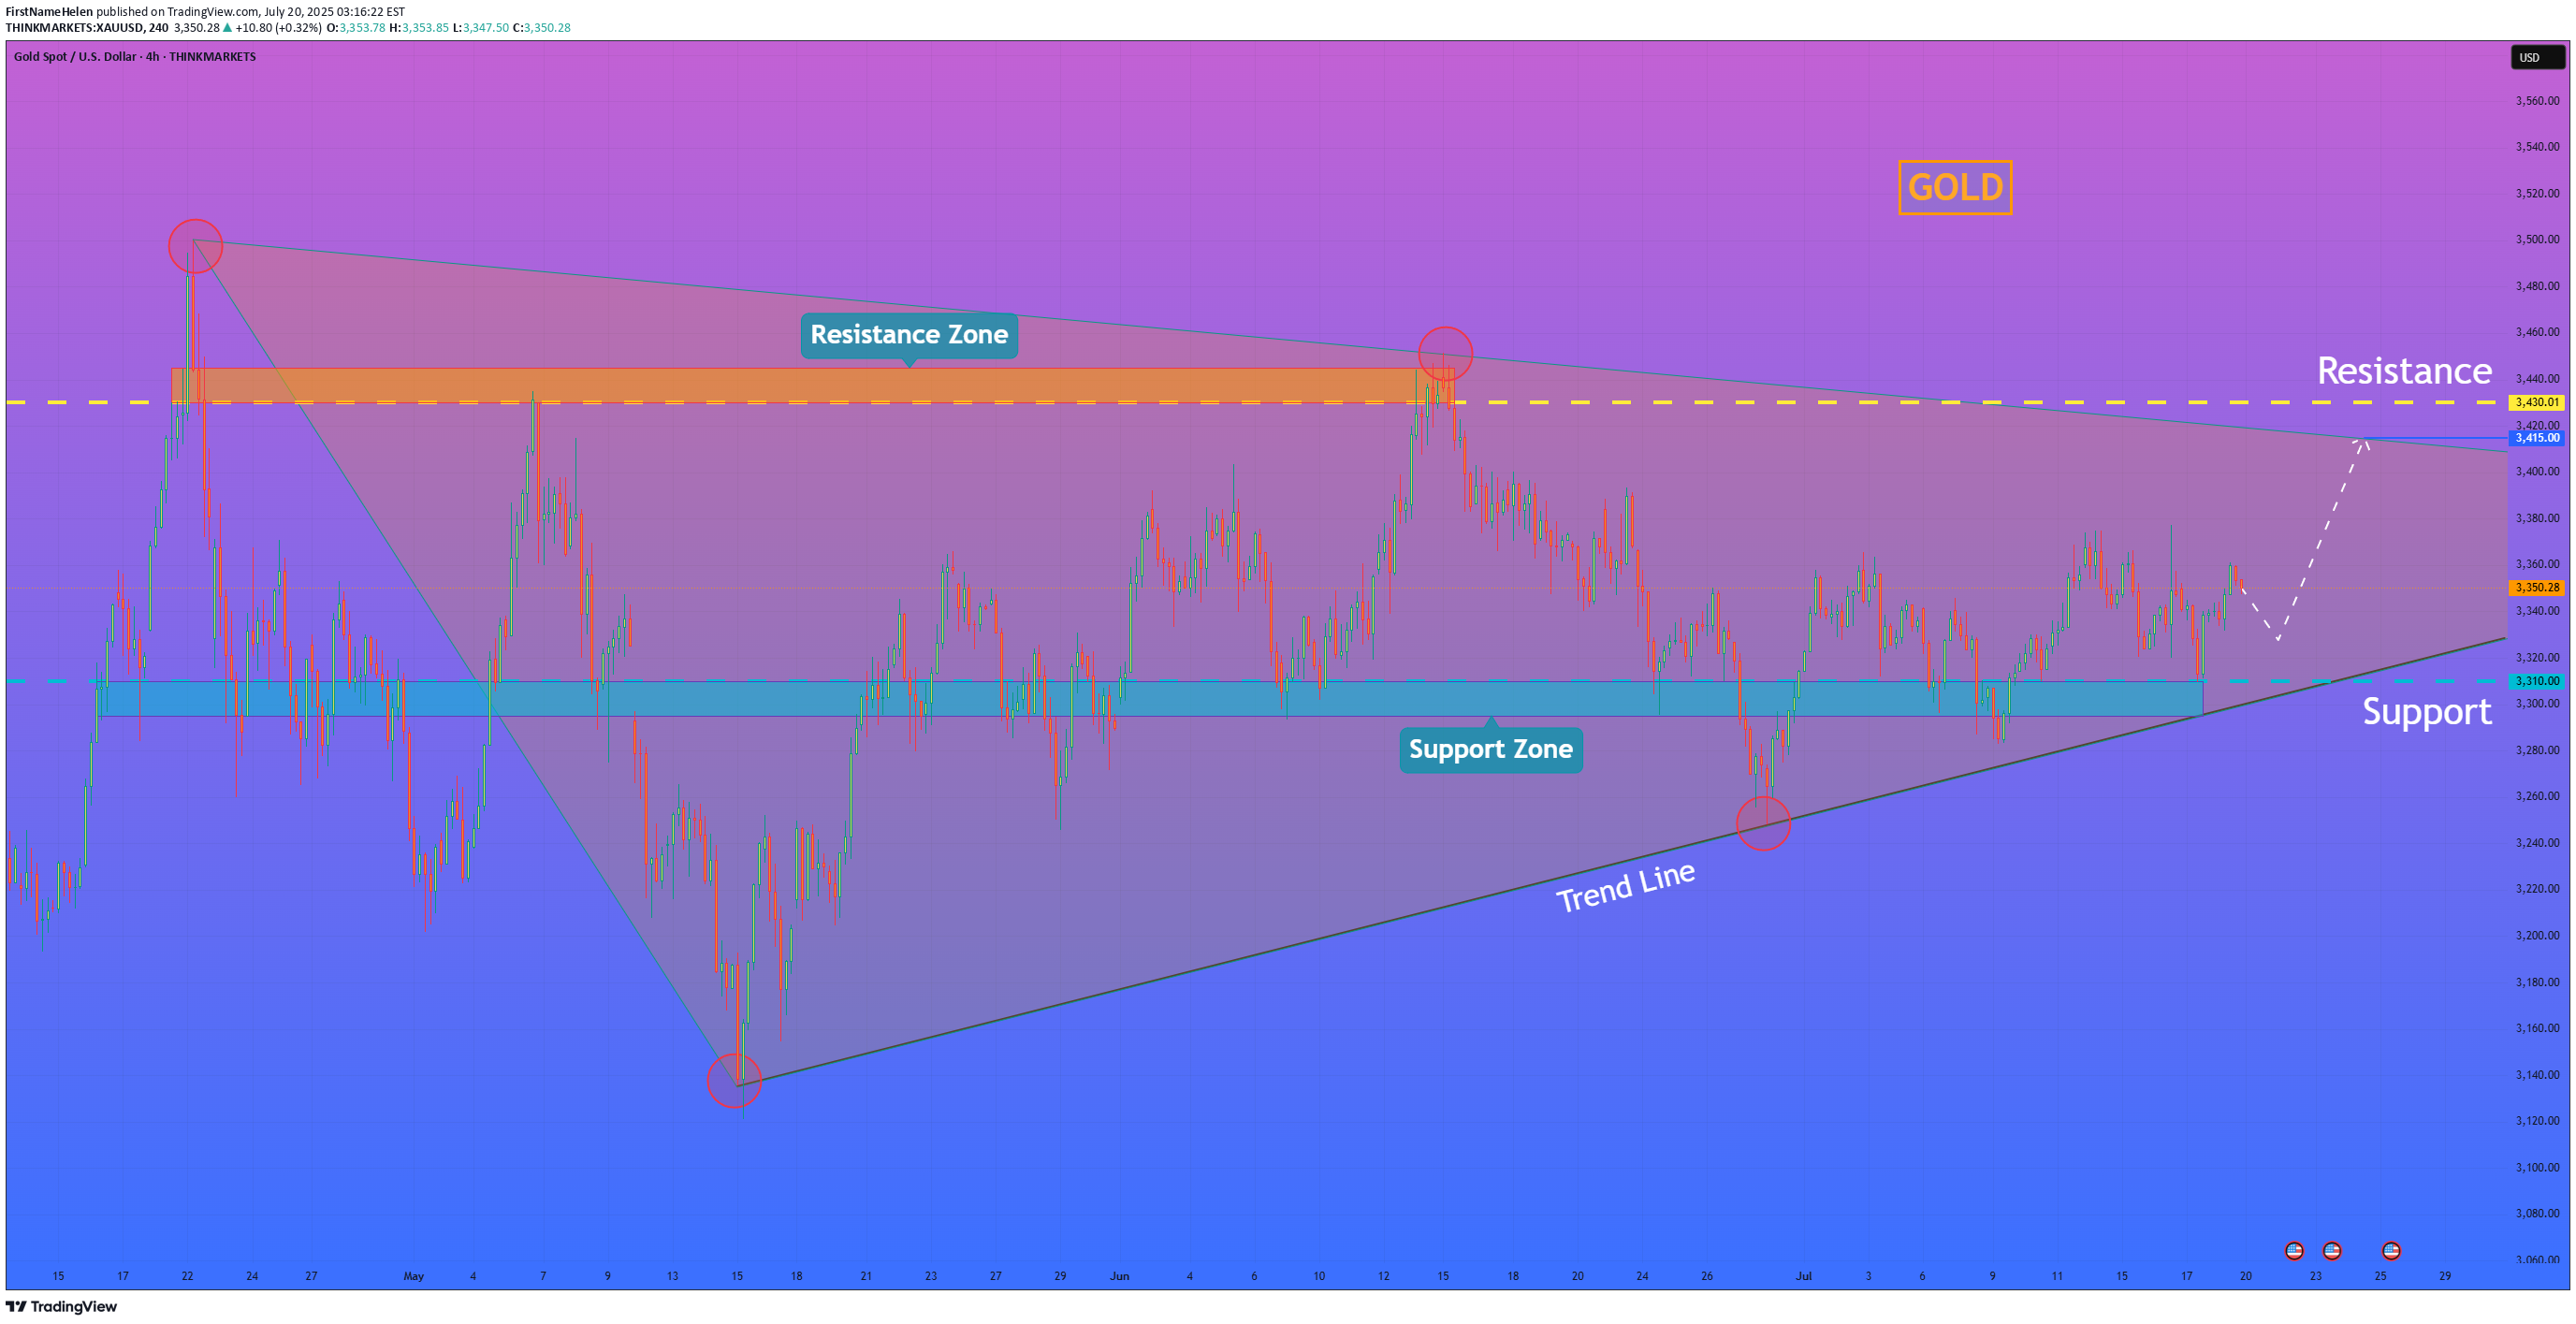
Hi folks today I'm prepared for you Gold analytics. If we look at the chart, we can see a clear ascending wedge pattern that has been guiding the price action. The structure is well-defined by a lower trend line providing consistent support and an upper resistance line. I believe that the key area to watch right now is the support zone between 3310 and 3295 points. The logic is that after the recent push, the price may undergo a small, healthy correction to test this zone's strength. The condition for our bullish scenario to unfold is a successful hold of this support; a bounce or signs of buyer interest in this area would be the confirmation we are looking for. Once this condition is met, I believe that gold will have enough momentum to continue its upward movement within the confines of the wedge. Therefore, the main goal for this scenario is set at 3415 points. This target is not arbitrary; it directly coincides with the resistance line of the wedge, which represents a logical point for the current upward swing to conclude. If you like my analytics you may support me with your like/comment.❤️ Disclaimer: As part of ThinkMarkets’ Influencer Program, I am sponsored to share and publish their charts in my analysis.
FirstNameHelen
HelenP. I Bitcoin will correct to trend line and then start rise

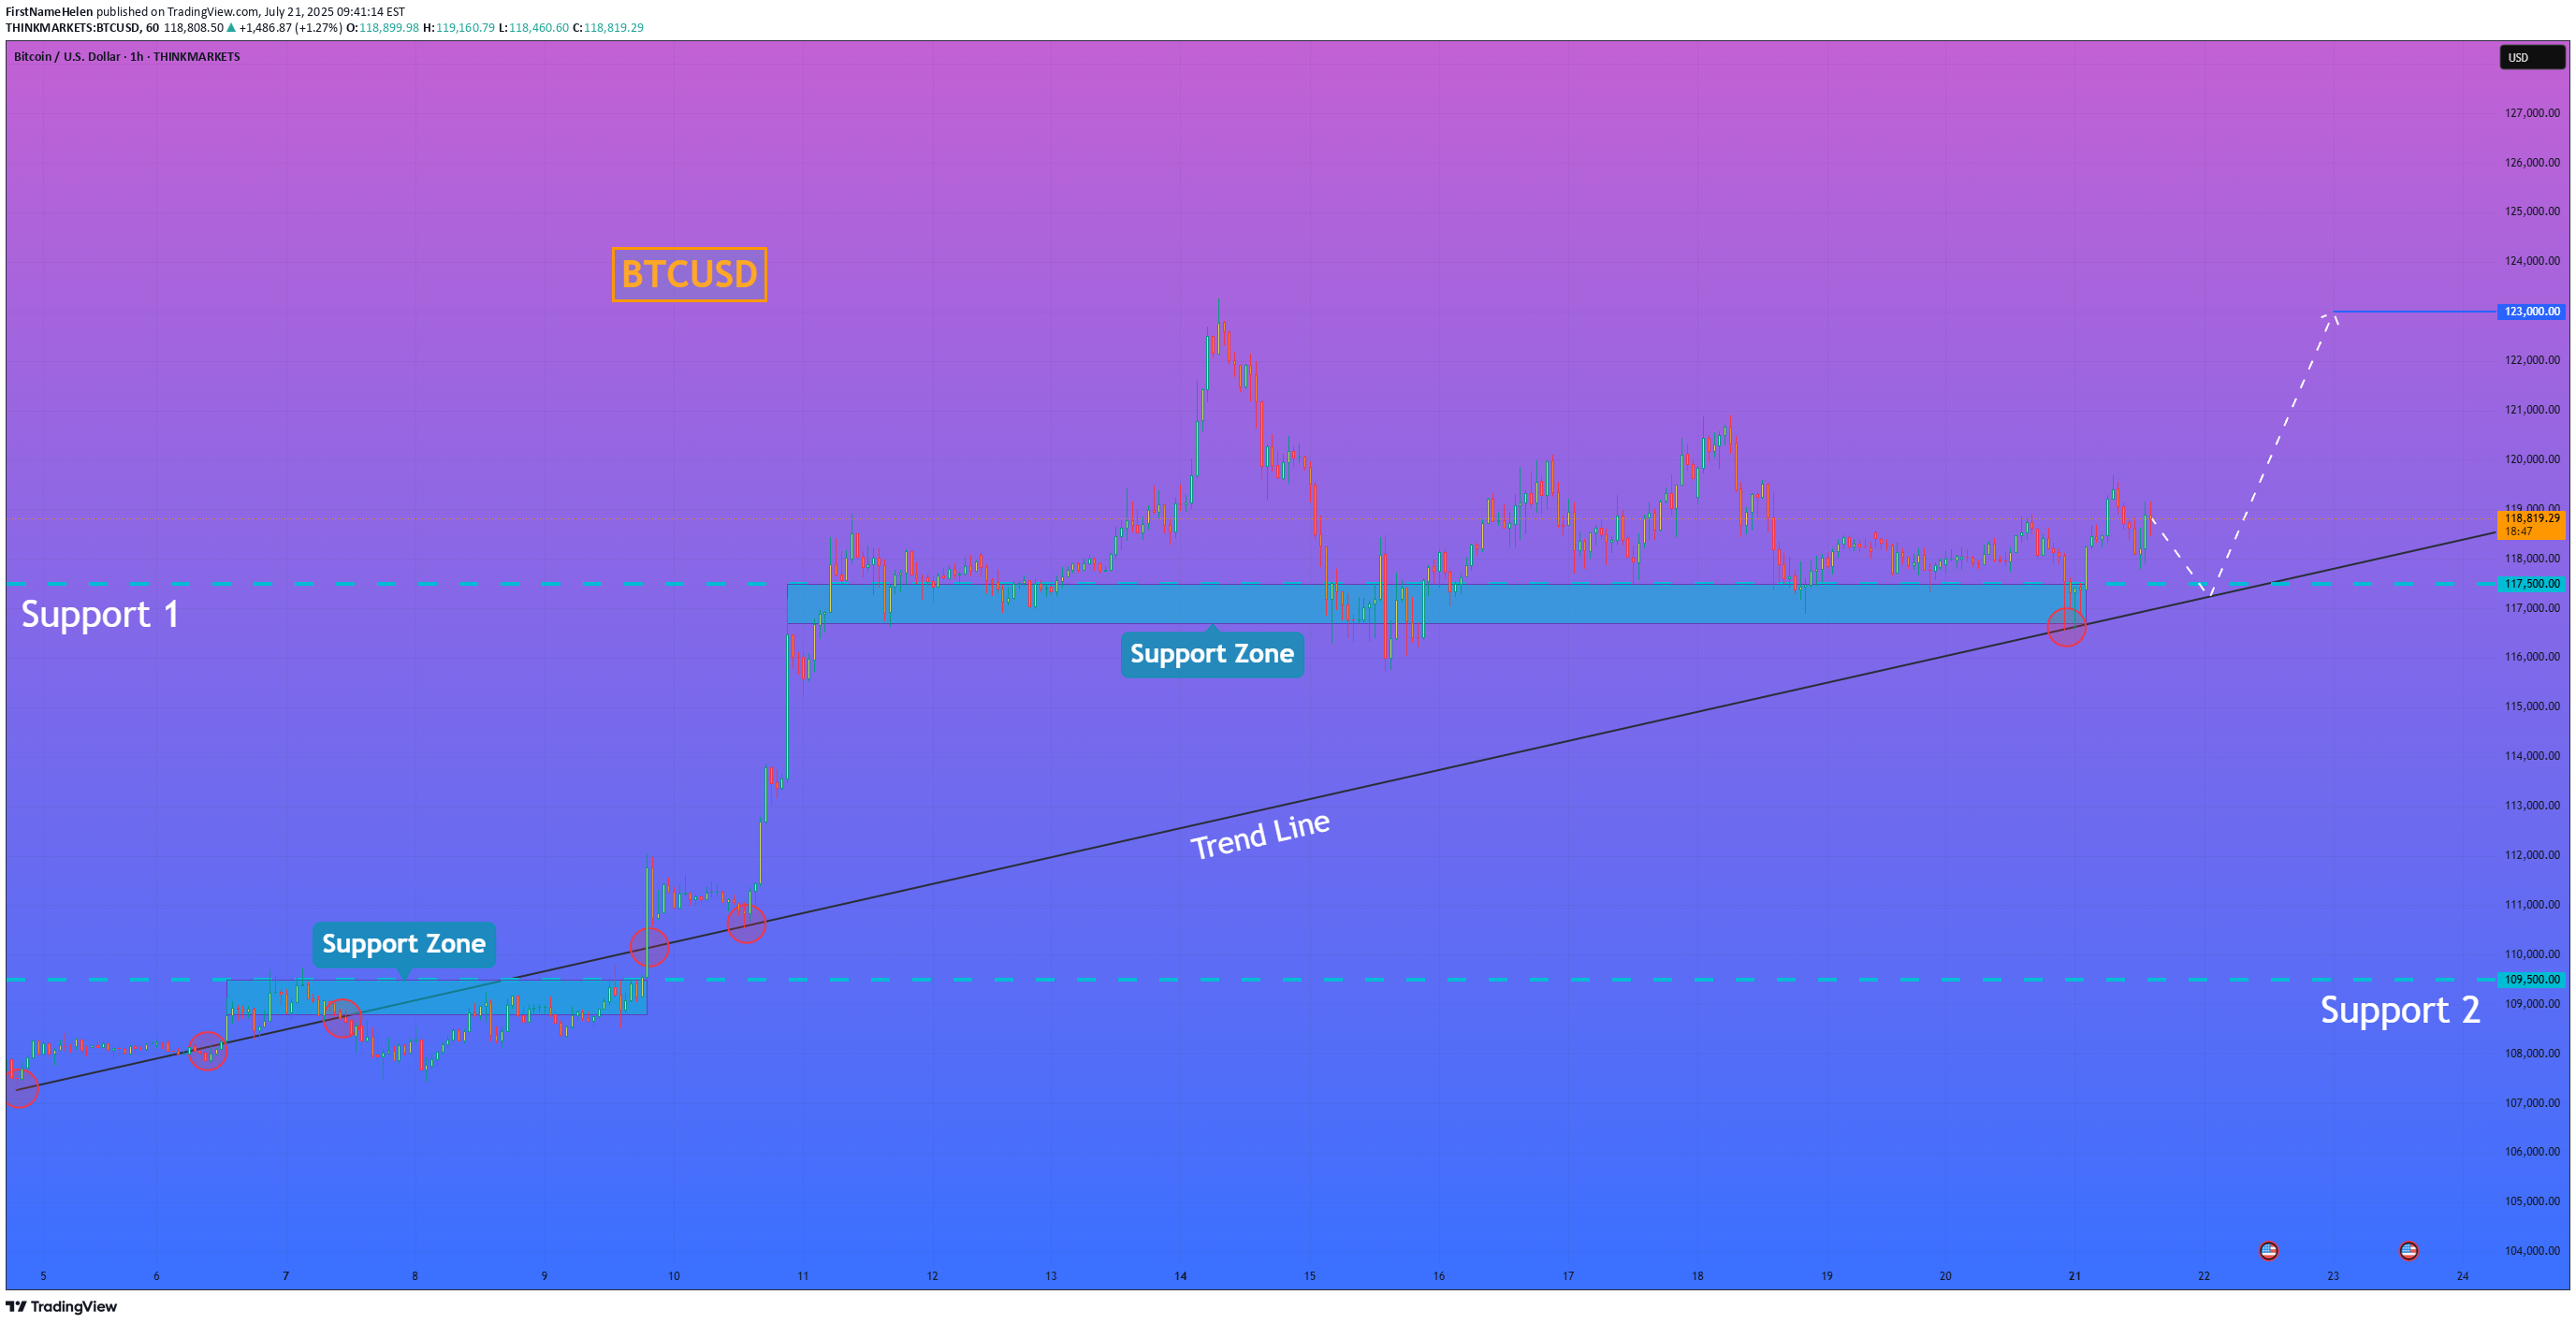
Hi folks today I'm prepared for you Bitcoin analytics. The price has been trading in a strong bullish structure, clearly respecting the ascending trend line since the rebound from the 107500 level. Each time the price touched the trend line, it formed a higher low and continued the upward movement. After breaking through the important Support 1 zone (115500–116500), BTC made a strong impulse upward and reached a local high above 122000 points. Currently, the price is making a pullback and moving closer to the trend line again. This area has previously acted as a major point of interest for buyers, and now it's expected to play a key role once more. The support zone and trend line are converging, which makes this level critical for the next move. I believe BTCUSD will bounce from this area and continue its bullish momentum. My goal is set at 123000 points. Given the market structure, higher lows, and strong reaction from the support zones, I remain bullish and expect further growth from current levels. If you like my analytics you may support me with your like/comment ❤️ Disclaimer: As part of ThinkMarkets’ Influencer Program, I am sponsored to share and publish their charts in my analysis.Nice one! BTC corrected to trend line, so now I expect that it will start to grow next.I think BTC continues to grow close to the trend line, and next week it will reach my goal (new ATH).
Disclaimer
Any content and materials included in Sahmeto's website and official communication channels are a compilation of personal opinions and analyses and are not binding. They do not constitute any recommendation for buying, selling, entering or exiting the stock market and cryptocurrency market. Also, all news and analyses included in the website and channels are merely republished information from official and unofficial domestic and foreign sources, and it is obvious that users of the said content are responsible for following up and ensuring the authenticity and accuracy of the materials. Therefore, while disclaiming responsibility, it is declared that the responsibility for any decision-making, action, and potential profit and loss in the capital market and cryptocurrency market lies with the trader.