
Finn_Oakes
@t_Finn_Oakes

What symbols does the trader recommend buying?
Purchase History
پیام های تریدر
Filter
Finn_Oakes
BTCUSDT: The price continues to be beneficial for buyers
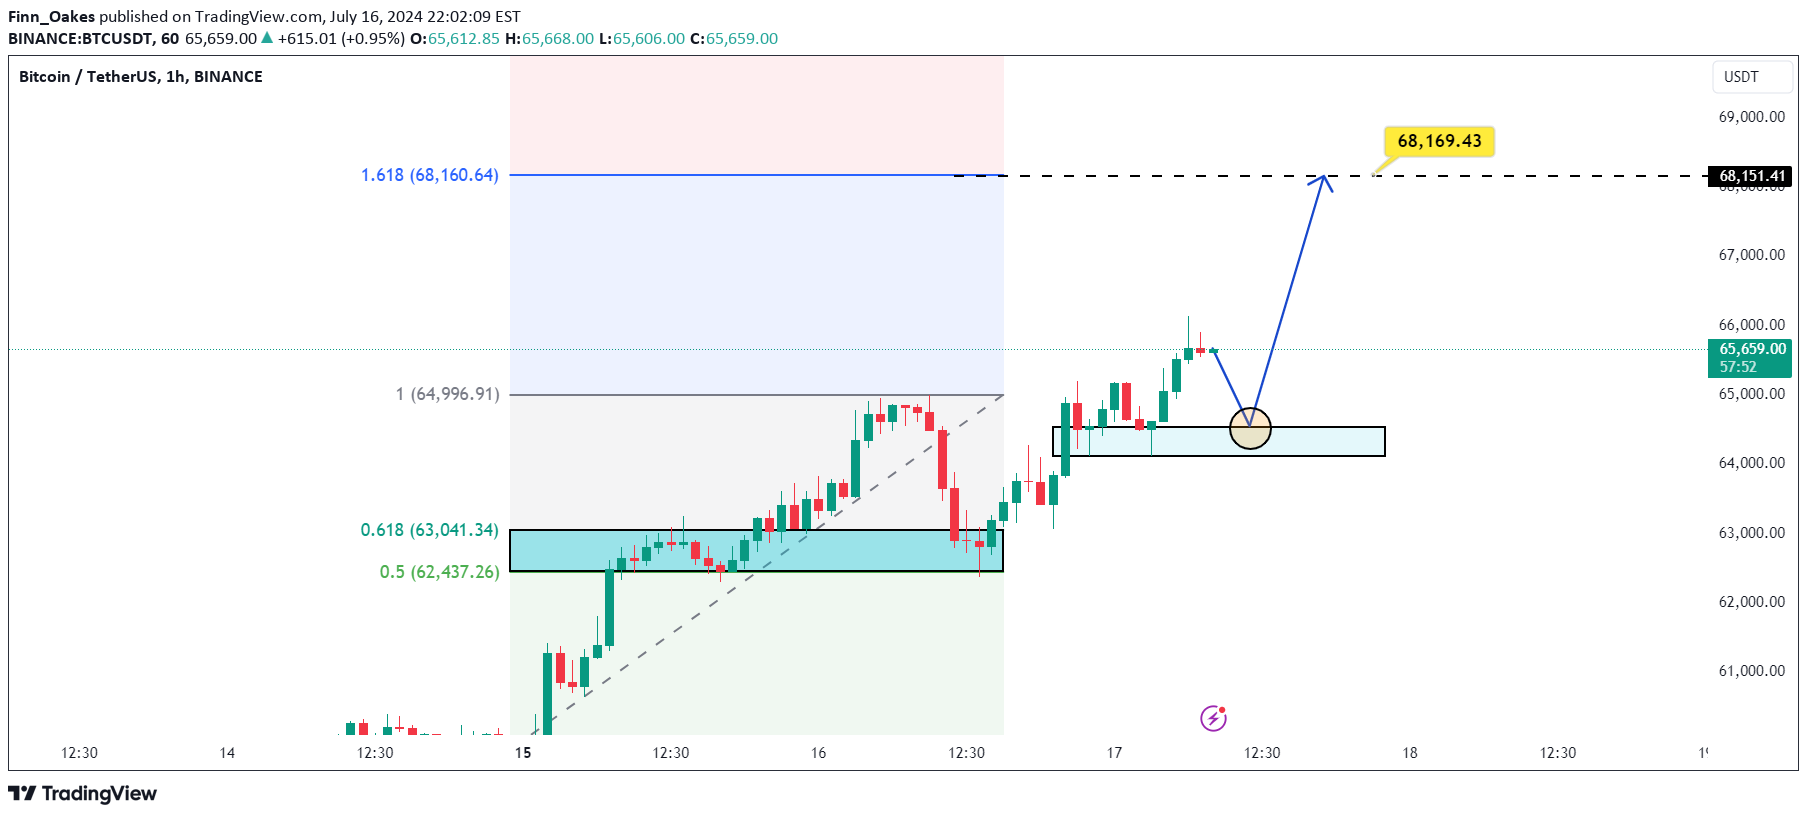
BTCUSDT is currently continuing its recovery, with the price now at 65,500 USD. Utilizing the Fibonacci retracement tool for short-term analysis, it's evident that BTCUSDT has completed its correction at the 0.618 level. Thus, the current strategy should prioritize buying, with a target resistance level of 68,100 USD. That's my perspective and goal. What about you? How do you think we should trade BTCUSDT in this scenario?
Finn_Oakes
BTC USDT: Returning aura to increase prices

Chart Overview: Current price of BTC/USDT: 64,630.01 USD. The chart shows a strong recovery after a period of decline. -Technical Factors: Key Resistance Levels: The 64,881.74 USD level is a critical resistance (Fibonacci level 1). If this level is breached, BTC could move towards the next resistance at 71,475.02 USD (Fibonacci level 1.618). Support Levels: Key support levels are at 60,806.27 USD (Fibonacci level 0.618) and 59,547.36 USD (Fibonacci level 0.5). Exponential Moving Averages (EMA): The EMA 34 (blue) and EMA 89 (purple) are supporting the current bullish trend. The price is currently above both EMAs, reinforcing the bullish outlook. -Trend Forecast: With the strong recovery and potential to break through key resistance levels, BTC/USDT is likely to continue its upward trend. The short-term target is the resistance level of 71,475.02 USD. If the price corrects, the support levels at 60,806.27 USD and 59,547.36 USD offer good entry points for buying. -Trading Recommendations: Buy: Enter long positions if the price breaks above 64,881.74 USD, targeting 71,475.02 USD. Stop Loss: Place stop-loss orders at 60,806.27 USD to protect capital. Good luck with your trading!
Finn_Oakes
BTCUSD: Rest price again!

BTCUSD is currently experiencing a robust recovery, with the price breaking above the resistance level of $62,700 and recording a 3.15% increase in a single day, equivalent to nearly $2,000. This surge has not only surpassed the rising channel but also reached higher levels, fueled by international market volatility and political factors. These indicators suggest that BTCUSD may continue to set new highs, with brief price adjustments at resistance levels, before resuming its strong recovery. The bullish price targets and buying strategies are being closely watched, offering exciting opportunities for investors. Happy trading, and may you succeed!
Finn_Oakes
BTCUSDT trading strategy!

BTCUSDT Analysis Double Top Pattern: Seen around 58,000 USD. Indicates potential bearish reversal. Critical Support Zone: Located at 55,000 USD. If broken, a decline to 54,000 USD or lower is possible. Head and Shoulders Pattern: Potential formation with neckline around 57,000 USD. A break below this level could lead to further bearish movement. Traders should watch these key levels for the next significant move.
Finn_Oakes
BTCUSD today : Should buy or sell ?

Today, BTCUSD is trading around 58,198 USD. The chart displays a Harmonic pattern with key Fibonacci levels completed, indicating a potential short-term price drop. Technical Analysis: Harmonic Pattern: The pattern shows that the price has reached a peak at point D and is now trending downwards. Resistance and Support Levels: Resistance: 59,058 USD Support: 57,335 USD Forecast The price may decline after hitting the resistance level at 59,058 USD, targeting the support level at 57,335 USD. If it breaks this support, further declines are possible. Conclusion Based on the Harmonic pattern and current support/resistance levels, BTCUSD is likely to decrease in the short term. Investors should consider a selling strategy when the price approaches the resistance at 59,058 USD and aim for profits at the support level of 57,335 USD.Trade active
Finn_Oakes
BTCUSDT: The short -term purchase strategy!

Hello passionate traders, do you think we should buy or sell BTCUSDT today? Let's dive in together! Currently, BTCUSDT is trading within an upward correction, moving inside a parallel channel targeting the 60,000 USD mark. My plan is to buy once it touches the lower boundary of the channel again. That's my short-term buying strategy for this article. What are your thoughts on BTCUSDT? Leave a comment so we can discuss it together! Wishing you happy and profitable trading!Trade activeComment:
Disclaimer
Any content and materials included in Sahmeto's website and official communication channels are a compilation of personal opinions and analyses and are not binding. They do not constitute any recommendation for buying, selling, entering or exiting the stock market and cryptocurrency market. Also, all news and analyses included in the website and channels are merely republished information from official and unofficial domestic and foreign sources, and it is obvious that users of the said content are responsible for following up and ensuring the authenticity and accuracy of the materials. Therefore, while disclaiming responsibility, it is declared that the responsibility for any decision-making, action, and potential profit and loss in the capital market and cryptocurrency market lies with the trader.