
FermiParadox
@t_FermiParadox

What symbols does the trader recommend buying?
Purchase History
پیام های تریدر
Filter
FermiParadox
S&P 500 penny stocks down to 2 Bitcoin-Cent
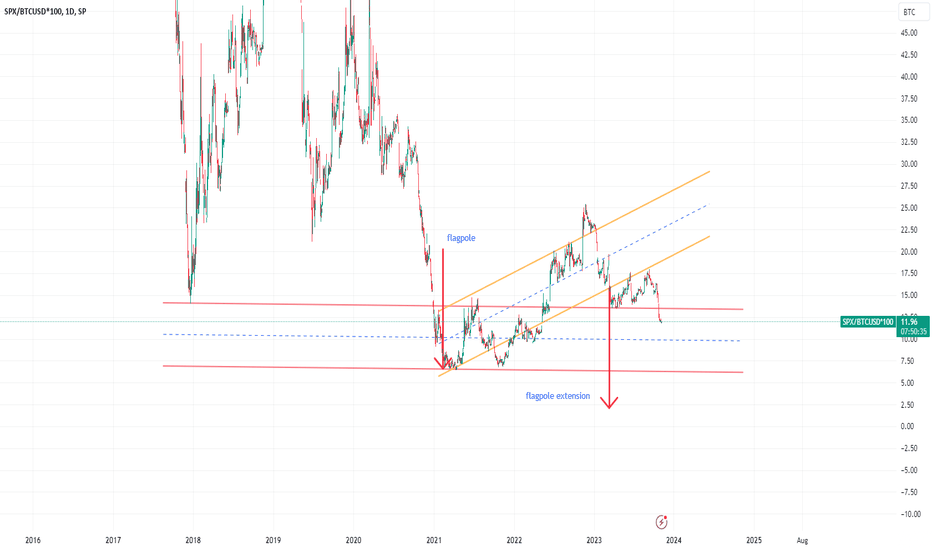
resuming my last post, I tried to figure out a reasonable flagpole extension to determine a short trading target for S&P 500 against BTC. If we exclude a drop to zero (which IMHO could only happen in a full blown world war III scenario and not even then), the flagpole in the chart indicates a drop to around 2 BTC cent. Inversely, if S&P 500 drops to 2 BTC cent in the months ahead, while S&P can retain much of it's current value in USD or can even grow, when measured in USD, we know much about the future fate of USD.
FermiParadox
S&P 500 penny stocks - bear flag & broken market structure
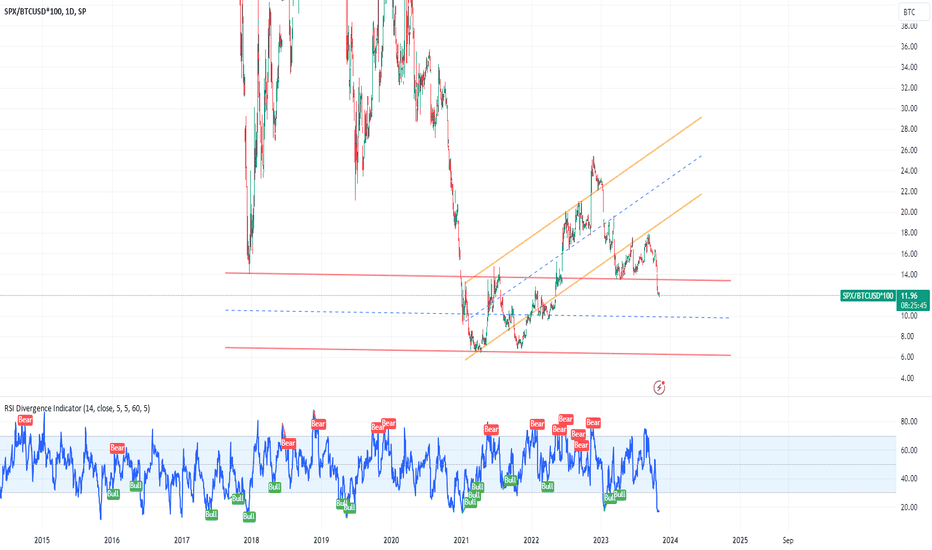
If - like me - you hold substantial parts of your cash reserves in BTC rather than USD or other FIAT currencies, there was little reason (at least as an investor) to swap your cash with US stocks in recent months. The chart here depicts the S&P 500 index, measured in BTC-Cent (0,01 BTC) units. Since Feb. 2021, the index is running in a bear flag pattern with an upward fakout only once amid the krypto banking crisis (FTX crash) of Nov. 22. Soon after, S&P 500 stock performance resumed a steady path of decline, dropped beyond the lower boundary of the bear flag with to failed attempts to reenter the bear flag and a sharp follow-up drop recently. So a lot of reasons exist to be bearish. Sure, S&P cannot decline the whole length of the bear flag's flagpole. Otherwise we would end up below zero. What does that mean? Don't know.
FermiParadox
BTC testing 36K stronghold resistance - setback to 30K expected

If BTC price action will leave the stronghold resistance of 36K USD behind in the days to come, the days for cheaper buy-ins will be over. However, I do not expect that to happen. I rather expect the 36K stronghold resistance will strike this time and BTC price action will be reflected back down to the 31K level. There will be a reasonable level to take further long positions, as the 31K level ist still within the channel of long-term growth.see the considerable bearish divergence in the hourly timeframe. I suppose we are in a situation pretty similar to June/July 2019 rather than at the beginning of a new bullish frenzy as in Nov. 2020. To support this opinion, compare the 50 & 200 SMA in the daily timeframe.
FermiParadox
BTC : still awaiting correction of excess sell off

I expect a significant upside turn of BTC price action in the next 1-4 weeks. Why? 1. The excess sell off in May, which took price action all the way down to the 2017/18 cycle bottom support line, has still not been corrected. That excess sell off was an equal response in terms of volatility to the overshooting which took BTC to the "unreal" Nov 21 ATH. 2. Following the mid June capitulation of miners, we observe considerable bullish divergence in RSI. Is that scenario supported by fundamentals? Think so: fossile energy asset prices tank, inflation will follow (or has already started following). FED will have to cut rates soon unless they want to see USD real rates blow off the roof. That will correct the excessively overbought USD against the world's currency basket, including BTC.since 3 days BTC is testing the upper boundary of the prevailing bear channel (see chart) - breaking that long standing resistance will provide the necessary momentum for the next leg up to 26 / 27 TUSD ... I expect that to happen until Nov. 15thFTX picked the right moment for its crash when the above chart requested a decisive move of price action (bearish channel upper resistance crossing the long term trend support line). For now, the bearish channel prevails & keeps price action within the boundaries of a rising wedge with continued bullish divergence. So there may not be too many forced liquidatations of further large BTC portfolios ahead of us.another High Noon event is now. If BTC does not break the brearish upper resistance this time, further decline to something around 11.800 is possible. A rise to 19.300 is needed to justify bullish expectations.after all, BTC has now regained a strong footing within the long-term channel of growth. We are just touching the upside barrier of that growth channel right at the time when the centerline of the long-term bearish channel comes across. Does that happen just by accident? I don't think so. That bearish channel crossover at 27,5 KUSD is a decisive resistance. If price action will break that resistance, there is quite a lot of headroom up to 36-37 KUSD.BTC still running in the longterm growth channel quite steadily and is again testing the upper resistance zone of that channel. While in past months the centerline of the 2021/22 bear market channel (dotted line in the chart) served as a blocking resistance, we can see BTC has broken that resistance around Sep. 09, which seems to me a clearly bullish setting.with the dotted centerline of the extended long term growth channel around 40K USD as the new price targetThis idea is now closed, as price action has meanwhile neutralized the excess sell-off (long squeeze) of June 21. BTC has now regained neutral territory. Here is where the stronghold resistance around 36K USD is to be found. We should prepare for a consolidation movement back to support levels around 31K. Short sellers may take profits there.
FermiParadox
At the crossroads

Whereever BTC will find its bottom now, at 20K or even somewhat lower at 18K, we can expect a significant rebound of price action over the course of 12 -16 weeks. Size and dynamics of that rebound may set the stage for further development, mid term (eoY) and beyond. I think it is relevant to understand if the actual BTC halving cycle established a new trend channel of continued growth or if BTC will resume its former growth trend established around 2015/16 during the last halving cycle. The latter would be unique in BTC history. So far all BTC halving cycles managed to generate increasing linear trends of growth. So we observe continued exponential growth until now. Within the days to come, a significant and lasting break of the lower boundary of a hypothetic new trend channel established in late 2020 would clarify the cause. If that rebound will be confined to lower levels than anything above 28K, further contraction to price ranges of 11K - 13k is to be expected in mid term (epY and beyond).btw - channels visible in the chart have been created using a simple linear regression model
FermiParadox
BTC - Cup & Handle Forming ...

As BTC did not yet retrace to the 54K level (a scenario expected by many, including me), traders currently seem to shy away from taking bold long positions. On the other hand, the "end-of-cycle mantra" & increasing FIAT money inflation will prevent sell offs. I expect the mantra & inflation to be the stronger force. So a break of the resistance around 62K, followed by a first move to 72K, seems very likely to me.
Disclaimer
Any content and materials included in Sahmeto's website and official communication channels are a compilation of personal opinions and analyses and are not binding. They do not constitute any recommendation for buying, selling, entering or exiting the stock market and cryptocurrency market. Also, all news and analyses included in the website and channels are merely republished information from official and unofficial domestic and foreign sources, and it is obvious that users of the said content are responsible for following up and ensuring the authenticity and accuracy of the materials. Therefore, while disclaiming responsibility, it is declared that the responsibility for any decision-making, action, and potential profit and loss in the capital market and cryptocurrency market lies with the trader.