
FX_Mark0
@t_FX_Mark0

What symbols does the trader recommend buying?
Purchase History
پیام های تریدر
Filter
FX_Mark0
GOLD (XAU/USD) 1H Analysis – Bullish Setup in Play
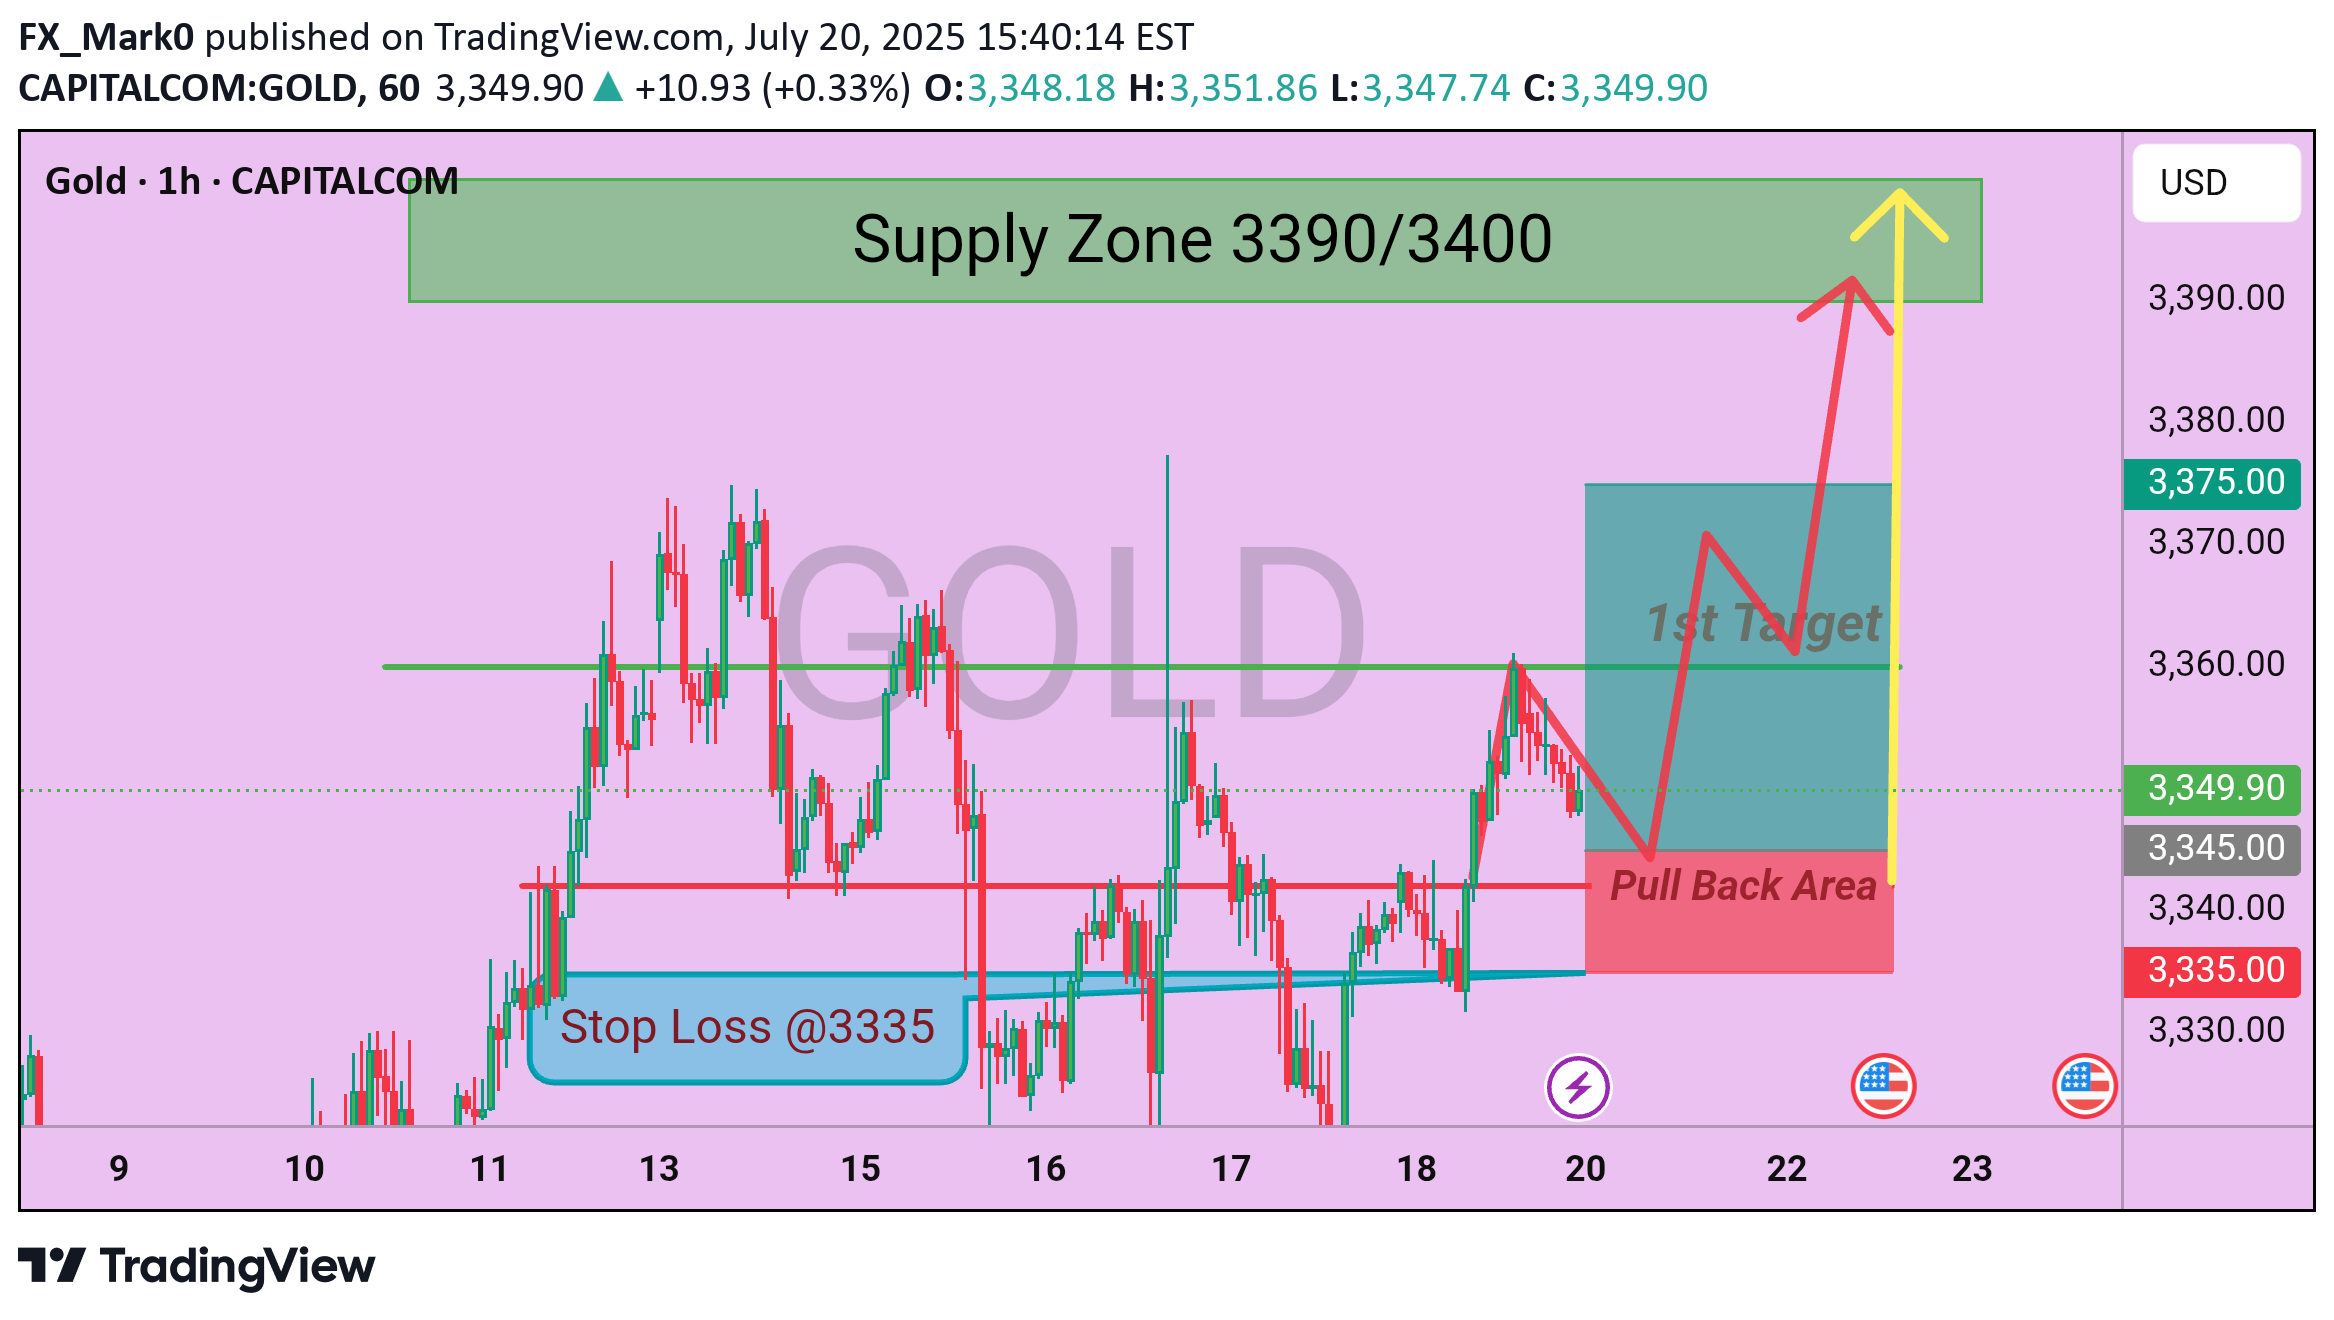
Gold is currently trading around the 3349.90 level after breaking out of a key consolidation range. Price action has shown bullish momentum supported by a breakout above a short-term descending trendline, suggesting potential continuation toward higher levels. 🔍 Key Technical Outlook: Pullback Area (3345–3335): This zone has been identified as a potential retest area. Price may revisit this zone before continuing its upward trajectory. A clean bounce from here would confirm bullish control. Stop Loss: Positioned below recent structural lows at 3335, giving room for the pullback while protecting against trend invalidation. First Target Zone: The next major resistance and potential reaction level sits around 3360–3375, where profit-taking may occur. This aligns with historical resistance. Final Target: If momentum sustains above 3375, the broader bullish move could extend toward the 3400 psychological level. 🧭 Bias: Bullish, as long as the price holds above the pullback zone and does not close below the 3335 level on the 1H timeframe. ⚠️ Risk Note: Always wait for confirmation on lower timeframes or candlestick validation before entering trades. Maintain proper risk management.Our previous analysis is playing out well, with the trade currently running in over 200 pips profit on the Buy side. Managing the position accordingly and trailing the stop to secure gainsFinal target reached successfully. All positions will be closed at this level as per our trade plan.
FX_Mark0
Bitcoin (BTC/USD) 1H Technical Analysis – Breakout in Progress
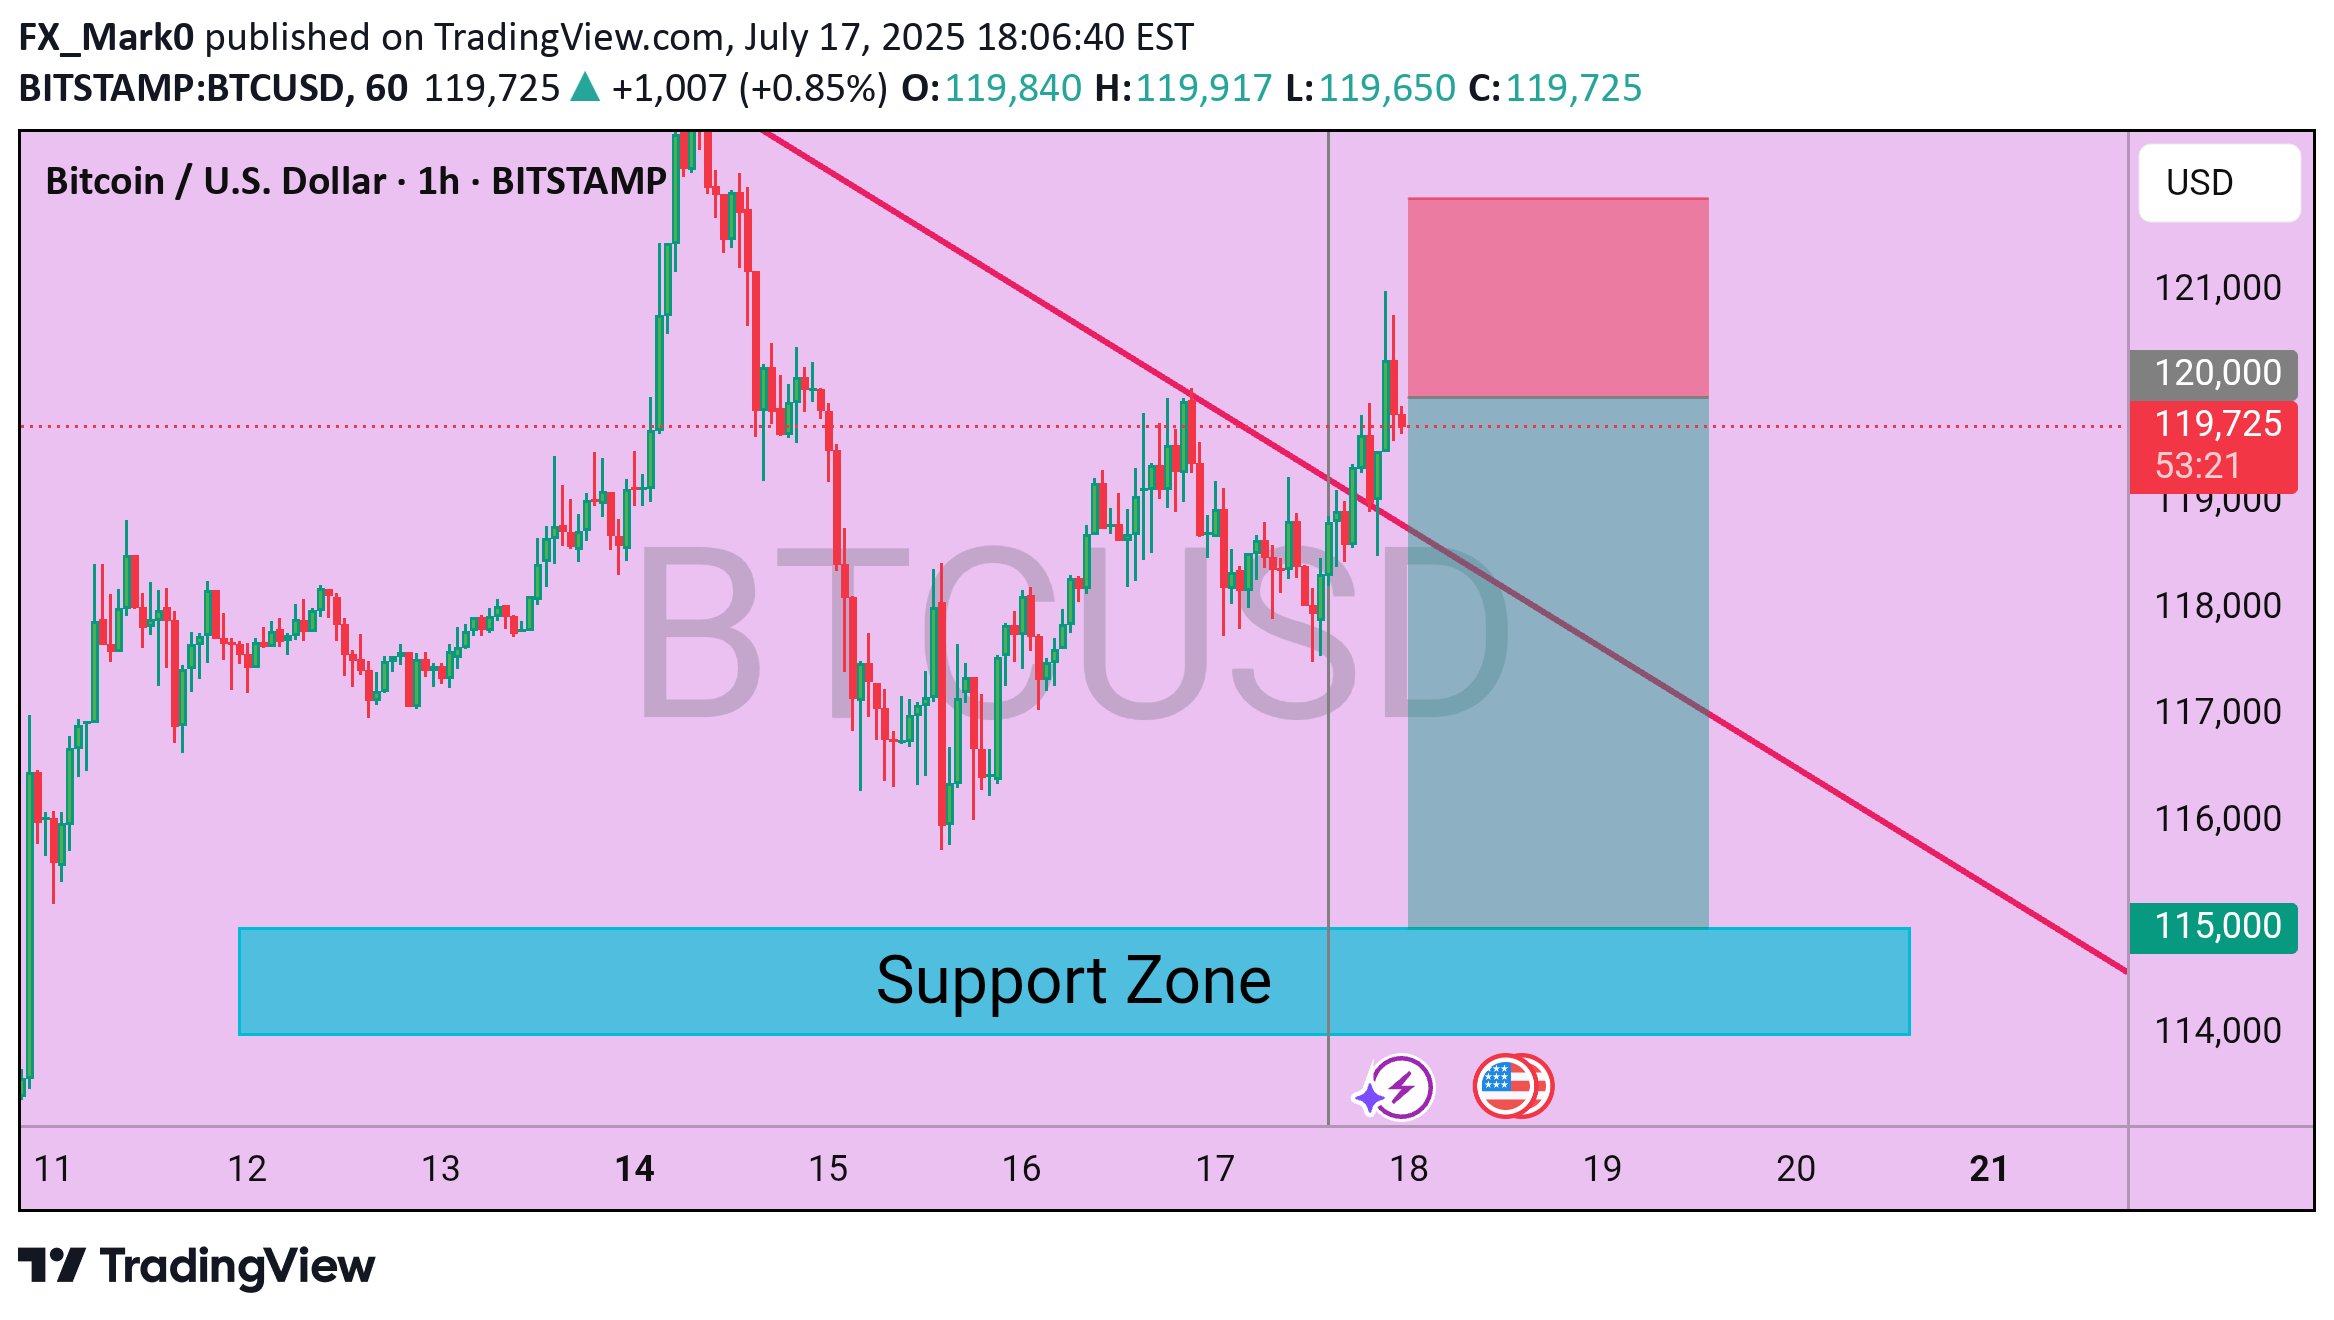
Bitcoin is showing bullish intent after breaking above a descending trendline resistance on the 1-hour chart. The breakout occurred with decent bullish momentum, suggesting buyers are regaining control in the short term. 📈 Chart Observations: Descending Trendline Broken: Price has successfully broken above a well-respected descending trendline, which acted as resistance over the past few sessions. This breakout may signal a shift in short-term market structure. Support Zone: The marked support zone around $115,000 continues to act as a critical demand area. Price has rebounded multiple times from this zone, reinforcing its significance. Current Price Action: BTC is currently trading near $119,800, just under the round-level resistance of $120,000. A clean hourly close above this level could open room for further bullish continuation. 📊 Key Levels: Resistance: $120,000 (Psychological level) Immediate Support: $118,000 Major Support Zone: $115,000–$114,000 📉 Bearish Scenario: If BTC fails to hold above the broken trendline and slips back below $118,000, a revisit of the support zone near $115,000 becomes likely. Bears may step in again if the price fails to sustain higher highs. ✅ Conclusion: BTC is showing potential for a short-term bullish reversal after breaking out of its descending pattern. Traders should monitor for confirmation through price continuation above $120,000. However, a cautious approach is advised near resistance levels, and invalidation below $118,000 could favor sellers once again.
FX_Mark0
Gold Technical Outlook H1
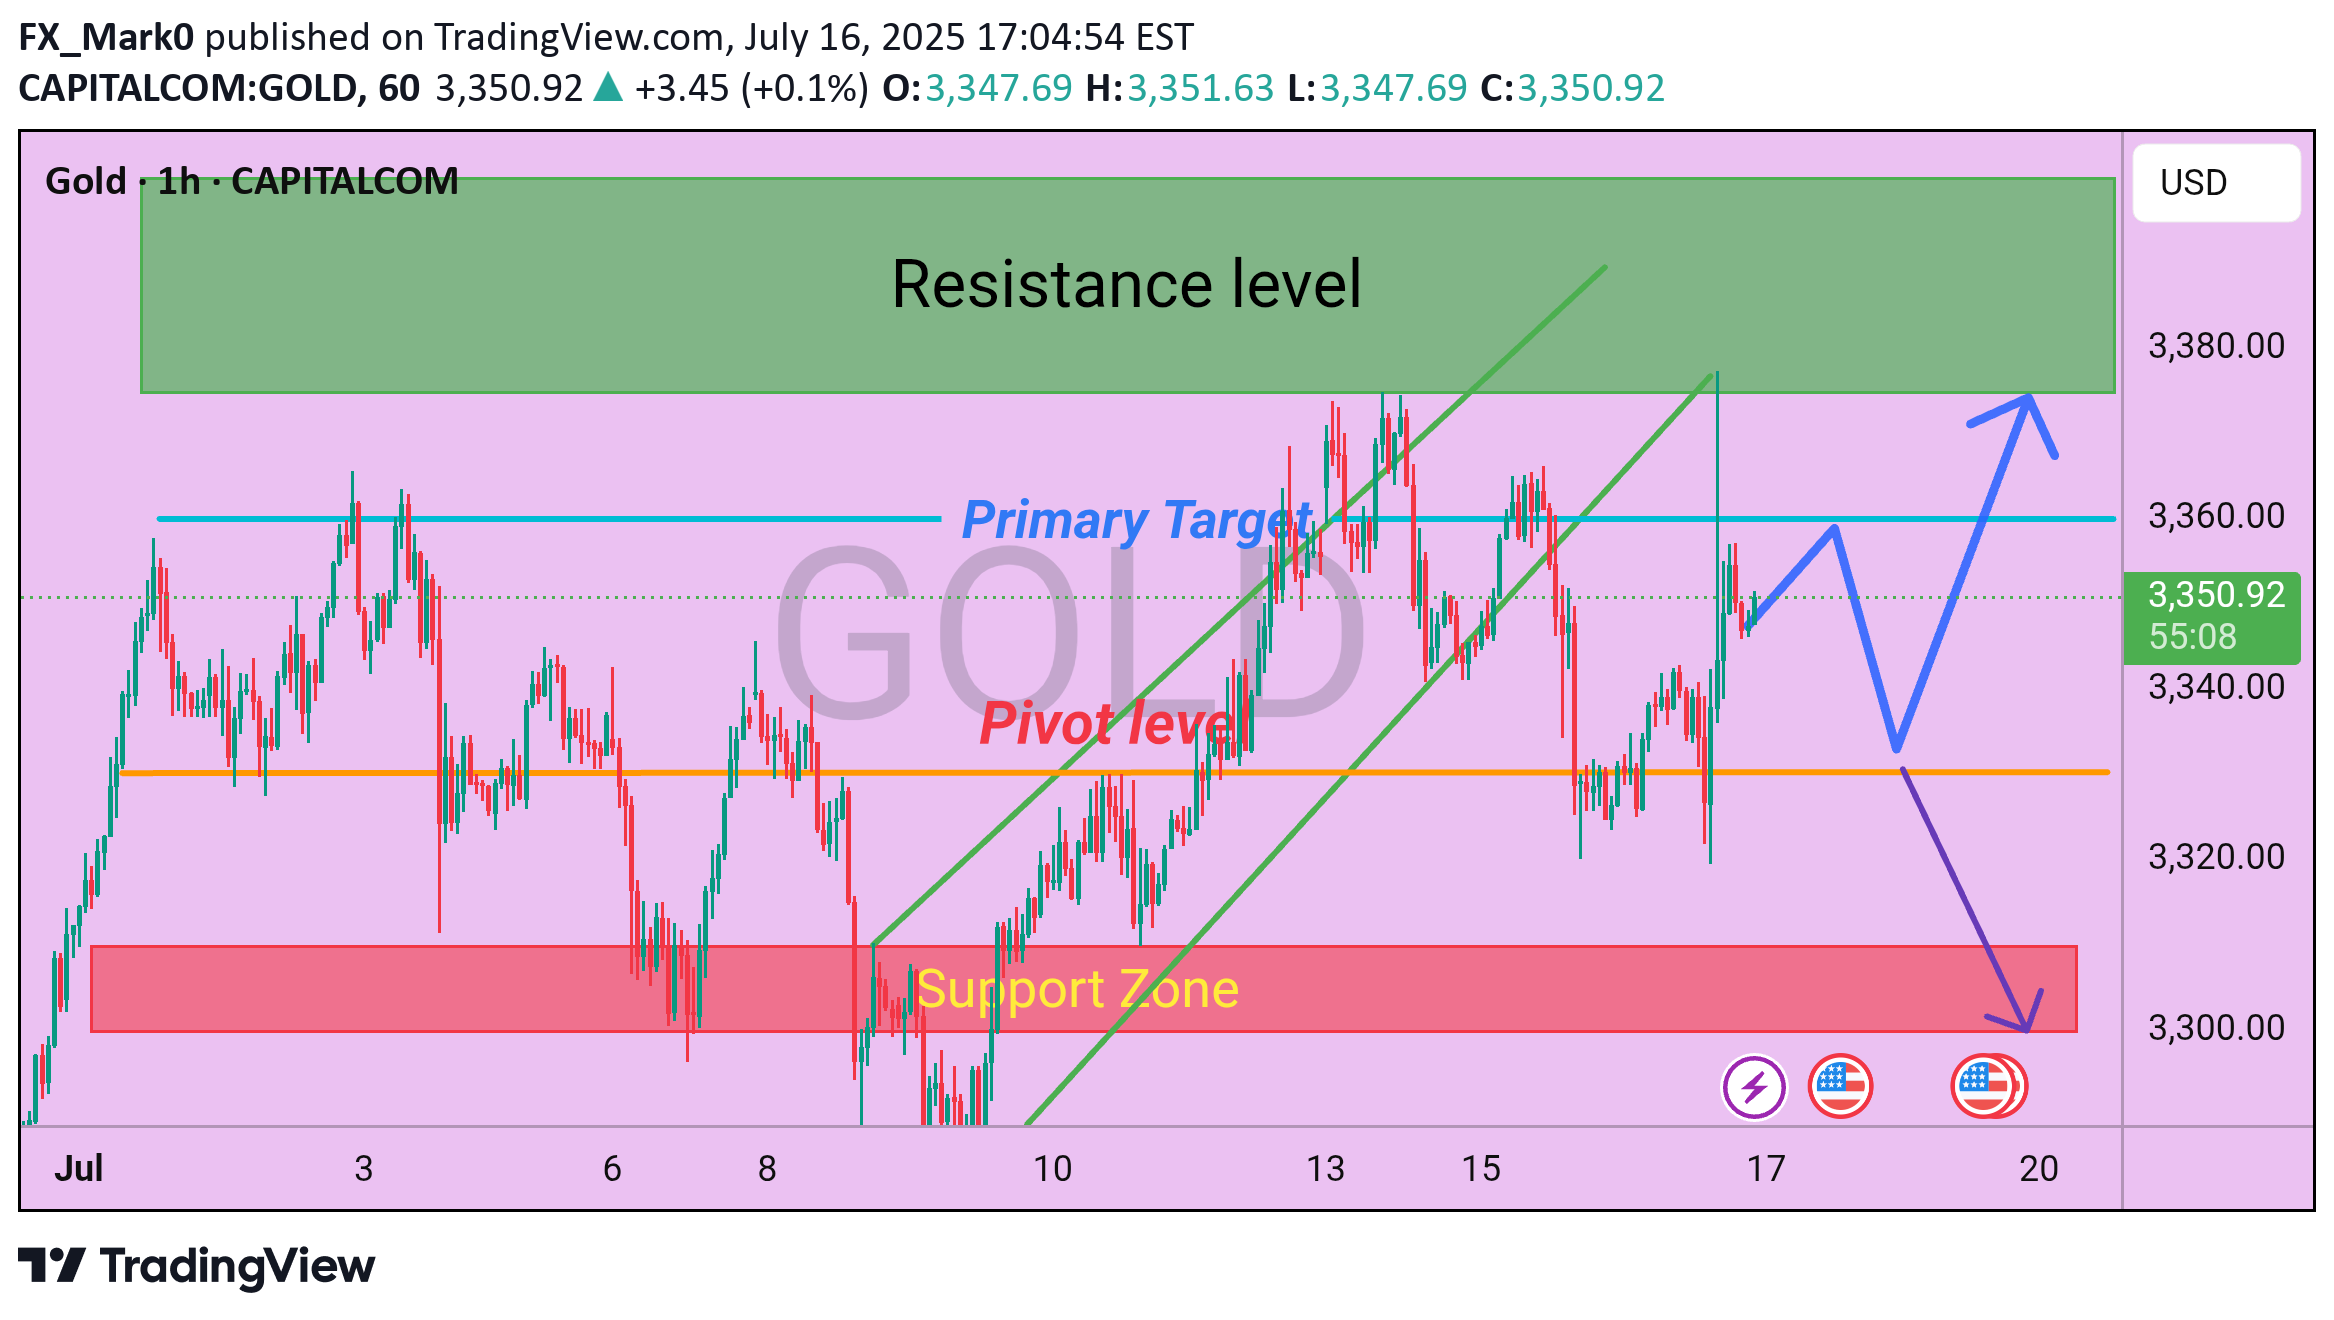
Gold is currently consolidating within the 3345–3350 zone, showing signs of potential bullish movement in the short term. A sustained break and H4 candle close above 3355 could trigger bullish momentum towards 3360, followed by extended targets at 3375 and 3400, aligning with key resistance levels. On the flip side, if the price faces rejection and an H4 candle closes below 3330, this could open the door for a bearish move, with potential targets at 3315 and 3300, which also act as critical support and pivot levels. 📌 Key Levels to Watch: Immediate Resistance: 3355 / 3360 Major Resistance: 3375 / 3400 Immediate Support: 3330 / 3315 Major Support: 3300 🔎 Wait for confirmation on the H4 timeframe before entering positions. Always manage your risk accordingly.Our analysis has successfully reached the target zone as anticipated. Patience and technical discipline paid off.
FX_Mark0
XAU/USD (Gold) Bearish Outlook – H1/H4 Chart Analysis
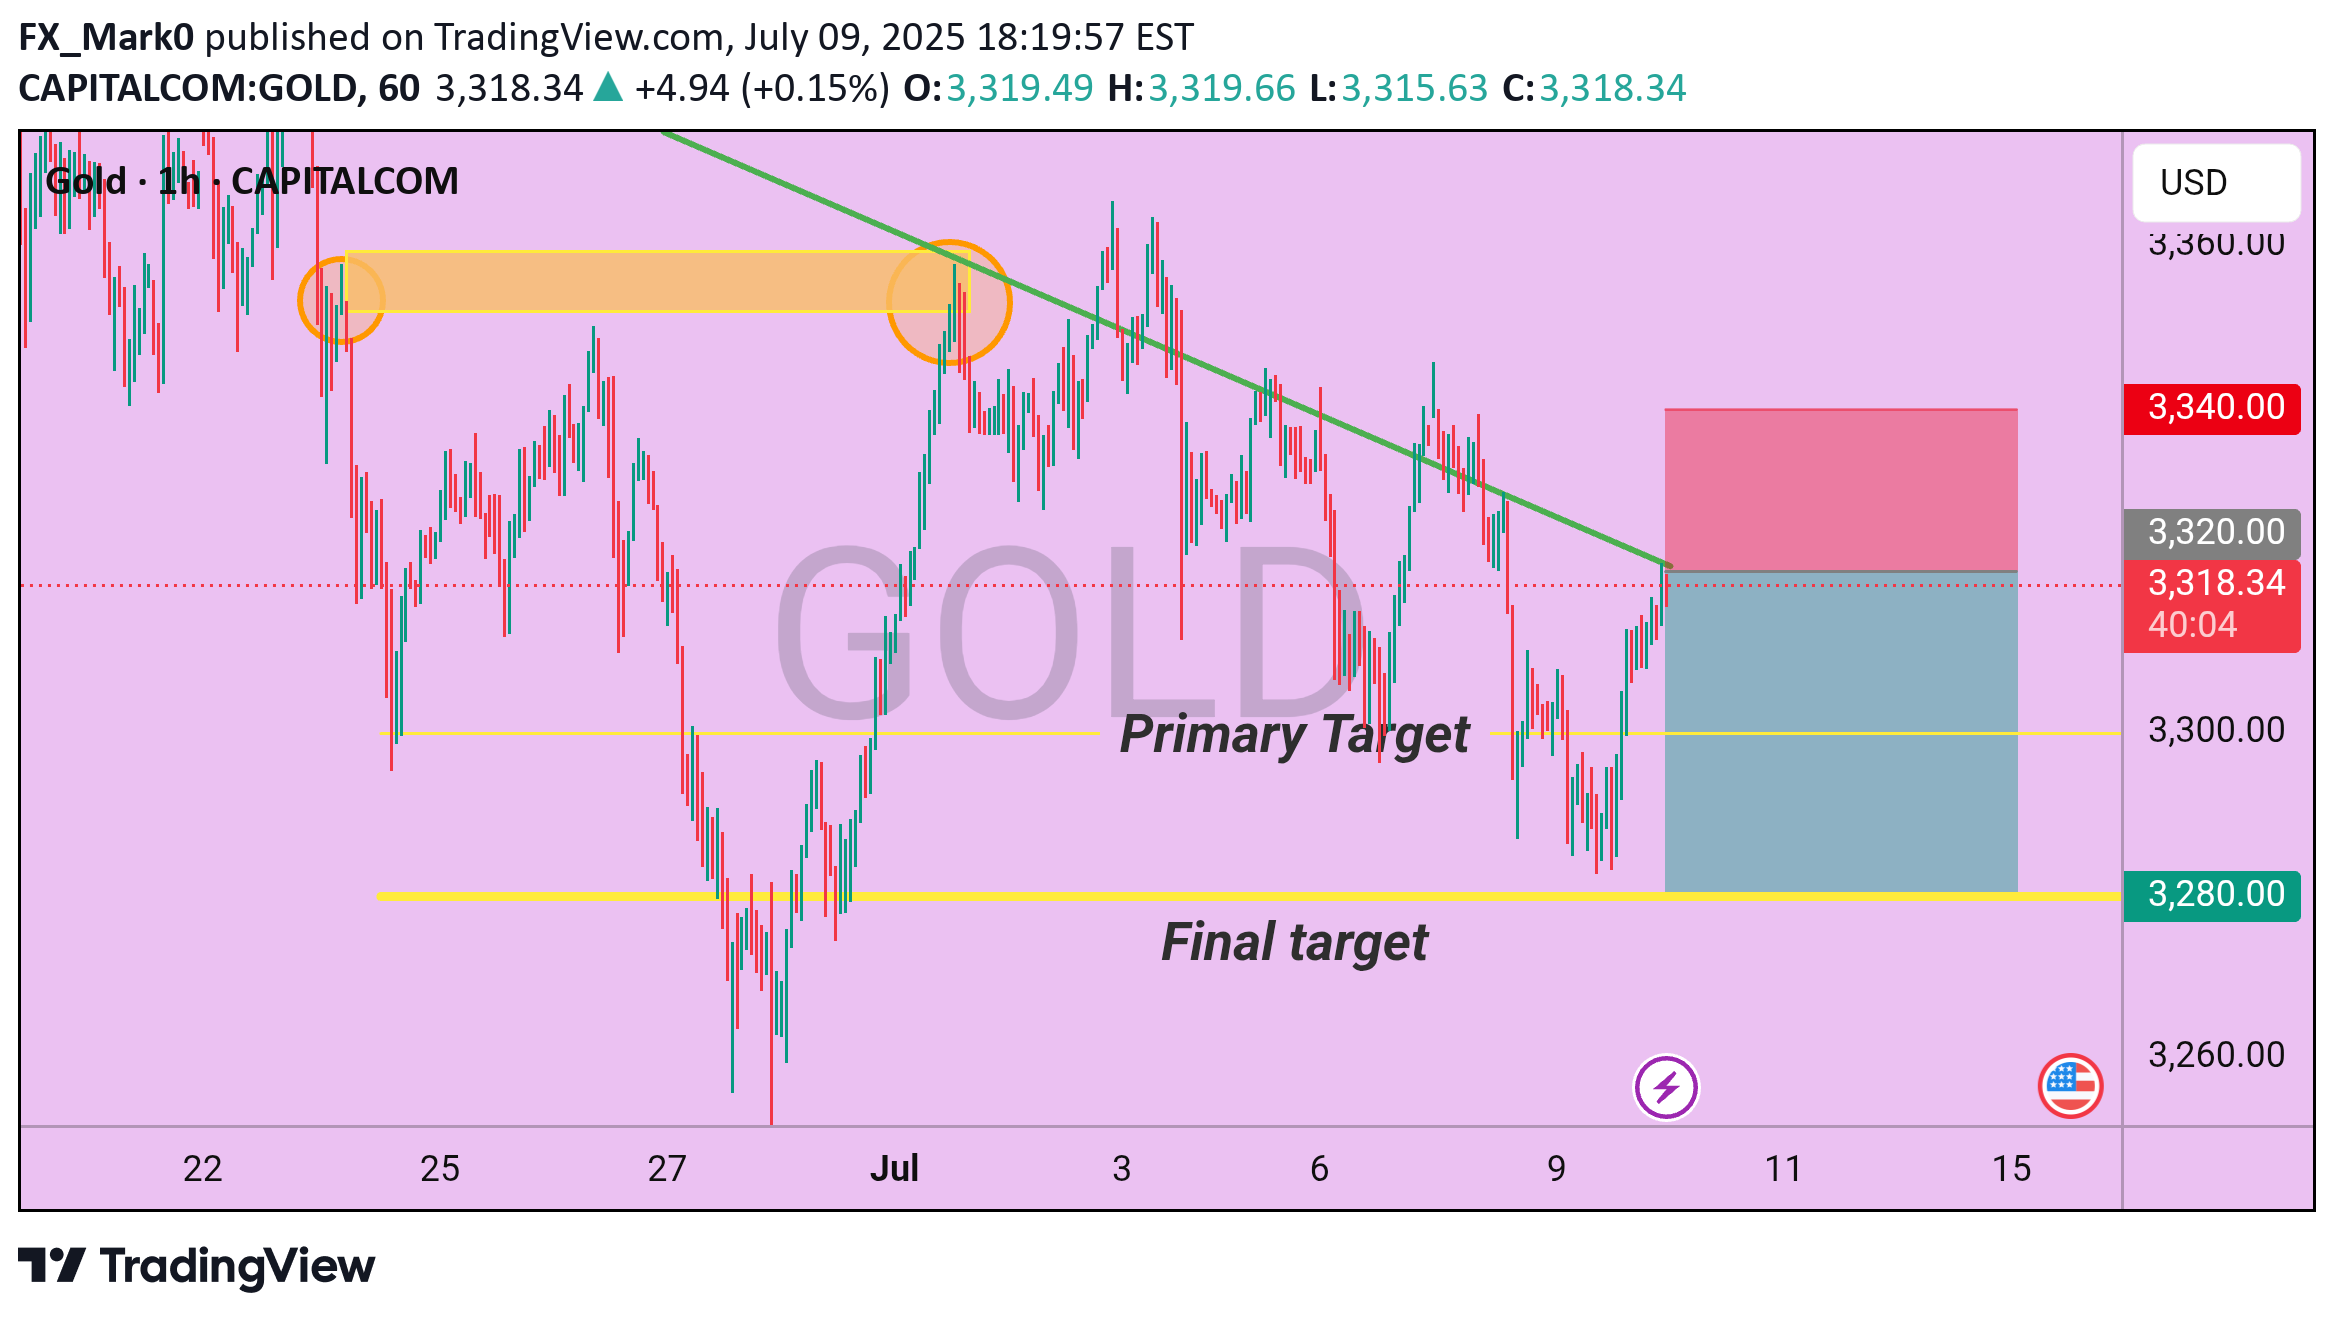
Gold is currently showing signs of weakness within a confirmed downtrend, forming lower highs and lower lows on the short-term charts. The price structure suggests continued bearish momentum as sellers maintain control beneath key resistance levels.At present, a potential bearish opportunity is observed if price retraces near the 3320 zone, which aligns with a recent supply area and resistance in the ongoing downtrend. From this level, price action could continue its downward move in line with trend dynamics.Entry Zone: Around 3320Primary Target: 3300 (near-term support level)Final Target: 3280 (extended target aligning with previous demand zone)Invalidation/Stop Loss: Above 3340 (a break above this may invalidate the bearish bias)🔸Disclaimer; This setup is based on technical structure and market flow, not financial advice. Always confirm with your own analysis and risk management plan.Gold swing high and low and touched 3310
FX_Mark0
BTC/USDT H1 Chart Out look

Bitcoin is Now running at near the 107500 and following a short term Bearish pattern on EMA 50 and 200 by using that we can consider on sell side with the given Targets like 107000 which is near the Bitcoin is consolidating and the Final target support is 106000/105000.Bearish Scenario 1st Target is 107000 ( from here it may make some retest) 2nd Target is 106000( main target). 3rd Target is 105000.Use stop loss at 108100.
FX_Mark0
XAU/USD (GOLD) H1 Chart Outlook – Supply & Demand Perspective

Gold is currently consolidating in a tight range near the 3355–3358 zone, showing indecision ahead of a potential breakout. Based on supply and demand dynamics, here’s what to watch:---🔼 Bullish ScenarioIf the H4 candle closes above 3365, this would confirm a bullish breakout above the immediate supply zone. In that case, expect upside momentum to target key resistance levels:🎯 3385 – Minor resistance🎯 3400 – Major resistance and potential reversal zoneA confirmed breakout with strong volume could open room for a short-term bullish rally.---🔽 Bearish ScenarioOn the flip side, if the H4 candle closes below 3340, it would signal weakness and a possible rejection from the current range. This breakdown could shift the momentum to the downside, targeting the following support levels:🛑 3320 – Near-term support🛑 3300 – Critical demand zoneFailure to hold 3300 could indicate further bearish pressure in the coming sessions.XAU/USD market made moves some highs and lows During NFP News Report it touched Support level at 3320 and also moved to 3310 securing some good pips
FX_Mark0
XAU/USD H1 CHART OUTLOOK

Gold is Now moving in the range of 3375/3380 and it is making strong bullish scenario which indicates us to put BUY trades. 1st Target ::: 34002nd Target ::: 3410 Final target : 3420 Stop loss just below 3365
FX_Mark0
Gold (XAU/USD) Technical Analysis – Short-Term Outlook

Current Price Range: 3340 – 3350 USDTrend Bias: Strong BullishTime Frame Focus: Intraday to Short-Term (H1/H4)---Price Structure & TrendGold is currently consolidating within a narrow range of 3340 to 3350, forming a bullish continuation pattern (likely a flag or a pennant). The current consolidation is occurring after a strong bullish impulse, which signals a potential for trend continuation to the upside.This behavior is consistent with accumulation before breakout, often seen in trending markets. The presence of higher highs and higher lows on the H1 and H4 charts supports the bullish bias.---Key LevelsZoneLevelSignificanceSupport3335Pullback zone / Potential entry areaMinor Support3320Stop loss zone / Break of structure riskResistance 13365Initial profit target / minor resistanceResistance 23375Midway resistance / partial exit levelMajor Resistance3380–3400Final target zone / Strong supply area---Entry & SetupEntry Zone: 3335–3355 (ideal is a retest of 3335 with confirmation candle)Entry Type: Long (Buy) on support retest + bullish candle confirmation (pin bar, engulfing, etc.)Stop Loss: Below 3320 (tight risk, below structure support)Take Profits:TP1: 3365TP2: 3375TP3: 3400 (final target)Risk:Reward Ratio (Approximate):From entry at 3335: R:R = 1:2.5 to 1:3.5 depending on targetFrom entry at 3350: R:R = 1:1.5 to 1:2.5---Technical Indicators RSI: Likely in the 55–65 zone on H1/H4, indicating strength but not yet overbought.MACD: Histogram positive, signal line above zero, supporting bullish momentum.Volume: Look for rising volume on bullish candles and low volume on pullbacks.---Chart Patterns & ObservationsBullish Flag / Pennant: Suggests a continuation of the prior bullish move.No bearish divergence observed (if indicators used).Trendline support: Can draw ascending trendline connecting recent swing lows.---Conclusion & StrategyGold remains in a bullish phase with clear consolidation before potential breakout. Best opportunity is a buy on dip, ideally on a clean retest of 3335–3340 support zone with proper confirmation.If gold breaks above 3355–3360 with momentum, aggressive traders may consider a breakout entry with reduced risk and tighter stops below 3340.Avoid entries below 3320 as this would invalidate the bullish structure and may indicate a shift in trend.
FX_Mark0
BTCUSD Analysis – Potential Reversal Zone and Bearish Setup

BTCUSD is currently trading near the 108,000 level and showing signs of a short-term downtrend. Price action suggests a possible minor upward retracement toward the 110,000 resistance area. This level aligns with previous price reactions and may act as a potential supply zone.If BTCUSD approaches the 110,000 region and fails to break above it convincingly, it could present a bearish opportunity, with potential downside targets at:107,000 (minor support)106,000 (structural level)104,500 (major support and potential trend continuation target)A clear break above 110,500 would invalidate this scenario, suggesting a shift in market momentum.Note: This analysis is for educational purposes only and does not constitute financial advice. Always manage risk according to your trading plan.
FX_Mark0
Gold (XAU) Technical Analysis – Bullish Setup

Gold is currently trading around 3290, exhibiting strong bullish price action, suggesting a favorable environment for buyers. The current momentum indicates a potential move towards the final resistance at 3340, making this a strong buy opportunity in the short term.Trade Setup:Buy Entry Zones:Current price zone: 3290Potential dip-buy zone: 3275 (possible fakeout/retest area)Targets:3300 – Minor psychological resistance3310 – Near-term resistance3320 – Intermediate target3340 – Final resistance & major targetStop-Loss:Conservative: 3265Aggressive: 3260 (below support/fakeout zone)Analysis Summary:The chart suggests continued bullish momentum. A minor retracement to 3275 may occur, which would provide a second entry opportunity for buyers. As long as price holds above 3260, the bullish structure remains intact, targeting incremental levels up to 3340.Risk Management Tip: Adjust position sizing according to risk tolerance and maintain discipline around stop-loss levels.Let me know if you'd like this in a visual chart format or if you'd like to include moving averages, RSI, or other indicators for deeper analysis.
Disclaimer
Any content and materials included in Sahmeto's website and official communication channels are a compilation of personal opinions and analyses and are not binding. They do not constitute any recommendation for buying, selling, entering or exiting the stock market and cryptocurrency market. Also, all news and analyses included in the website and channels are merely republished information from official and unofficial domestic and foreign sources, and it is obvious that users of the said content are responsible for following up and ensuring the authenticity and accuracy of the materials. Therefore, while disclaiming responsibility, it is declared that the responsibility for any decision-making, action, and potential profit and loss in the capital market and cryptocurrency market lies with the trader.