
FX_AGENCY
@t_FX_AGENCY

What symbols does the trader recommend buying?
Purchase History
پیام های تریدر
Filter
Signal Type

XAUUSD (Gold) Technical Analysis Timeframe: 45m Trend: Bearish with corrective pullback 🔹 Price has been moving inside a descending channel and is currently showing a minor pullback. 🔹 Ichimoku still confirms bearish pressure, but a short-term rejection at resistance is visible. 🔹 Current Price: $3,477 --- 📌 Trade Setup (Sell Idea) Entry Zone: 3475 – 3480 Stop Loss (SL): 3502 Take Profit (TP): 3435 (channel support) --- 📊 Risk/Reward Summary Risk: ~25 points Reward: ~40 points R:R Ratio: 1 : 1.6 --- ✅ Summary Gold remains bearish as long as it trades below 3502. The pullback looks weak and a continuation to the downside is expected. Safe sellers can look for short entries around 3475 – 3480 targeting 3435.

📈 Gold (XAU/USD) – Strong Bullish Momentum Toward 3500 🚀 Gold is trading at $3,446, continuing its bullish structure after respecting the ascending trendline support around $3,340. Buyers have stepped in strongly, pushing price higher, and momentum suggests a possible extension toward the next resistance zone. 🔑 Key Levels Support (Trendline Zone): $3,340 – $3,360 Current Price: $3,446 Immediate Resistance: $3,480 – $3,500 Target Zone: $3,500 – $3,520 🎯 Bullish Trade Idea Entry (Safe Zone): $3,430 – $3,440 (on minor pullback) Stop-loss: Below $3,400 Target 1: $3,480 Target 2: $3,500 – $3,520 ⚡ Technical Confluence Price respecting ascending trendline since mid-August Strong breakout above $3,420 resistance Momentum + Ichimoku support indicate bullish continuation 👉 Bias: Bullish above $3,430 | Only bearish if price closes below $3,400
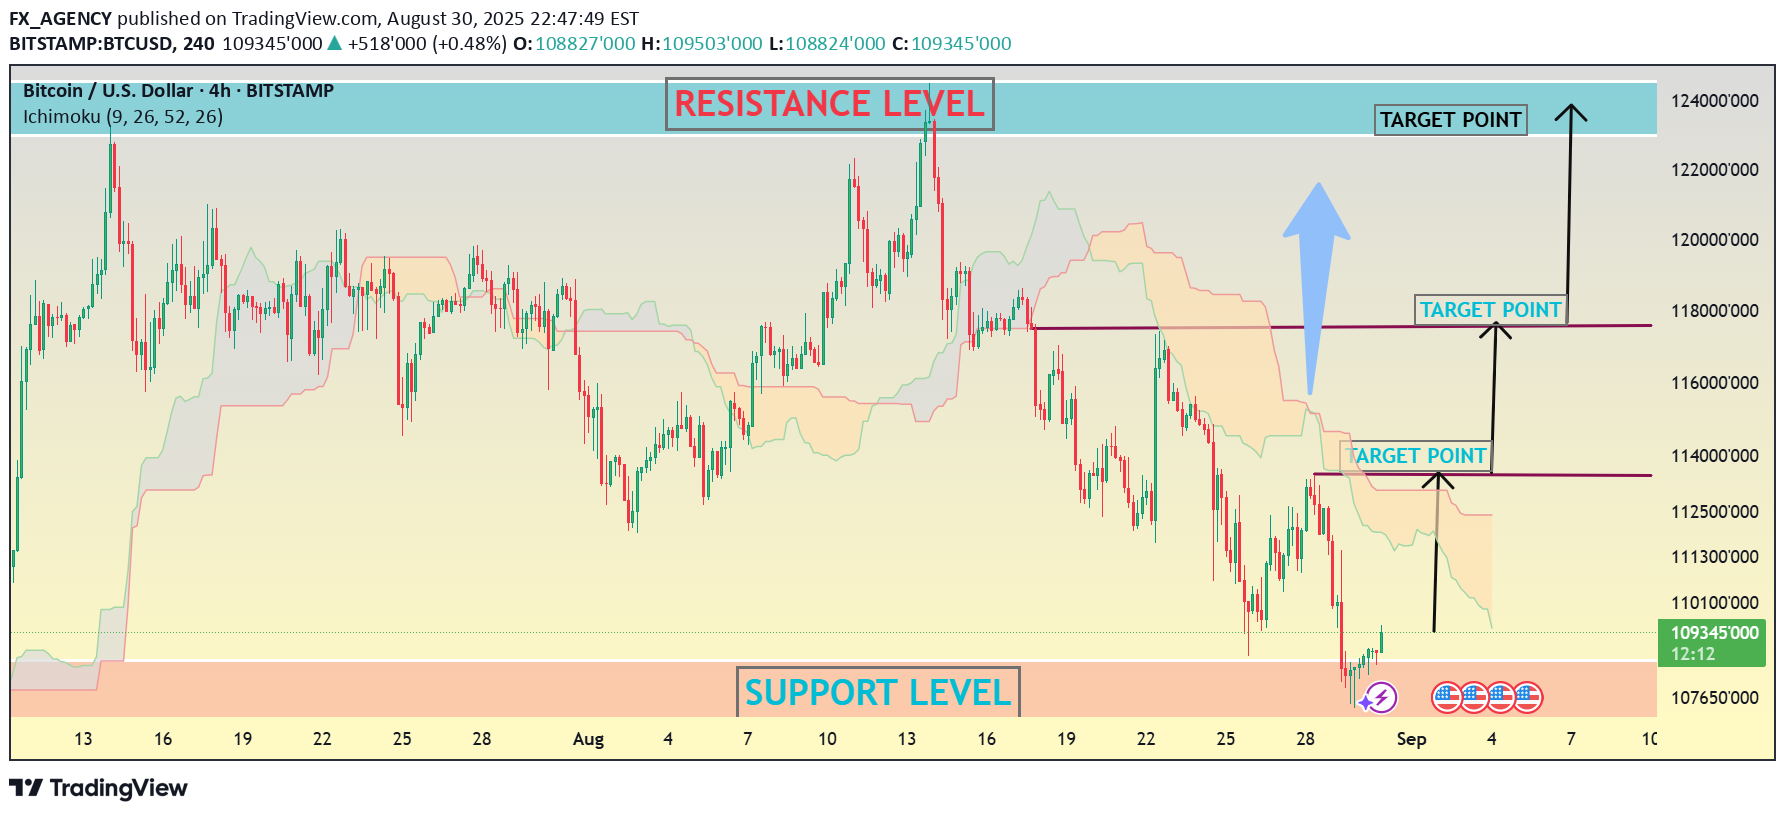
Bitcoin is currently holding above a key support zone at $105,800 – $106,200, where buyers are stepping in strongly. Price is consolidating at this level and showing early signs of accumulation. 🔑 Key Levels Support (Entry Zone): $105,800 – $106,200 Resistance Zone: $118,800 – $120,000 Target 1: $113,000 Target 2: $116,000 Target 3: $120,000 – $122,000 🎯 Trade Setup (Bullish Plan) Entry: Near $106,000 support retest Stop-loss: Below $105,000 Target Points: 113K → 116K → 120K+ 📊 Risk–Reward Ratio (RRR) TP1: ~1:3 TP2: ~1:5 TP3: ~1:7+ ⚡ Technical Basis Strong bounce from support level Volume profile shows demand concentration below $106K Breakout from consolidation can fuel move toward higher targets 👉 Bias: Bullish above $106,000 | Bearish only if price breaks below $105,000 📌 This chart is for educational purposes only – not financial advice.trade active and wait for All time high break

ETH/USD – Bullish Setup With Clear Targets Ethereum is trading near a key support level (4,300 – 4,320) where buyers are defending strongly. Volume profile indicates strong accumulation at the base, suggesting that bulls are preparing for the next upward move. 🔑 Key Levels Support (Entry Zone): 4,300 – 4,320 Resistance Zone: 4,580 – 4,600 Target 1: 4,460 Target 2: 4,860 🎯 Trade Setup Entry: 4,310 – 4,320 Stop-loss: Below 4,260 Target 1 (TP1): 4,460 Target 2 (TP2): 4,860 📊 Risk–Reward Ratio (RRR) TP1: ~1:3 TP2: ~1:6 ⚡ Technical Basis Price holding above strong support zone. Bullish structure forming with higher lows. Volume profile shows demand concentration at 4,300 zone. 👉 Bias: Bullish above 4,300 | Bearish only if ETH breaks and closes below 4,260.trade active

Pair: XAUUSD (Gold vs US Dollar) Direction: Bullish Entry Level: 3412 Target Level (TP): 3440 Stop Loss (SL): Around 3402 (based on the risk box shown on your chart). --- 🔹 Technical Chart Matrix Analysis 1. Trend Context: Price has recently rejected lower levels and is trying to hold above a strong demand zone. The Ichimoku cloud (highlighted on your chart) is thinning ahead, which usually signals potential for bullish continuation if price breaks and sustains above. Market structure shows higher lows forming, signaling bullish momentum. 2. Entry Justification (3412): Positioned above minor resistance & within a demand zone, giving a good breakout entry. Buyers are defending around 3400 – 3405 levels, confirming accumulation. 3. Target (3440): A key resistance level highlighted on your chart. Acts as the first major bullish target, and also a psychological round number zone. --- 🔹 Risk–Reward Ratio Entry: 3412 Target (TP): 3440 → +28 pips profit potential Stop Loss (SL): 3402 → -10 pips risk 👉 This is a highly favorable setup, as professional traders usually aim for at least 1:2 RRR. Here you’re getting nearly 1:3. --- 🔹 Trade Plan Summary ✅ Buy (Long) XAUUSD at 3412 🎯 Target Profit (TP): 3440 ❌ Stop Loss (SL): 3402 📈 Risk–Reward Ratio: 1:2.8 (Strong setup) ⚡ Expectation: Price could face resistance at 3440, so partial booking at 3435–3438 can also be considered. --- 👉 In simple words: This is a bullish momentum trade with a tight stop loss and a strong risk-to-reward profile. Market structure and cloud analysis both support upside potential toward 3440.all Target Secured trade active from 3412 and our target 3440 .

BTC/USD (Bitcoin) Bullish Setup 🚀 Bitcoin is building strong momentum after holding support and showing bullish continuation. Current market structure favors further upside from the 112,800 entry zone. ✅ Entry Point: 112,800 (Buy Zone) 🔑 Key Resistance / Target 1: 115,000 – First bullish objective where partial profits can be secured. 🛡 Major Resistance / Target 2: 117,500 – Main upside level, completion of the bullish wave. 📊 Trend: Bullish bias remains valid as long as price sustains above entry and continues pushing higher. 📈 Bullish Bias: Above 112,800, buyers control the market. Breaking through 115,000 key resistance will unlock further strength, targeting the 117,500 major resistance zone. --- ✨ A clean bullish structure with step-by-step targets offers strong potential for secure profits.trade activestoploss hit closed all trades

XAUUSD (Gold) Bullish Setup 🌟 Gold has regained strength and is holding firm above the key support area, signaling fresh buying momentum. Price action confirms a bullish structure with strong demand from lower levels. ✅ Entry Point: 3407 (Buy Zone) 🛑 Stop Loss: 3399 (Tight risk control below recent structure) 🎯 Target Point: 3440 (Upside objective) 🔺 Main Resistance: 3440 → Critical level where buyers must break through for further continuation. 📈 Bullish Bias: As long as price sustains above 3399, the bullish momentum remains valid. A clean break and close above 3440 resistance will unlock the next wave of upward potential, attracting more buyers into the market. --- ✨ Smart risk-reward with a tight stop and defined resistance target makes this a high-probability bullish setup.trade active active

ETH/USD Bearish Channel Setup 📉 Ethereum is moving inside a downward-sloping channel, confirming continuous selling pressure. Each bounce toward the upper boundary is being rejected, showing strong control from sellers. 🔻 Entry Zone: Near channel resistance (upper line) 📉 Trend: Bearish until price breaks above channel convincingly 🎯 Target Point: Marked at the lower boundary zone – sellers aiming for continuation into the target box area ⚠️ Bearish Bias: As long as ETH trades below channel resistance, every retest offers fresh selling opportunities. Downside momentum favors continuation toward the Target Point, completing the bearish leg. --- ✨ Clear trend structure, disciplined entry, and well-defined targets give high-confidence signals for consistent profits.

XAUUSD (Gold) Bearish Setup 📉 Gold is showing weakness after failing to hold above the intraday highs, and sellers are stepping in strongly from 3384, making it a prime Sell Entry Zone. 🔑 Key Support: 3366 → This is the first level where price may attempt a small bounce, but if broken, it confirms bearish continuation. 🛡 Major Support: 3348 → This is the decisive level. If price reaches here, it will complete the bearish move and lock in profits for sellers. 🎯 Target 1: 3366 (Key Support) 🎯 Target 2: 3348 (Major Support) ⚠️ Bearish Bias: As long as price stays below 3384 resistance, sellers remain in control. Breaks below 3366 open the path directly toward 3348.trade active

BTCUSD (1H) Trade Setup Entry: 112,500 Main Support: 111,500 Target: 117,500 Stop-loss options: Conservative: 111,100 (tight stop) Wider: 110,800 (hard stop) 🔹 Risk–Reward Analysis Potential Reward: 5,000 points (≈ +4.4%) Risk (tight SL @ 111,100): 1,400 points (≈ 1.24%) → R:R ≈ 3.6:1 Risk (wide SL @ 110,800): 1,700 points (≈ 1.5%) → R:R ≈ 2.9:1 🔹 Technical View 1. Main Support Zone (111,500–111,800): Price tested & held. Any re-test gives a high-probability bounce. 2. Market Structure: Higher lows forming after strong rejection from support → bullish continuation bias. 3. Volume Profile: Accumulation near support, indicating smart money positioning. 4. Confirmation: A 1H close above 113,200 strengthens bullish case toward 115,800 / 117,500. 🔹 Trade Management First TP: 115,800 → lock partial profit. Second TP: 117,500 (full target). Break-even shift: Move SL to entry after 114,800 breaks cleanly. Invalidation: A 1H close below 111,500 kills the setup → exit trade. ✅ Summary (Pro Style Signal): BTCUSD long from 112,500, stop below 111,100–110,800, targeting 117,500. Setup offers 3.5R potential. Watch 111,500 re-test for fresh entries.trade active on main support and retist point
Disclaimer
Any content and materials included in Sahmeto's website and official communication channels are a compilation of personal opinions and analyses and are not binding. They do not constitute any recommendation for buying, selling, entering or exiting the stock market and cryptocurrency market. Also, all news and analyses included in the website and channels are merely republished information from official and unofficial domestic and foreign sources, and it is obvious that users of the said content are responsible for following up and ensuring the authenticity and accuracy of the materials. Therefore, while disclaiming responsibility, it is declared that the responsibility for any decision-making, action, and potential profit and loss in the capital market and cryptocurrency market lies with the trader.