
FXTraderPaul
@t_FXTraderPaul

What symbols does the trader recommend buying?
Purchase History
پیام های تریدر
Filter
FXTraderPaul
گزارش درآمد انویدیا (NVDA): آیا این هفته سهم به اوج میرسد یا سقوط میکند؟
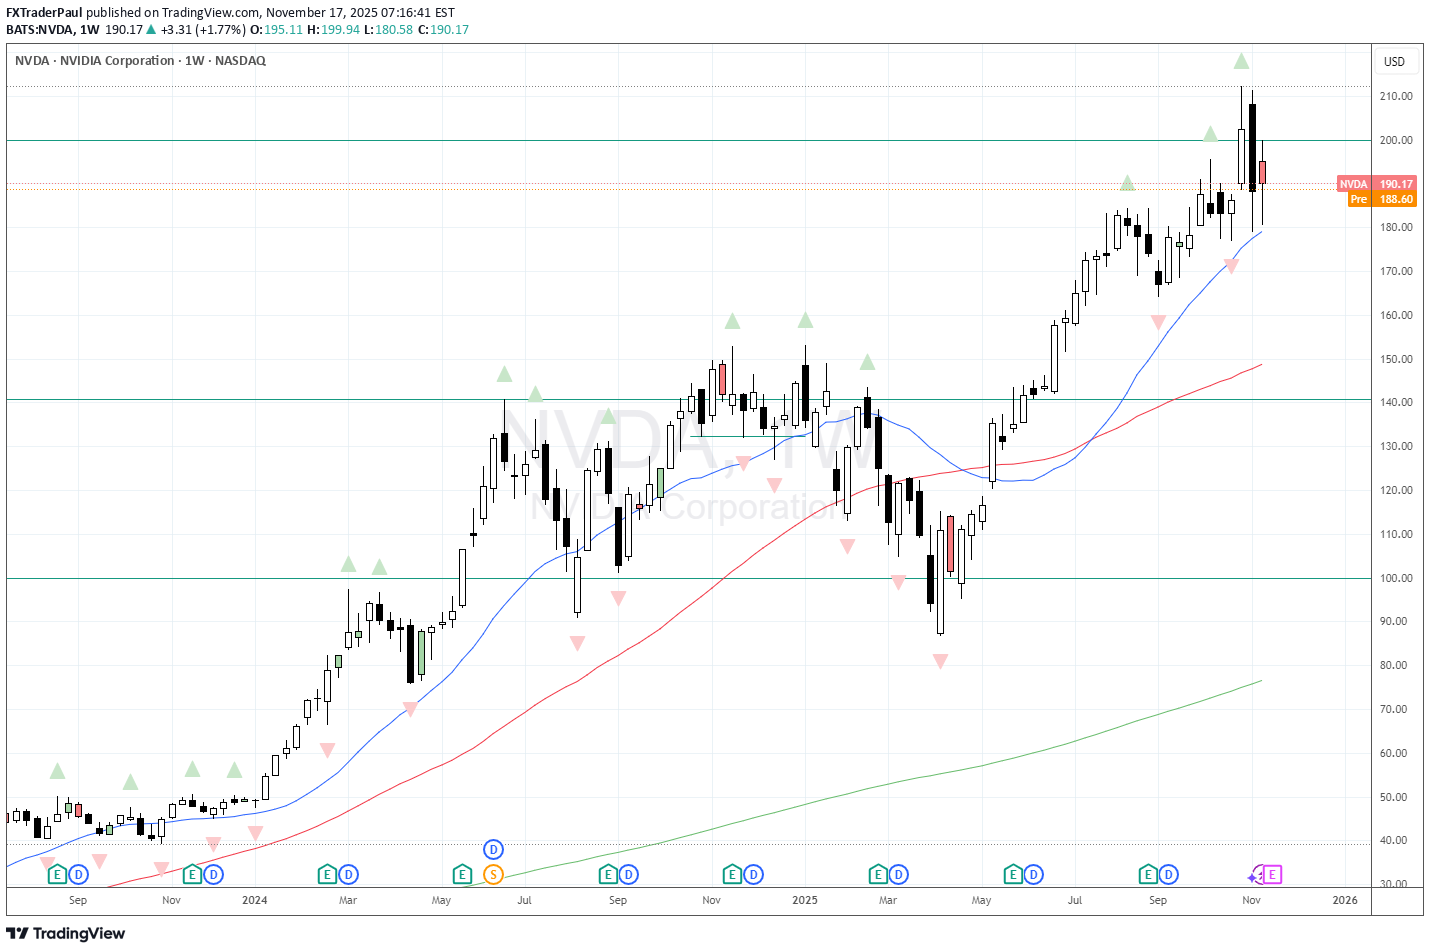
Its been another few months of great bullish moves on NVDA, however the last couple of weeks have been choppy. We rejected the $200 level and now find ourselves sat above $180 and the Weekly 20MA. If the numbers are good then I'm sure the giddiness will take us higher. If the numbers are poor the you have to ask will $180 and the Weekly 20MA act as support, or will they collapse? If they do, what will happen to tech and US markets in general? It means that its going to be an interesting week!
FXTraderPaul
بیت کوین زیر 100 هزار دلار و خط مهم میانگین متحرک 50 هفتهای: آیا سقوط ادامه دارد؟
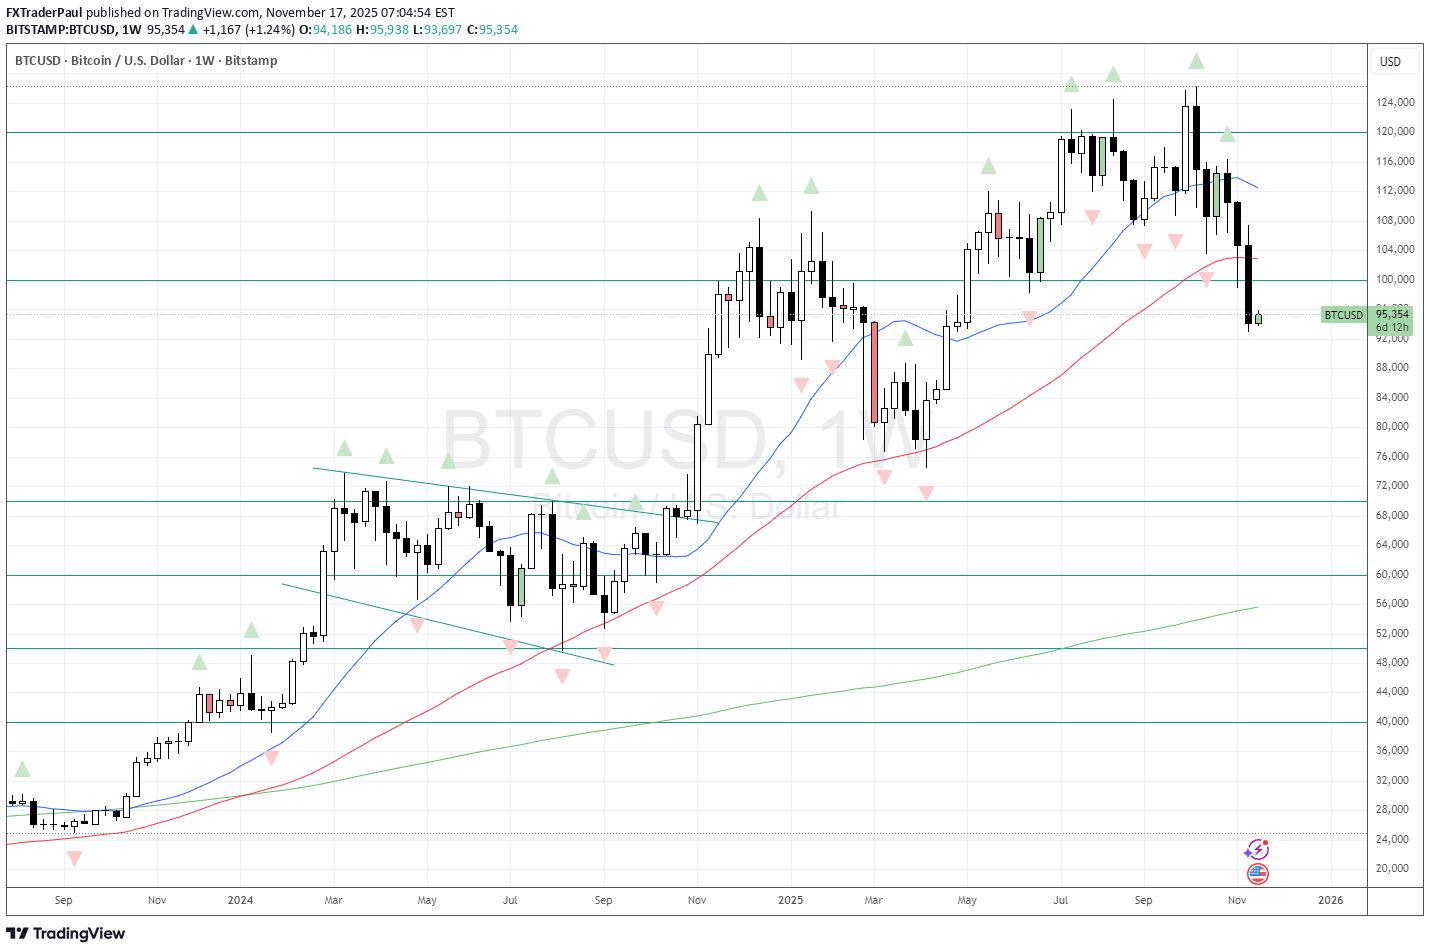
After a great run BTC has finally rolled over. We are now below the Weekly 50 MA and the $100.000 level. The question is do those technical levels now flip from being support to resistance? If so, is that a sign of another leg down?
FXTraderPaul
هشدار بزرگ برای تسلا: آیا قله سهگانه، سقوط قریبالوقوع را رقم میزند؟
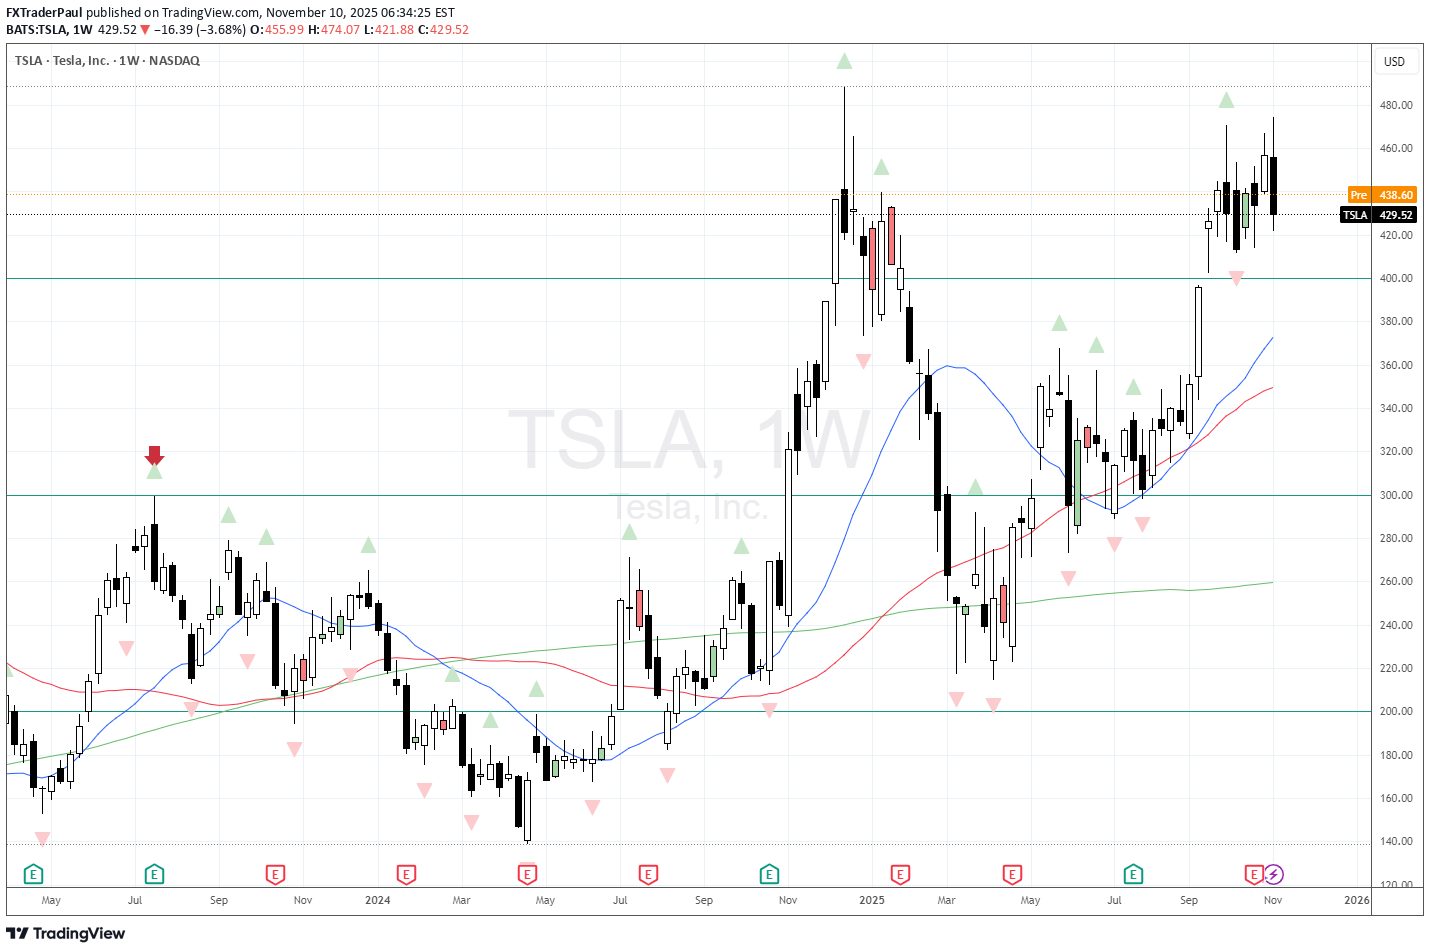
Tesla has been a volatile stock this year - and difficult to trade because of that. However I now see that we've printed a weekly bearish key reversal as part of a double/ triple top. Is this now indication that we're likely to flow lower in the immediate future? Well I am expecting some giddiness if they manage to end the US Gov't Shutdown, so it may help push prices higher for a day or two...and then the trend re-exerts itself? Bearish in the short term after the relief rally bump.
FXTraderPaul
تشکیل سقف دوقلو هفتگی در سهام متا (META): هشدار ریزش یا سکوی پرتاب؟
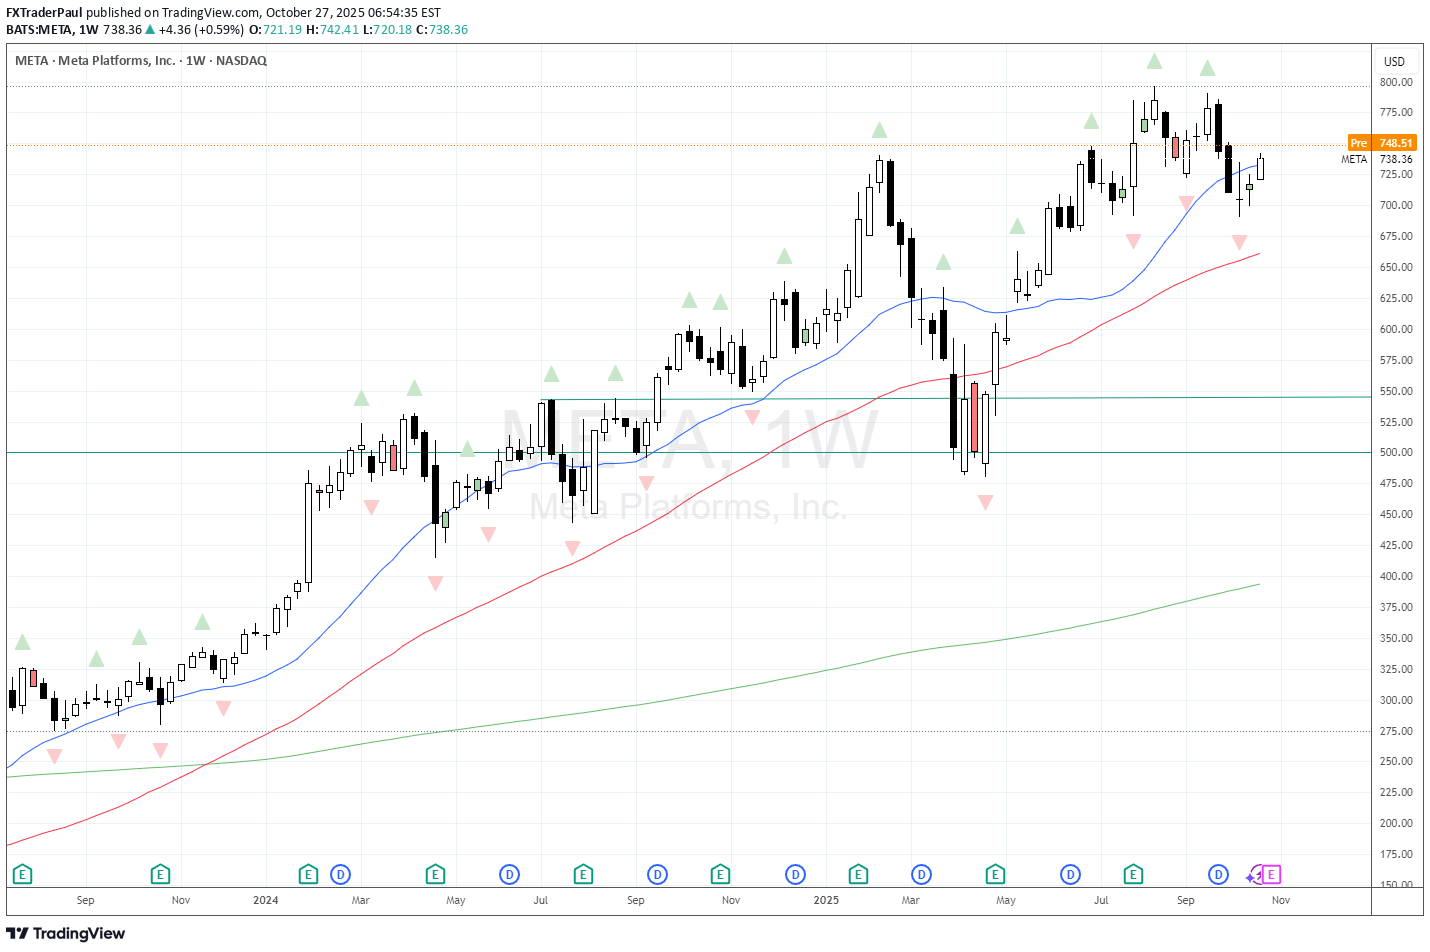
Weekly Double Top on META - does that signal concern - or is merely a pause before a move higher on overall market sentiment? I'm inclined to think the latter. There is a nice double top formed on the weekly chart - so I am watching the point 2 of the pattern, and also how the weekly 20MA performs. (If you want to learn more about double tops and bottoms you can watch the recent TOGS Trading Podcast Bonus Session to learn more.) Does it act as dynamic resistance (before a move lower) or does price slice through it on its way north? I'm inclined to think its the latter based on the news we have dropping this week.
FXTraderPaul
AAPL STRONG MONTHLY BULLISH REVERSAL

A very strong August for AAPL. My previous view had been for price to drift lower to $200 support over the quiet summer weeks. I was wrong. Strong bullish reversal on the monthly chart. Does it have what it takes to climb back to previous highs and beyond? Will watch September price action.
FXTraderPaul
XAUUSD / GOLD BREAKS OUT OF WEEKLY TRIANGLE

The summer coil in the Weekly Gold Chart has broken out higher over the last week. Bullish Swing Bias based on this.The Weekly 20MA also provided excellent support - just adding to bullish swing bias.
Disclaimer
Any content and materials included in Sahmeto's website and official communication channels are a compilation of personal opinions and analyses and are not binding. They do not constitute any recommendation for buying, selling, entering or exiting the stock market and cryptocurrency market. Also, all news and analyses included in the website and channels are merely republished information from official and unofficial domestic and foreign sources, and it is obvious that users of the said content are responsible for following up and ensuring the authenticity and accuracy of the materials. Therefore, while disclaiming responsibility, it is declared that the responsibility for any decision-making, action, and potential profit and loss in the capital market and cryptocurrency market lies with the trader.