FXOpen
@t_FXOpen

What symbols does the trader recommend buying?
Purchase History
پیام های تریدر
Filter
FXOpen
طلا در دوراهی حساس: منتظر دادههای بزرگ اقتصادی آمریکا!
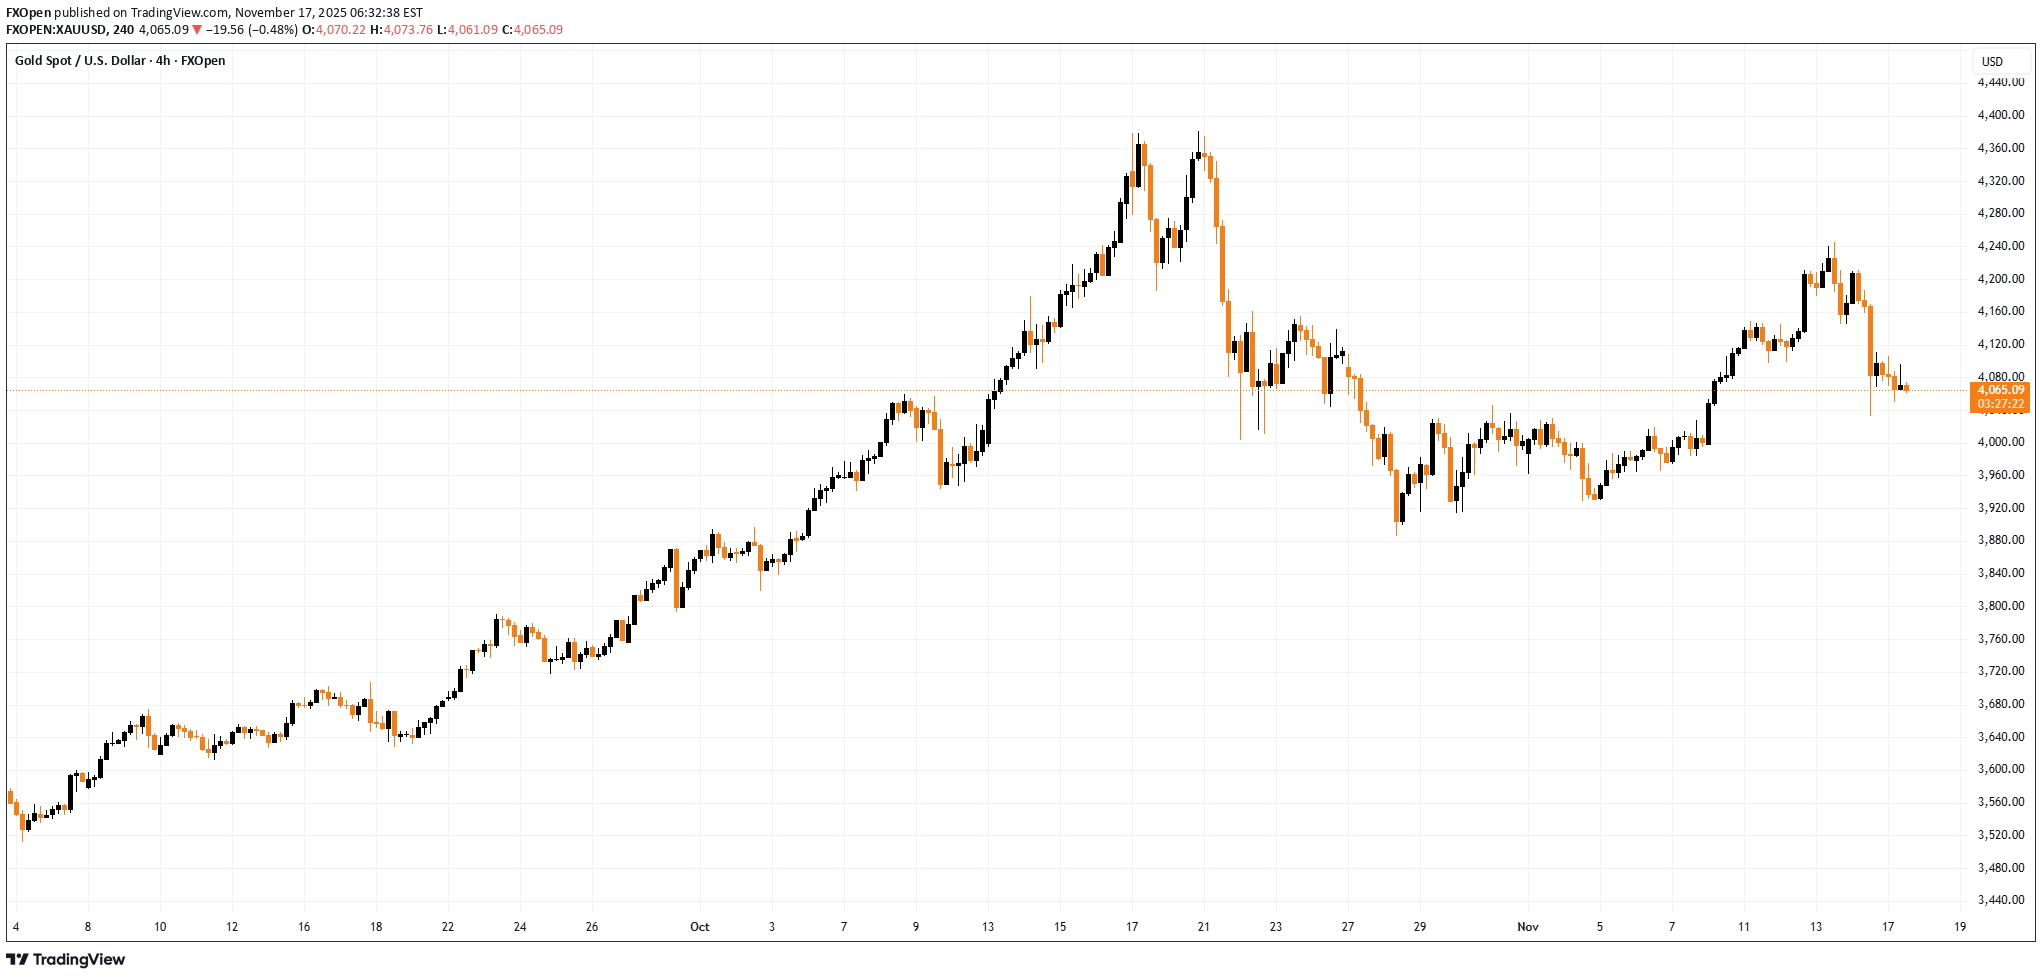
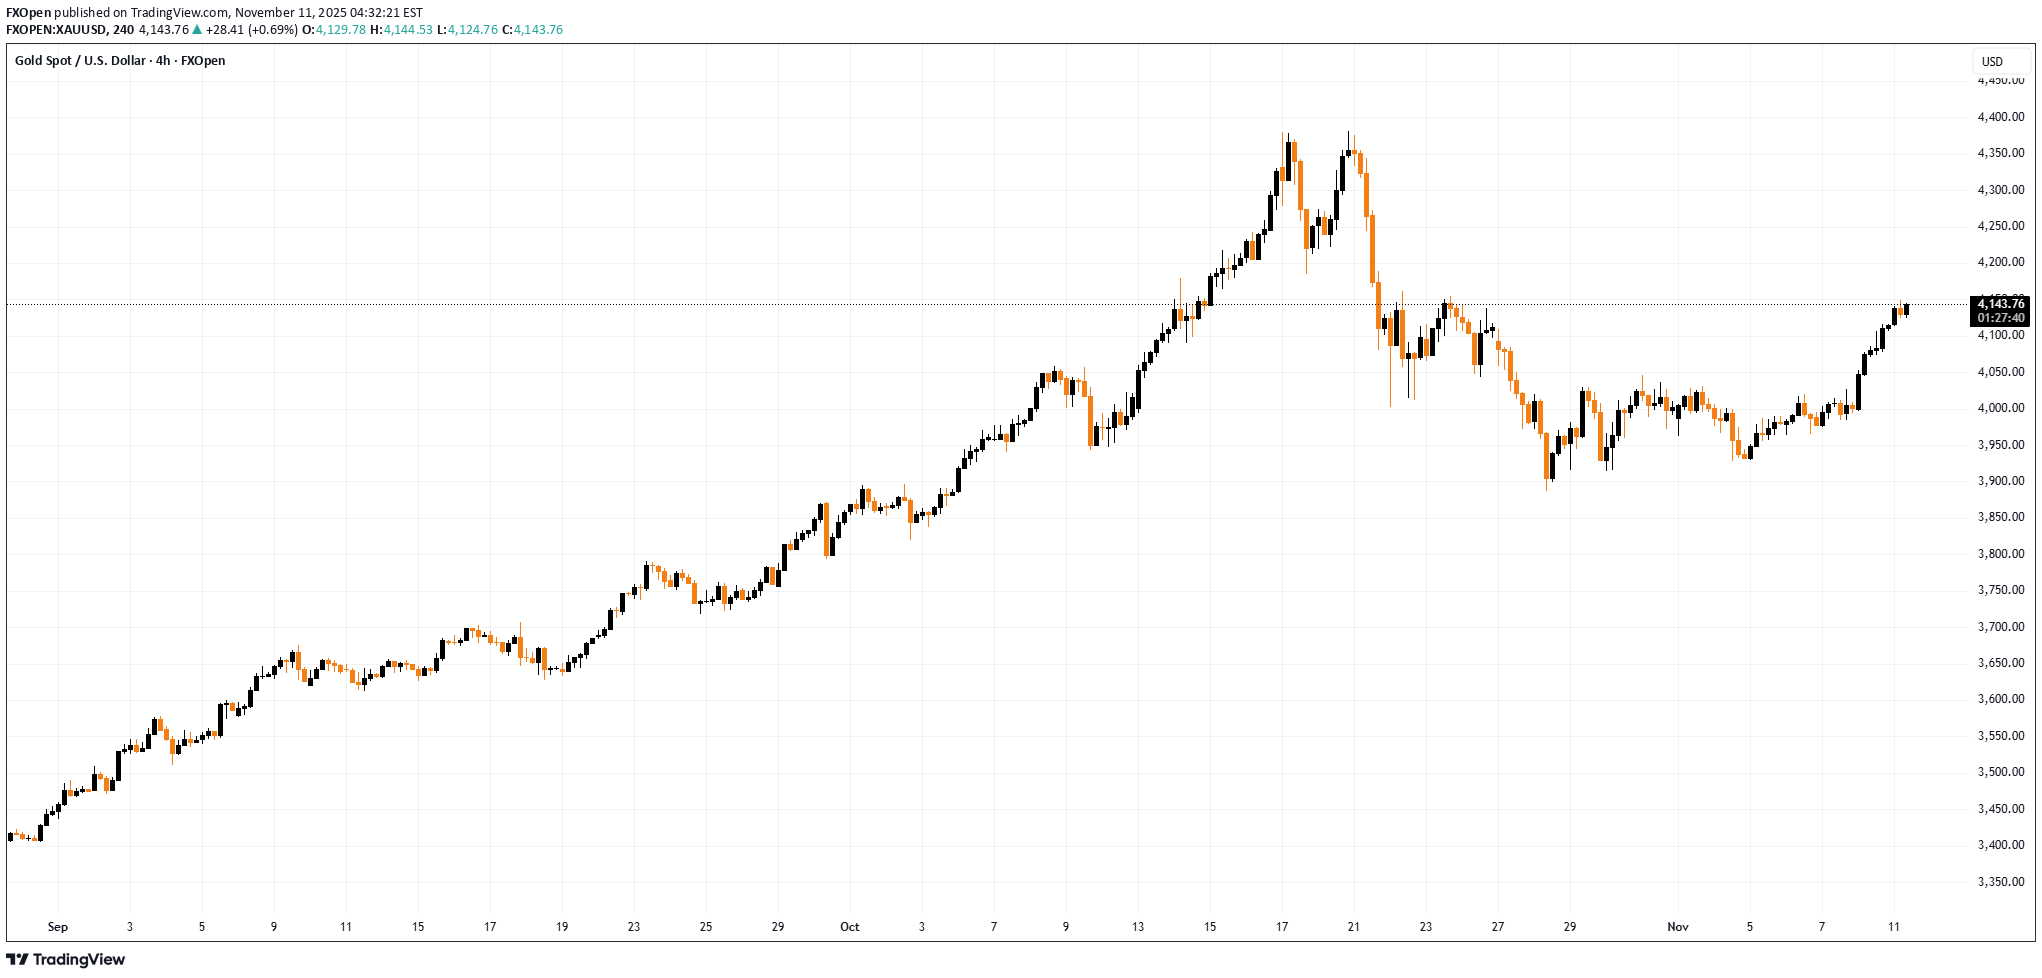
Gold Price Balanced Amid Heightened Uncertainty As the XAU/USD chart shows, last week gold prices fell sharply, interrupting the previous upward trend. This decline was driven by two main factors: → End of the US government shutdown. This is believed to have reduced short-term economic risks and lessened demand for gold as a “safe-haven” asset. → Hawkish statements from Federal Reserve officials, which lowered market expectations for rate cuts. This pushed up US Treasury yields, traditionally putting downward pressure on non-yielding assets like gold. This week, the market is awaiting a wave of delayed US economic reports that were postponed during the shutdown, including: → Labour market data (Non-Farm Payrolls) → Inflation data (CPI) These releases are expected to give traders greater clarity on the future trajectory of Fed interest rates. Technical Analysis of XAU/USD From a technical perspective, the price is currently trading at the intersection of two key lines: → Resistance line from the upper boundary of the descending channel originating at the all-time high. Buyers attempted to break through this level last week but were unsuccessful. → Support line from the lower boundary of the ascending channel, in place since early autumn. Given the above, it is reasonable to suggest that: → the market is in a balanced position, with traders adopting a wait-and-see approach; → a breakout from the symmetrical triangle could indicate the direction of the next significant move in gold prices. This article represents the opinion of the Companies operating under the FXOpen brand only. It is not to be construed as an offer, solicitation, or recommendation with respect to products and services provided by the Companies operating under the FXOpen brand, nor is it to be considered financial advice.
FXOpen
پیشبینی حرکت قیمت انویدیا (NVDA) پیش از اعلام نتایج: تحلیل تکنیکال و انتظارات بازار
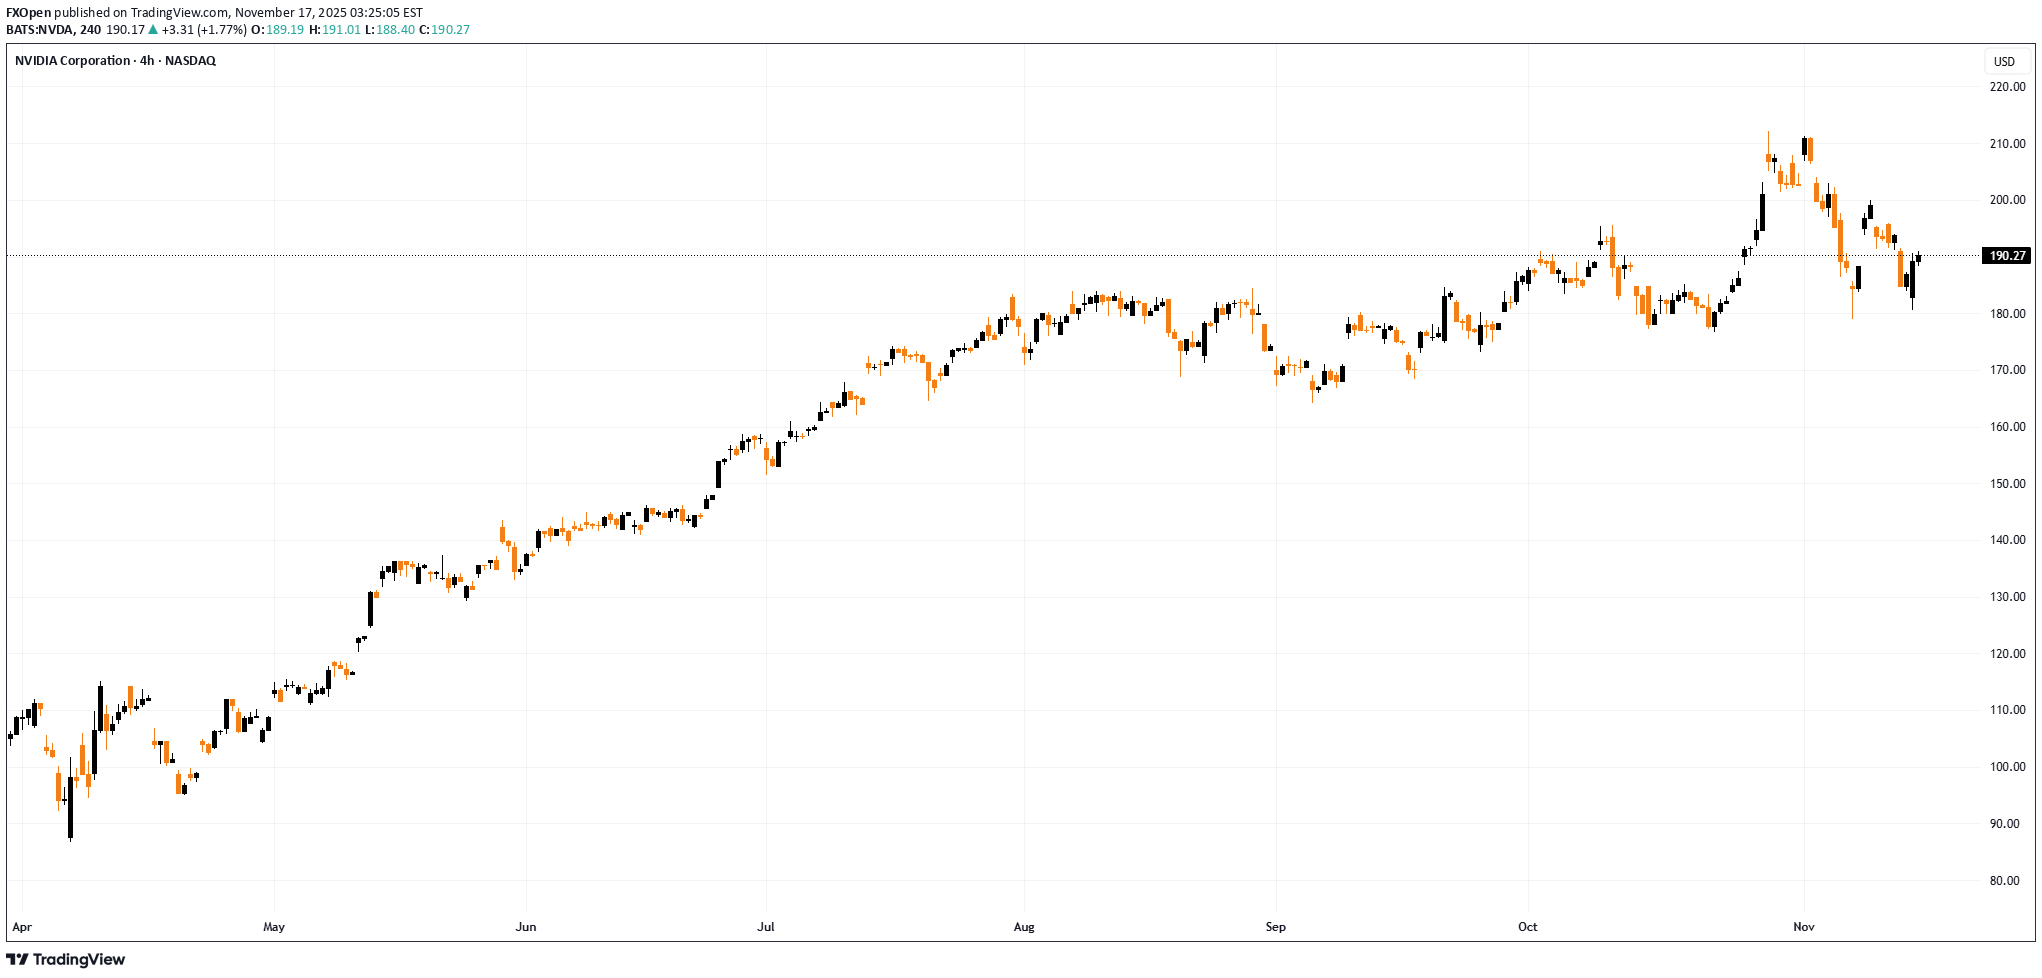
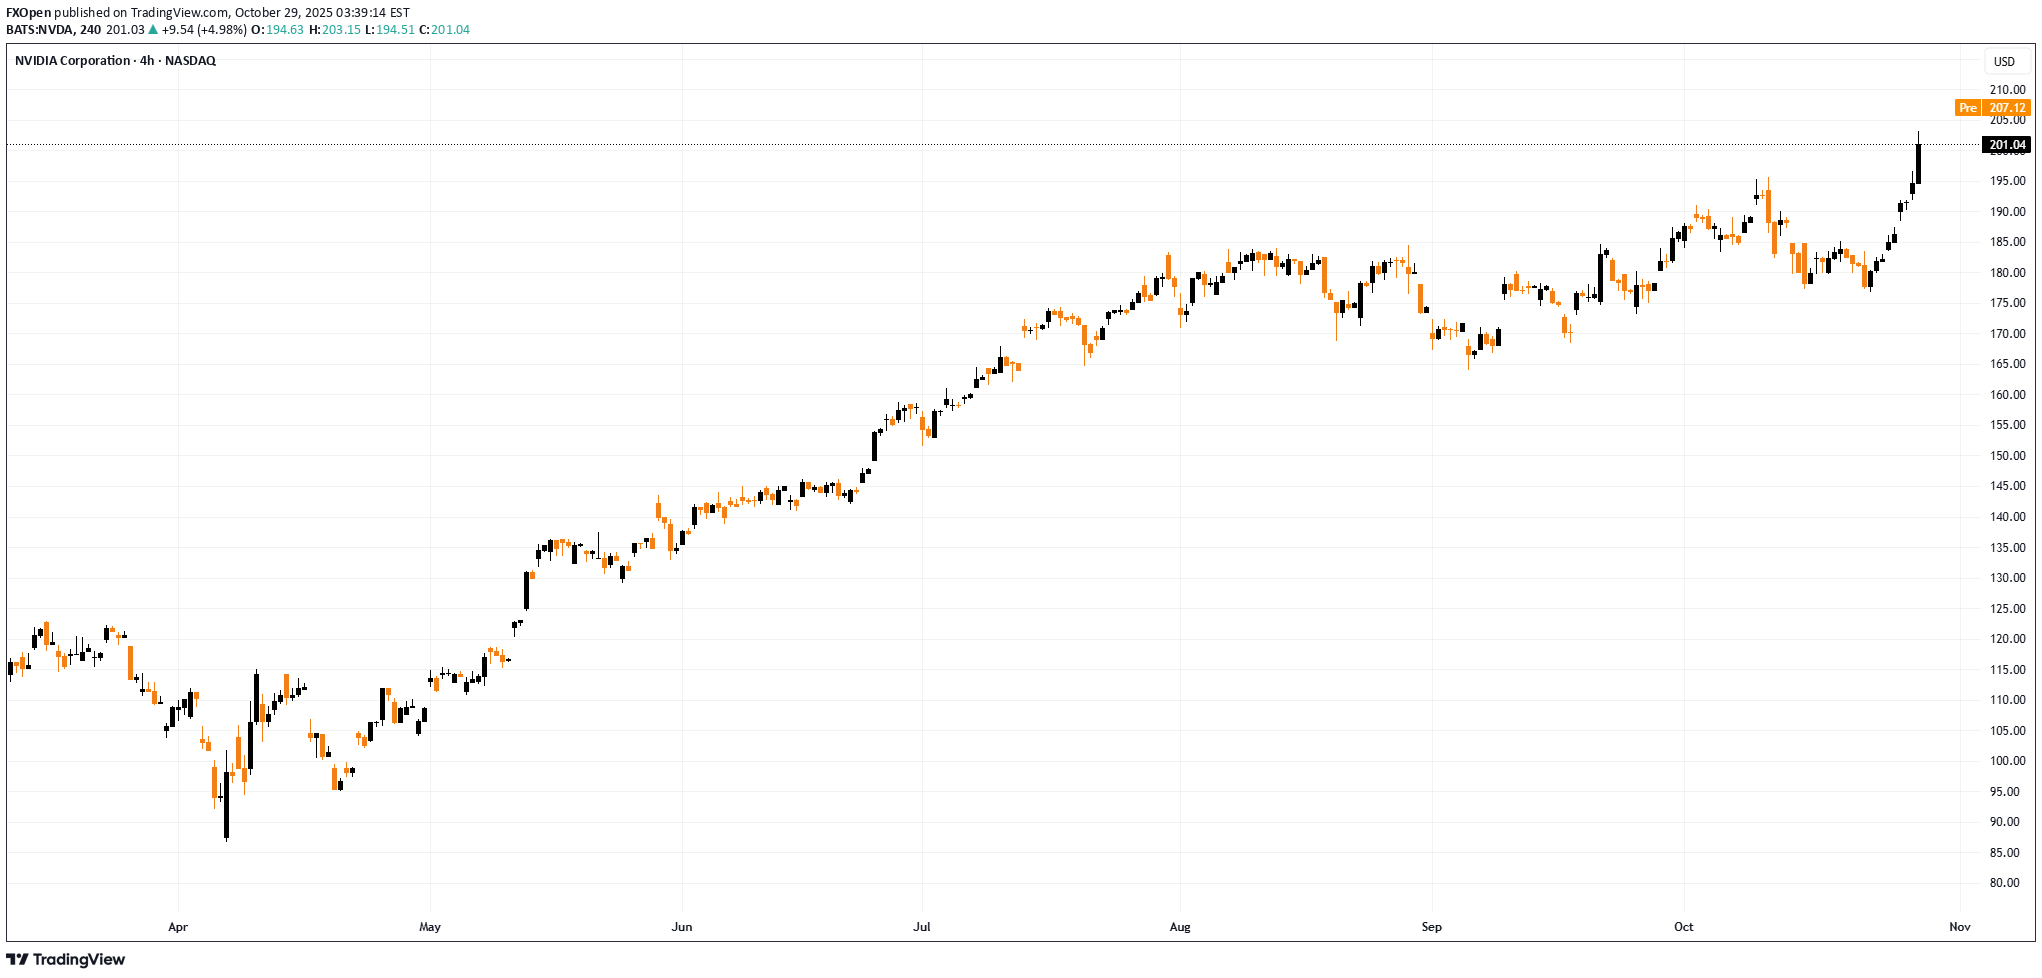
Ahead of Nvidia’s (NVDA) Earnings: How the Price Could Move On Wednesday, after the close of the main US trading session, Nvidia will release its quarterly results — a report seen not merely as another batch of corporate data but as a crucial test for the entire AI-driven bull run. NVDA shares are up more than 40% since the start of the year, and the company must now prove that this surge is justified and that the AI revolution is still accelerating. According to media reports, Wall Street analysts remain optimistic: → Revenue: forecast around $54.9bn, implying roughly 56% year-on-year growth. → Earnings per share (EPS): about $1.25 (previous quarter: $1.05). What should investors focus on? Of particular importance will be: → data on Data Centre revenue, a key indicator of whether the AI boom remains intact; → forward guidance, as the market is looking for reassurance that Big Tech will continue to spend heavily on AI. Technical Analysis of the Nvidia (NVDA) Chart Recent price action in NVDA points to a sequence that can be interpreted as bearish: → 28 October: a strong rally above the psychological $200 level; → a failure to hold above that barrier; → a pullback on rising volumes (Nasdaq data) with expanding candles in early November. In the broader market context, it is notable that early November has seen NVDA underperforming major equity indices, signalling firm resistance from sellers around $200. From a bullish perspective, the decline from the all-time high resembles a correction pattern (shown in red) within a larger uptrend. However, there is a risk that the market’s high expectations will not be met when the earnings report is published. If that happens, NVDA could extend its decline towards the lower boundary of the rising channel, where support lies near $165. This article represents the opinion of the Companies operating under the FXOpen brand only. It is not to be construed as an offer, solicitation, or recommendation with respect to products and services provided by the Companies operating under the FXOpen brand, nor is it to be considered financial advice.
FXOpen
سهام متا (META) به کف حمایتی رسید: آیا خیزش دوباره آغاز میشود؟
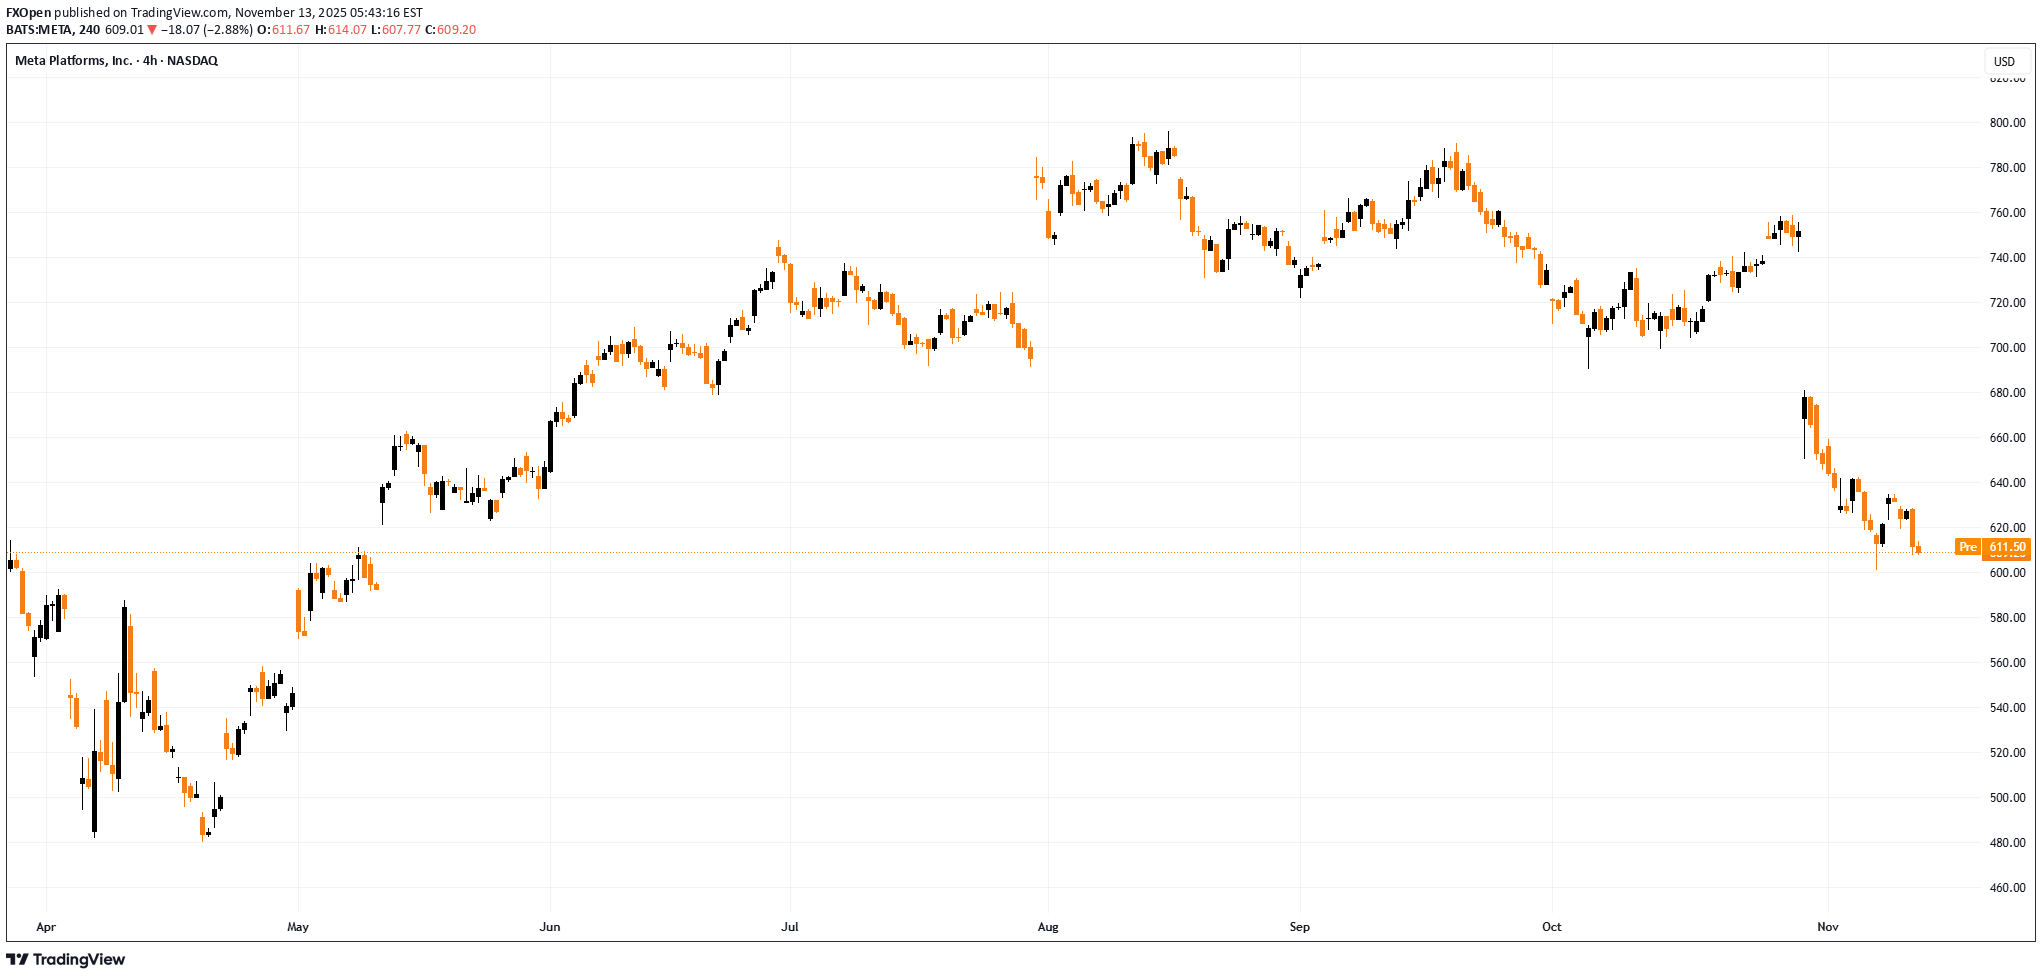
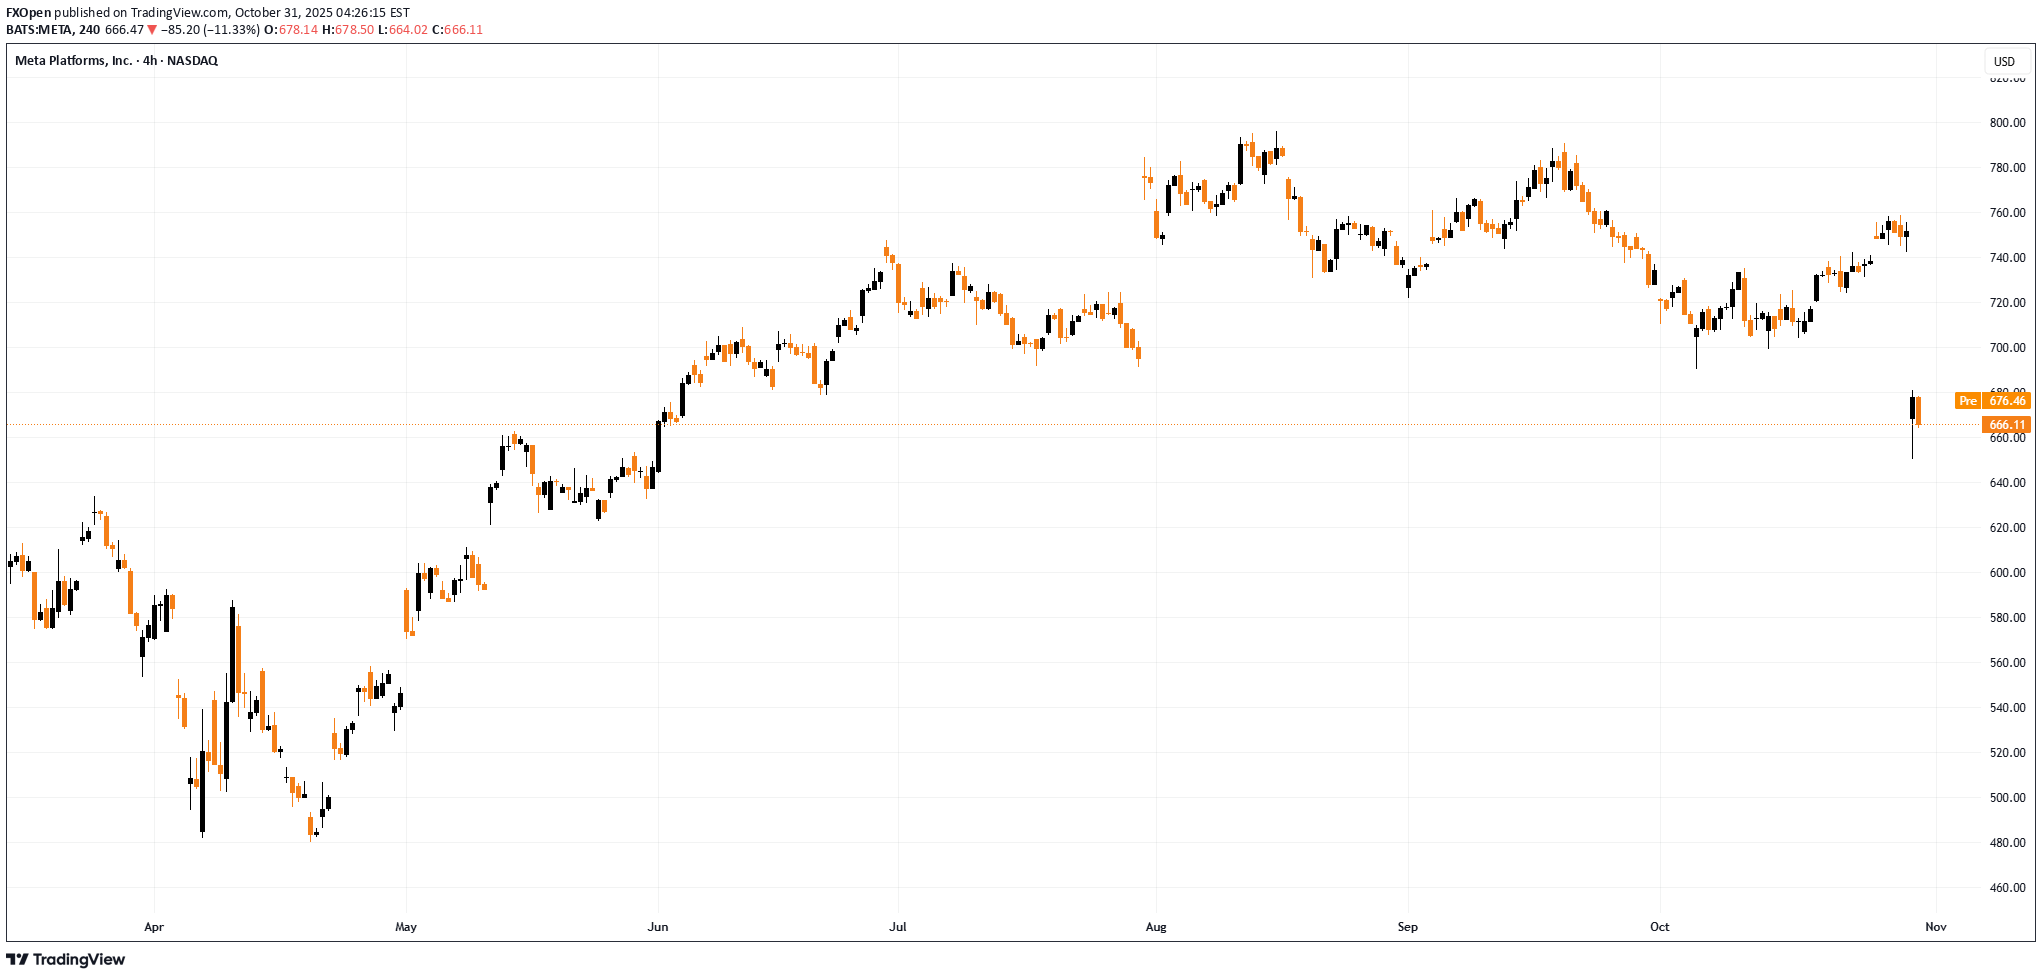
Meta Platforms (META) Shares Fall to Key Support In November, Meta Platforms (META) shares have shown bearish momentum following the company’s quarterly report, which included a one-off income tax expense of $15.93 billion (as previously noted). Investor concerns have been further fuelled by the company’s plans to raise capital expenditure to $70–72 billion in 2025, aimed at expanding data centre infrastructure and acquiring AI chips. However, after a decline of more than 20% from the autumn peak, bulls may soon attempt a comeback. Technical Analysis of META When analysing META’s chart on 31 October, a descending channel (shown in red) was identified. As of today, the share price has reached a support block formed by the following key elements: → the lower boundary of the descending channel; → the psychological level of $600 per share; → and the May bullish gap area. It is also worth noting that the RSI is approaching oversold territory, and a false bearish breakout below the $600 psychological level could create a bullish divergence. Therefore, it cannot be ruled out that: → the November decline has already priced in the post-earnings concerns; → and that bulls may use this support zone as a springboard to resume the broader uptrend. This article represents the opinion of the Companies operating under the FXOpen brand only. It is not to be construed as an offer, solicitation, or recommendation with respect to products and services provided by the Companies operating under the FXOpen brand, nor is it to be considered financial advice.
FXOpen
پاداش تریلیون دلاری ایلان ماسک: سهام تسلا (TSLA) در مسیر صعود یا سقوط؟
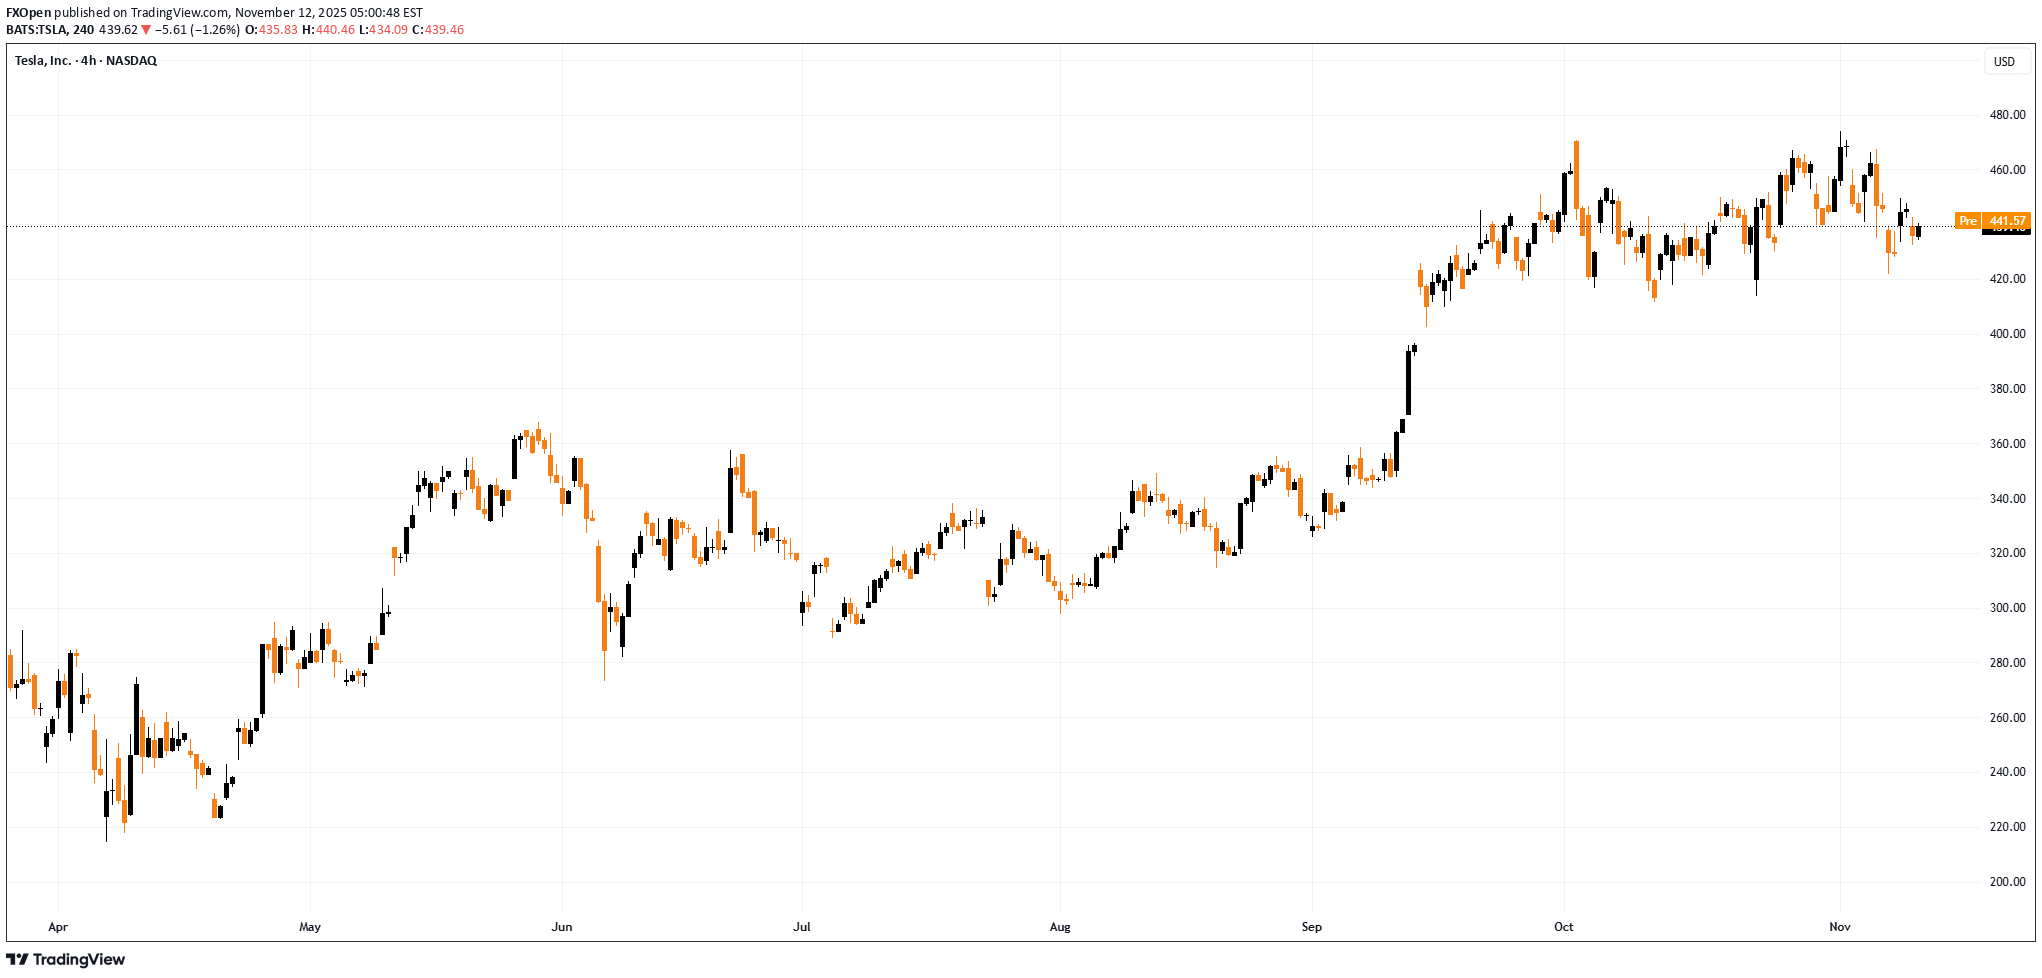
Musk Could Earn a Trillion: How Are Tesla (TSLA) Shares Reacting? According to media reports, earlier this month Tesla shareholders approved a new 10-year compensation package for Elon Musk worth up to $1 trillion. But is this good or bad news for TSLA shares? → On the plus side, Musk is now firmly “tied” to the company and highly motivated to achieve extraordinary goals — such as reaching a market capitalisation of $8.5 trillion and launching mass production of Optimus robots. → On the downside, the price of this decision could be high. The targets appear almost fantastical, and their achievement would mean dilution of existing shareholders’ stakes through the issuance of new options. As a result, Tesla’s share price has been fluctuating, reflecting market indecision and consolidating after the news. A closer look at the TSLA chart offers clues as to what may happen next. Technical Analysis of TSLA From a bullish perspective, Tesla’s share price remains within an upward-sloping trend channel, where: → the median line is showing signs of acting as support; → the sharp rally in September formed a demand zone, where an imbalance between buyers and sellers triggered a strong move higher — the upper boundary of this channel, around the psychological $400 mark, could act as a support level going forward. From a bearish point of view, the key barrier remains the current all-time high, which continues to cap the ongoing rally (roughly +100% from this year’s low). Given these factors, it is reasonable to assume that TSLA is currently in a consolidation phase. The situation could eventually resolve in favour of the bulls if the price holds the lower boundary of the channel — as seen previously, when a similar consolidation period preceded a breakout above the $360 resistance level. This article represents the opinion of the Companies operating under the FXOpen brand only. It is not to be construed as an offer, solicitation, or recommendation with respect to products and services provided by the Companies operating under the FXOpen brand, nor is it to be considered financial advice.
FXOpen
پایان تعطیلی دولت آمریکا: طلا به کدام سمت میرود؟ (تحلیل قیمت طلای پس از بحران)
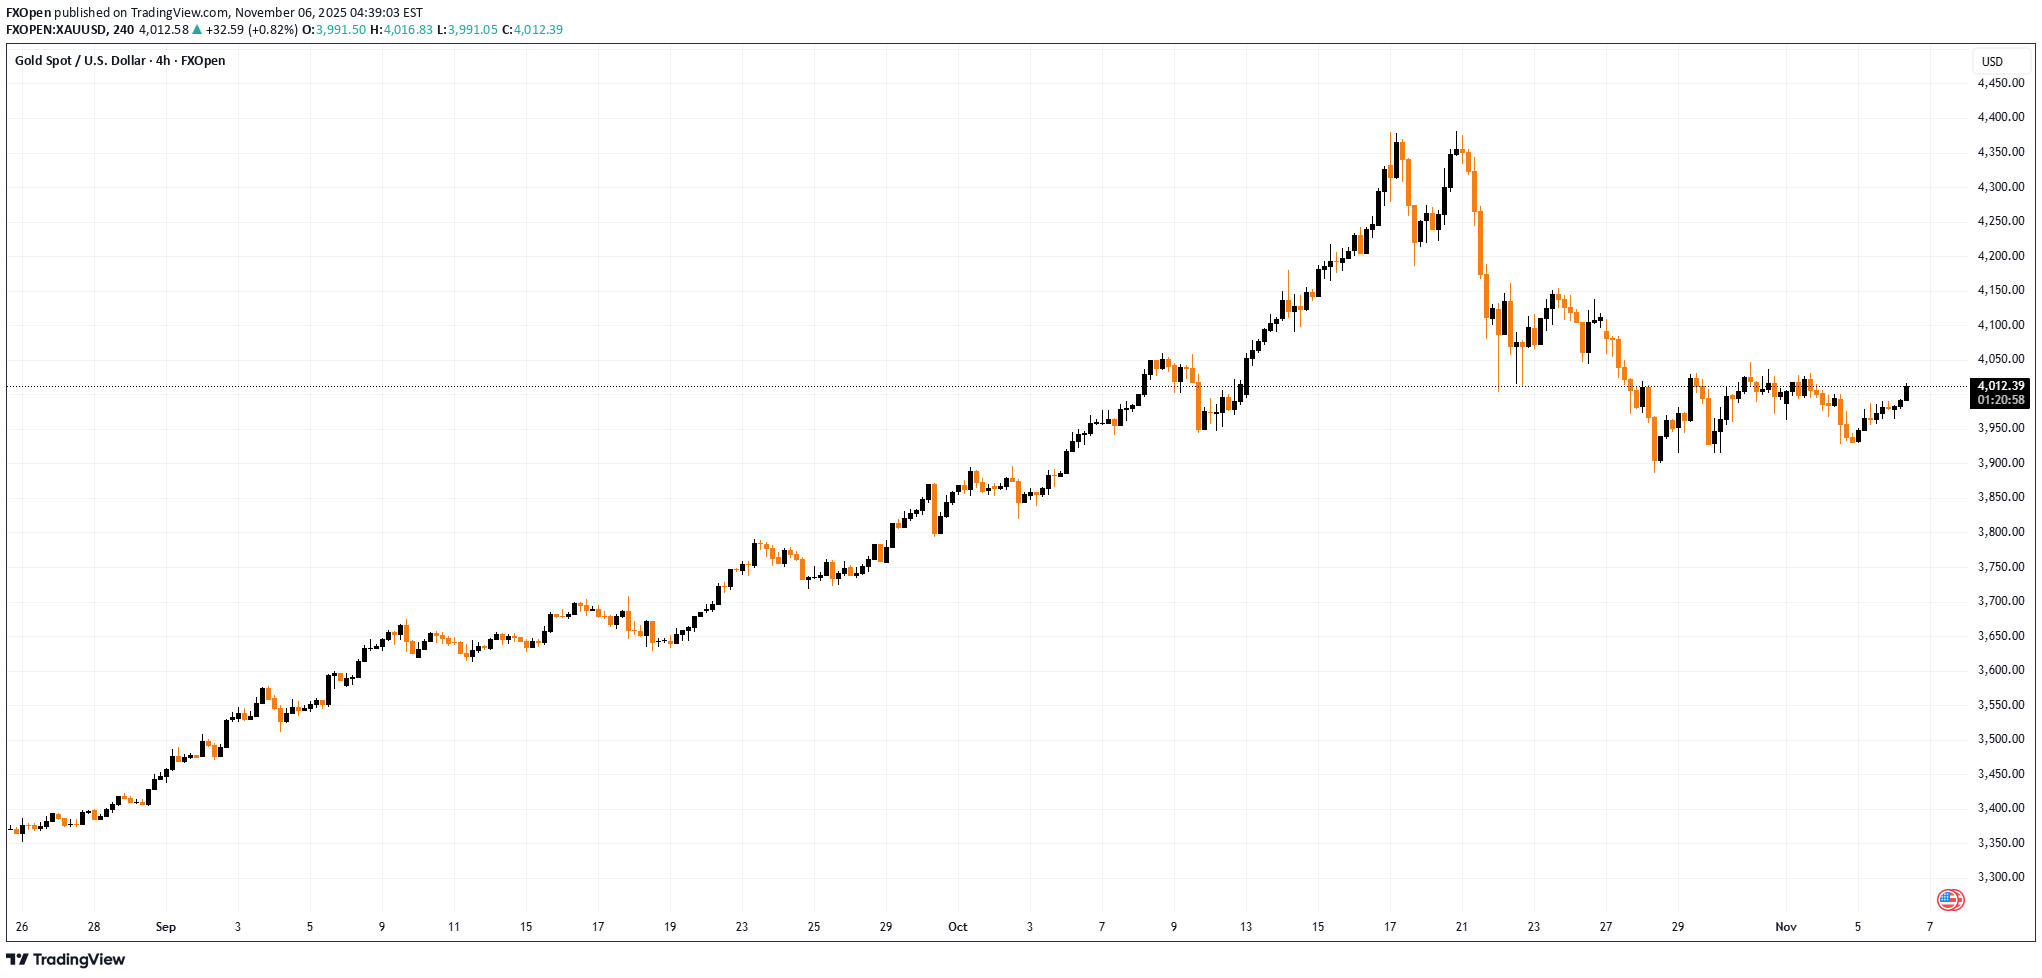
The Shutdown Ends: How Will Gold Prices React? According to Reuters, the U.S. Senate on Monday approved a compromise deal to bring an end to the longest government shutdown in the country’s history. During the shutdown: → millions of Americans lost access to food assistance programmes; → hundreds of thousands of federal employees went without pay; → air travel was severely disrupted. The uncertainty surrounding the potential continuation of the shutdown appears to have contributed to a breakout in the price of gold (as a traditional safe-haven asset) above its recent consolidation zone, marked by black lines on the chart. However, further gains could be capped not only by fading risk aversion but also by a less obvious resistance level, which the XAU/USD rate has reached today. Technical Analysis of the XAU/USD Chart Using the key pivot points (highlighted in bold), we can trace a descending channel, with the gold price now testing its upper boundary, where resistance may emerge. Another argument supporting this view is that the price currently sits around the 50% retracement level of the A→B downswing. This area may attract sellers seeking to defend the downward trajectory of gold. Whether this resistance line holds — or the bulls attempt to reignite the autumn rally — will largely depend on the tone of upcoming economic releases (delayed by the shutdown) and their impact on market expectations for a possible Federal Reserve rate cut. This article represents the opinion of the Companies operating under the FXOpen brand only. It is not to be construed as an offer, solicitation, or recommendation with respect to products and services provided by the Companies operating under the FXOpen brand, nor is it to be considered financial advice.
FXOpen
تحلیل بازار طلا: تثبیت قیمت در محدوده ۴۰۰۰ دلار و نقاط کلیدی پیش رو
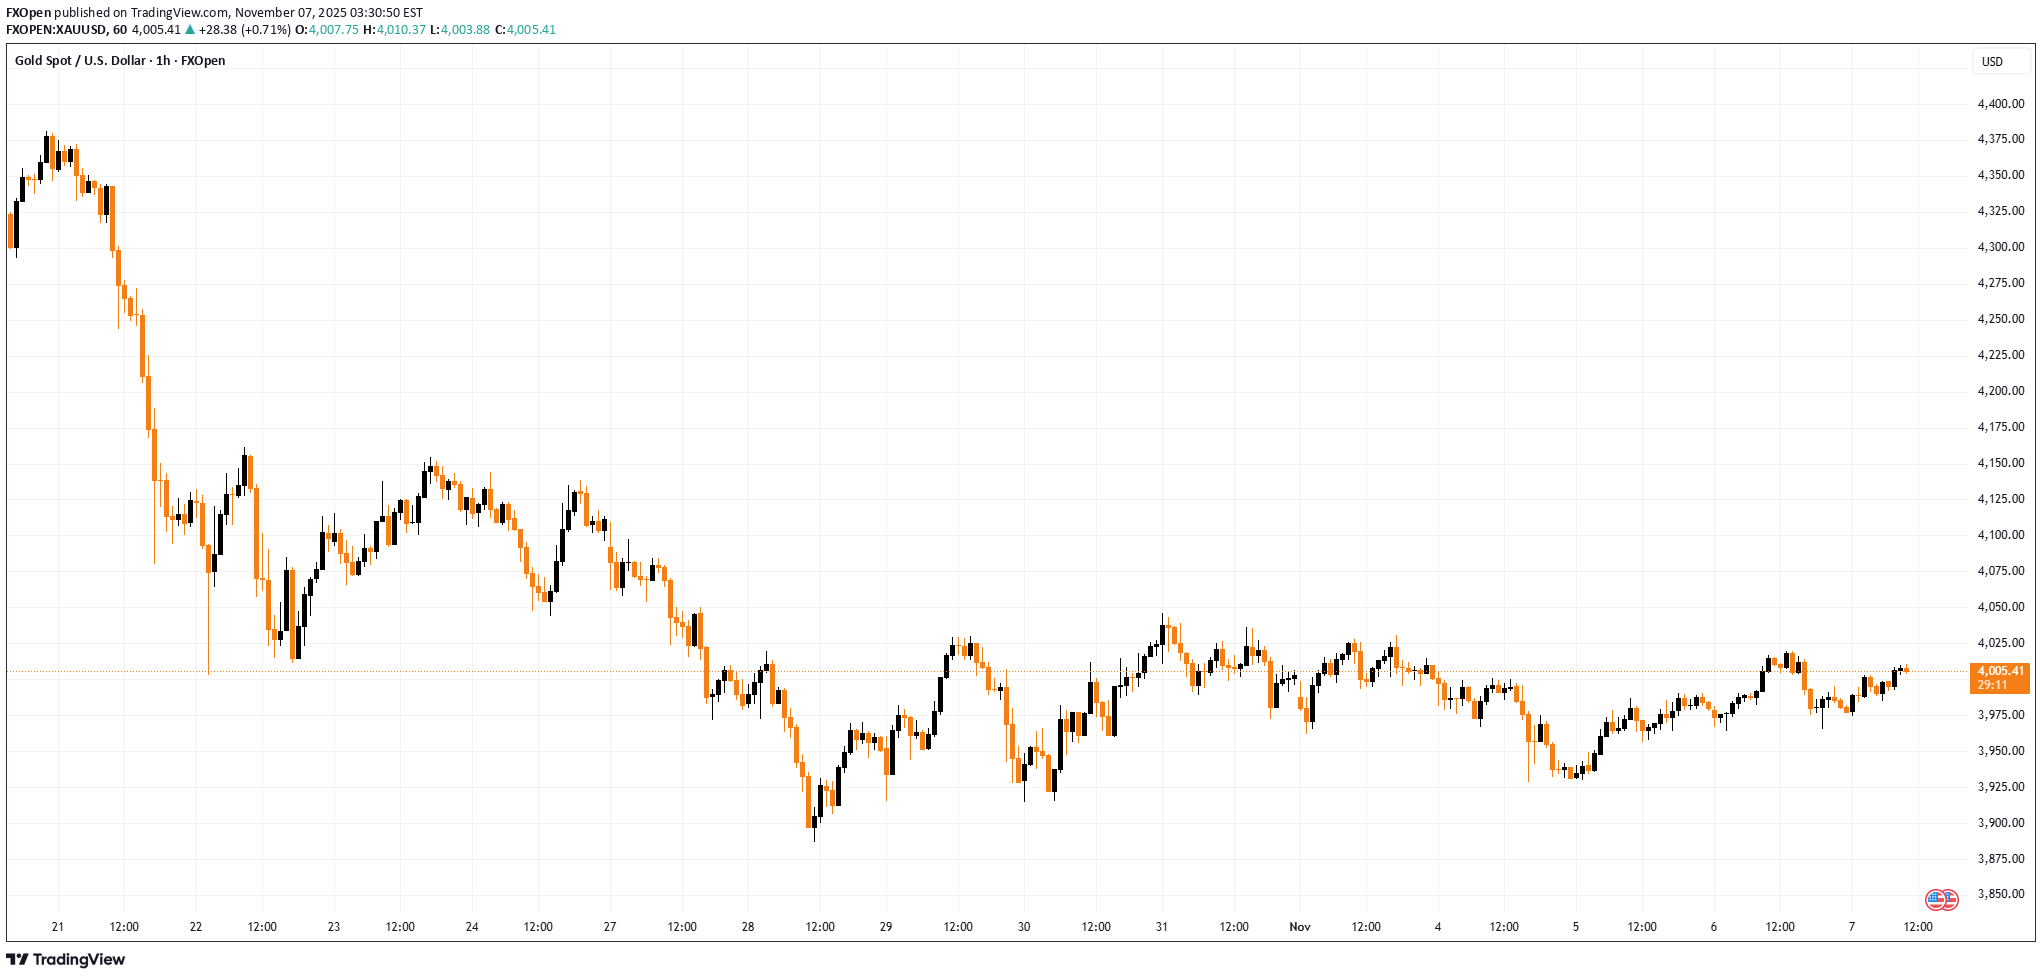
Market Analysis: Gold Stays Flat Gold price corrected gains, traded below $4,000, and started a consolidation. Important Takeaways for Gold Price Analysis Today - Gold price started a downside correction below $4,100 and $4,000 against the US Dollar. - A key bullish trend line is forming with support at $3,985 on the hourly chart of gold. Gold Price Technical Analysis On the hourly chart of Gold, the price formed a base above $3,915. The price remained in a bullish zone and started an upward move within a range above $3,930. There was a decent move above the 50-hour simple moving average and $3,975. The bulls pushed the price above the $4,000 and $4,010 resistance levels. A high was formed at $4,019 before the price saw a pullback. The price dipped below the 23.6% Fib retracement level of the upward move from the $3,928 swing low to the $4,019 high, and the RSI declined below 50. Initial support on the downside is near $3,985, a bullish trend line, and the 50-hour simple moving average. The first major area of interest for the bulls is near the 50% Fib retracement at $3,975. If there is a downside break below $3,975, the price might decline further. In the stated case, the price might drop toward $3,950. Any more losses might push the price toward $3,930. Immediate resistance is near $4,020. The next major hurdle for the bulls is $4,030. An upside break above $4,030 could send Gold price toward $4,045. Any more gains may perhaps set the pace for an increase toward $4,090. This article represents the opinion of the Companies operating under the FXOpen brand only. It is not to be construed as an offer, solicitation, or recommendation with respect to products and services provided by the Companies operating under the FXOpen brand, nor is it to be considered financial advice.
FXOpen
جهش تاریخی طلا: قیمت از مرز 4000 دلار عبور کرد!
Gold Price Surges Above $4,000 As the chart shows, XAU/USD climbed above the $4,000 mark today, a move likely driven by: → Weakness in the US dollar index – or a pullback from the resistance level discussed in yesterday’s DXY analysis. → Concerns over the ongoing US government shutdown – according to media reports, one consequence has been that American airlines began limiting ticket sales in November. Technical Analysis of XAU/USD On 28 October, our analysis of gold price movements showed the following: → We constructed an ascending channel (marked in blue), illustrating the metal’s remarkable rally from its August low. → We suggested that the developing pullback might target the QL line, reinforced by the round-number support at $3,900. This support zone successfully held, forming a local bottom at point B, after which the price entered a period of consolidation, resembling a symmetrical triangle pattern. Notably, gold has today broken upward through this triangle (outlined in black). In the broader context, this breakout represents a strong signal from the bulls, suggesting a possible resumption of the 2025 uptrend. If buying momentum continues, their strength may be tested by: → Resistance at $4,045; → Resistance near $4,150, which aligns with the 50% retracement of the A→B decline and has previously acted as a reversal zone for XAU/USD. This article represents the opinion of the Companies operating under the FXOpen brand only. It is not to be construed as an offer, solicitation, or recommendation with respect to products and services provided by the Companies operating under the FXOpen brand, nor is it to be considered financial advice.
FXOpen
سهام آمازون رکورد شکست: رسیدن AMZN به مرز 250 دلار برای اولین بار!
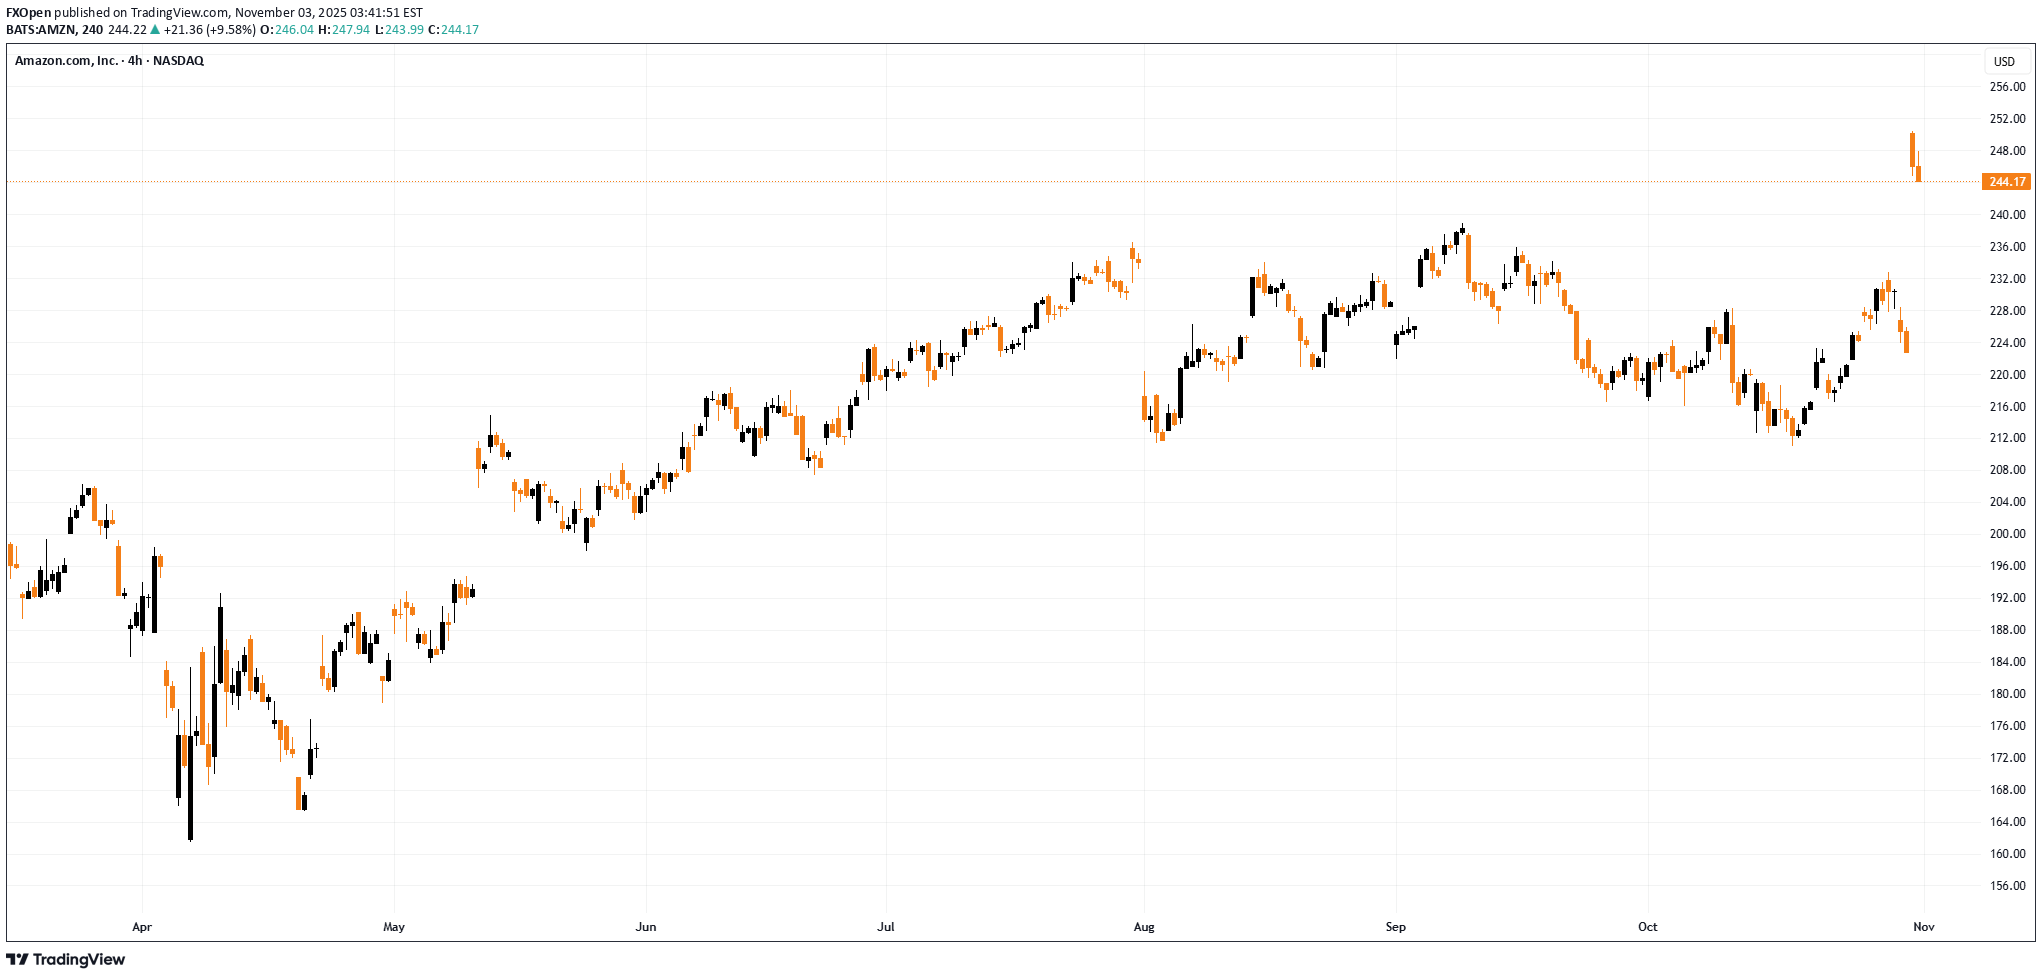
Amazon (AMZN) Shares Reach $250 for the First Time As the chart shows, Amazon (AMZN) shares rose to a record high on Friday, reaching the $250 mark for the first time. This came after the publication of a strong earnings report: → Revenue: $180.2 billion (up 13% year on year). → Earnings per share (EPS): actual = $1.95, forecast = $1.56 (a 25% beat). Investor sentiment was further boosted by the following: → AWS (Amazon Web Services) revenue grew by 20% year on year, despite competition from Microsoft Azure and Google Cloud. → Amazon issued a confident outlook for the crucial holiday (fourth) quarter. Technical Analysis of Amazon (AMZN) Chart When analysing the chart on 24 September, we: → used AMZN share price fluctuations to construct an upward channel (shown in blue); → noted early signs of weakness. Subsequently, the price reached a low at point A – where the bulls found support from the lower boundary of the channel and the August low (in fact, there was a false bearish breakout) – and made a successful attempt to resume the uptrend. The two red candles on Friday suggest that the initial reaction to the report may have been overly optimistic (as confirmed by the RSI indicator). Therefore, it is possible that a corrective move will follow – for example, towards the support area that includes: → the median line of the current channel; → the previous all-time high of $242; → the September high around $238; → the 0.382 Fibonacci retracement level of the A→B impulse, around $235. This article represents the opinion of the Companies operating under the FXOpen brand only. It is not to be construed as an offer, solicitation, or recommendation with respect to products and services provided by the Companies operating under the FXOpen brand, nor is it to be considered financial advice.
FXOpen
سقوط ۱۱ درصدی سهام متا: چه چیزی پشت سرمایهگذاری عظیم زاکربرگ برای هوش مصنوعی است؟
Meta Platforms (META) shares plunge 11% On Wednesday, Meta Platforms (META) released its quarterly report, which included several positive highlights: → revenue rose to $51.2 billion (forecast: $49.5 billion); → the size of the daily active audience increased to 3.54 billion people. However, META’s share price fell below the psychological threshold of $700, hitting its lowest level in almost five months. This drop was triggered by two unpleasant surprises revealed in the report. Tax write-offs According to media reports, due to new US tax legislation (referred to as the “One Big Beautiful Bill Act”), the company recorded a one-off income tax expense of $15.93 billion. Because of this write-off, earnings per share (EPS) came in at $1.05 (analysts had expected $6.72). However, the company clarified that excluding this one-off item, EPS would have been $7.25, which would have been a very strong result. AI-related expenses Another factor that may have alarmed shareholders is that Mark Zuckerberg’s company raised its capital expenditure forecast for 2025 to $70–72 billion. These funds will go towards building data centres and purchasing AI chips. In essence, Meta Platforms is striving to take a leading position in the AI space and is prepared to spend tens of billions to achieve that goal. For shareholders, this means that even as revenue grows, net profit is being eroded by massive spending—and it remains unclear when these costs will pay off. Technical analysis of META’s chart When analysing META’s chart in mid-August, we: → drew an ascending channel (shown in blue); → pointed out signs of weakness (including a bearish gap¹, shown in orange); → suggested that the balance could shift in favour of the bears, which might trigger a noticeable correction in META’s share price. This scenario played out as a decline from A → B. After rebounding from the key line of the blue channel, the price rose towards the bearish gap¹, forming a lower high C. The downward movement then continued, and the channel was extended with a lower low D. The large bearish gap² that formed this week could also act as resistance (as in the previous case), and this effect is likely to be more pronounced near the $700 psychological level. Overall, the picture looks extremely negative: → the sequence of lower highs and lows A → D is likely to continue with a new lower low F; → the price remains in the lower half of the red channel, drawn along this sequence. From a bullish perspective: → $650 serves as a psychological support level; → if the rise from the April low to peak A is viewed as an impulse, then the decline A → F is approaching $640, corresponding to the 50% Fibonacci retracement level. Given the above, it is reasonable to assume that the market will now reassess the new factors revealed in the report. From a charting standpoint, this could mean a period of consolidation, with META’s share price fluctuating between the red median line and the current support level of $650. This article represents the opinion of the Companies operating under the FXOpen brand only. It is not to be construed as an offer, solicitation, or recommendation with respect to products and services provided by the Companies operating under the FXOpen brand, nor is it to be considered financial advice.
FXOpen
سهام انویدیا (NVDA) رکورد شکست: عبور تاریخی از مرز 200 دلار و راز جهش 500 میلیاردی!
Nvidia (NVDA) Shares Surpass $200 for the First Time Yesterday, Nvidia’s (NVDA) share price climbed above the psychological threshold of $200 for the first time, pushing the company’s market capitalisation close to $5 trillion. Why Are NVDA Shares Rising Today? Several bullish factors are driving Nvidia’s share price higher: → Massive order backlog: The company reported pre-orders for its AI processors totalling an astonishing $500 billion. → Strategic partnership with the US government: CEO Jensen Huang announced plans to build seven AI supercomputers for the US Department of Energy. → Expansion into telecoms: Nvidia has invested $1 billion in Nokia, acquiring a 2.9% stake in the Finnish company to jointly develop AI-RAN and 6G technologies. Technical Analysis of Nvidia (NVDA) Back on 23 September, our analysis of the NVDA chart identified: → an upward channel outlining the stock’s price movements this autumn; → a breakout from a Bullish Flag pattern (shown in red); → a projection that strong fundamentals, the rapid advance of AI technology, and expectations of a Fed rate cut could enable bulls to overcome the $183 resistance level and target the psychological $200 mark. That projection has materialised since: → the Bullish Flag breakout level has acted as support (marked with a bold blue line); → NVDA price swings have provided anchor points to refine the current channel. What’s Next for Nvidia Shares? Note the bullish gaps (highlighted by arrows) that indicate a demand imbalance. The rapidly strengthening upward momentum could drive NVDA’s share price towards the upper boundary of the channel, particularly as several major events approach today: → the Federal Reserve’s interest rate decision and subsequent press conference; → quarterly earnings releases from Microsoft (MSFT), Alphabet (GOOGL), and Meta Platforms (META), all of which are expected to reaffirm their commitment to AI development. This article represents the opinion of the Companies operating under the FXOpen brand only. It is not to be construed as an offer, solicitation, or recommendation with respect to products and services provided by the Companies operating under the FXOpen brand, nor is it to be considered financial advice.
Disclaimer
Any content and materials included in Sahmeto's website and official communication channels are a compilation of personal opinions and analyses and are not binding. They do not constitute any recommendation for buying, selling, entering or exiting the stock market and cryptocurrency market. Also, all news and analyses included in the website and channels are merely republished information from official and unofficial domestic and foreign sources, and it is obvious that users of the said content are responsible for following up and ensuring the authenticity and accuracy of the materials. Therefore, while disclaiming responsibility, it is declared that the responsibility for any decision-making, action, and potential profit and loss in the capital market and cryptocurrency market lies with the trader.