
FXOnTop
@t_FXOnTop

What symbols does the trader recommend buying?
Purchase History
پیام های تریدر
Filter
FXOnTop
ETH/USD – Short from Resistance

Hi traders ! , I opened a short position on ETH/USD as price is hitting a strong resistance zone. Entry: 3850 SL: 4084.46 TP: 3638.94 📌 Why I took this trade: Price is testing a strong resistance zone around 3860, RSI is overbought, and we could see a pullback toward the support area around 3640. Nice risk/reward setup, keeping it simple. This is just my analysis, not financial advice. What’s your view — drop or breakout?
FXOnTop
Clean BTC Trade – Bounce from Key Trendline Support

Hi traders! , Analyzing BTC/USD on the 30-minute timeframe, we can observe that price is respecting the ascending channel and reacting to the dynamic trendline support (blue line). This bounce, aligned with prior structure, signals a potential bullish continuation. 🔹 Entry: 116,249 🔹 Take Profit (TP): 119,434 🔹 Stop Loss (SL): 113,105 Price remains above the 200 EMA and respecting the trendline. RSI shows bullish divergence, suggesting upward momentum. Strong reaction from the P-level (pivot point) at 115,373. Bullish engulfing candle printed near the blue trendline. This long setup presents a favorable risk/reward ratio within the context of the broader trend. Targeting a clean break above previous resistance and return to the R1 zone. ⚠️ DISCLAIMER: This is not financial advice. Trade at your own risk and always use proper risk management
FXOnTop
Bitcoin on Fire: Targeting $110K in Relentless Uptrend!

Hi traders! , Analyzing BTC/USD on the 30 minute timeframe, price is currently respecting an upward channel and showing consistent higher highs and higher lows. The recent bounce from dynamic support suggests bullish continuation.🔹 Entry: 109,545🔹 Take Profit (TP): 110,612🔹 Stop Loss (SL): 108,438Price is trading above both the 50 and 200 EMA, confirming bullish momentum. The RSI remains above the midline, indicating buyers are still in control. This long setup offers a favorable risk-reward ratio within the context of the broader uptrend.A confirmed breakout from the short-term resistance, combined with trendline support and channel structure, adds confluence to this idea. Watch for potential resistance near the 110,612 zone.⚠️ DISCLAIMER: This is not financial advice. Every trader is responsible for their own decisions and risk management.On Fire 🔥
FXOnTop
SOL/USD in Clear Downtrend – Short Setup in Play

Hi traders! , Analyzing SOL/USD on the 30-minute timeframe, price is currently moving within a defined descending channel, respecting lower highs and lower lows. A recent rejection from the channel top suggests continuation to the downside.🔹 Entry: 150.09🔹 Take Profit (TP): 145.47🔹 Stop Loss (SL): 154.51The price failed to hold above the 200 EMA and has resumed its downward trajectory. The RSI shows a recent bounce from overbought levels, supporting the bearish momentum. This short setup offers a favorable risk-reward ratio within the context of the broader downtrend.A clean rejection at resistance and confirmation of the trendline add confluence to this trade idea. Keep an eye on the 145.47 zone, where buyers may attempt to defend the support.⚠️ DISCLAIMER: This is not financial advice. Every trader is responsible for their own decisions and risk management.😔
FXOnTop
Is Gold (XAU/USD) Ready to Bounce? Bullish Setup on Key Trendlin

Hi traders! , Analyzing XAU/USD on the 1H timeframe, price is currently bouncing off a long-term ascending trendline, showing signs of a potential bullish continuation: 🔹 Entry: 3318 🔹 Take Profit (TP): 3424 🔹 Stop Loss (SL): 3207 After testing the ascending trendline multiple times, gold is once again showing bullish rejection near support. Price remains above the key trendline and is attempting to form a higher low within the broader uptrend. The RSI is recovering from oversold territory (currently around 49), which suggests weakening selling pressure and possible buildup of bullish momentum. If the structure holds, the target at 3424 aligns with a previous resistance area and a natural extension of the upward channel. The risk-reward is favorable with a strong technical confluence backing the setup. ⚠️ DISCLAIMER: This is not financial advice. Every trader is responsible for managing their own risk and strategy.ensuring profits
FXOnTop
Is ETH Heading to $2800? Strategic Entry in Bullish Trend

Hi traders! , Analyzing ETH/USD on the 2H timeframe, price is respecting an ascending trendline and showing signs of continuation within the bullish structure:🔹 Entry: 2555🔹 Take Profit : 2831🔹 Stop Loss : 2234After consolidating above key support and retesting the ascending trendline, ETH is showing potential for a bullish continuation. The recent bounce is forming higher lows, and price remains above the 50 EMA, suggesting buyers are maintaining control.RSI is currently turning upward from the mid-zone, signaling growing bullish momentum while still avoiding overbought conditions. The trendline has been respected several times, adding confluence to the setup.If momentum holds, the TP around 2831 lines up with a significant resistance area from previous structure — a logical zone for price to reach in the short term.⚠️ DISCLAIMER: This is not financial advice. Every trader is responsible for managing their own risk and strategy.Secured partials SL at break-even🔥
FXOnTop
BTC at Critical Resistance… Drop Incoming!

Hi traders! Currently analyzing BTCUSD on the 1H timeframe.Price is reacting to the upper boundary of a descending channel, where sellers are showing strong pressure. This area has previously acted as a significant resistance, pushing price lower multiple times.I'm now selling from 108,075.19, expecting a bearish move towards my target at the bottom of the channel.Take Profit: 104,493.63Stop Loss: 111,891.49RSI is showing signs of bearish divergence near the resistance area, adding confluence to this setup.Price may have performed a liquidity grab above the trendline before rejecting the area, which aligns with the current market structure.I'm actively managing this trade, keeping an eye on how price behaves around this key level.Disclaimer: This is not financial advice. This is my personal analysis shared for educational purposes only.Securing profits
FXOnTop
Catching the Perfect Rebound on XAUUSD!

Hi traders! , Currently analyzing GOLD (XAUUSD) on the 1H timeframe.Price has dropped aggressively but is now reacting strongly from a key support zone around 3,271.00, where buyers are stepping in. This area has previously shown significant bullish reactions.I'm now buying from 3,271.00, expecting a bullish correction towards my target.Take Profit: 3,377.00Stop Loss: 3,165.00RSI is in oversold, indicating potential exhaustion of sellers.Price may have created a fake breakout below the trendline, trapping liquidity before bouncing back.Currently managing the trade, watching how price develops around this key area.Disclaimer : This is not financial advice. This is my personal analysis shared for educational purposes only.Securing profits
FXOnTop
GOLD Bears in Control? Potential Short Setup!
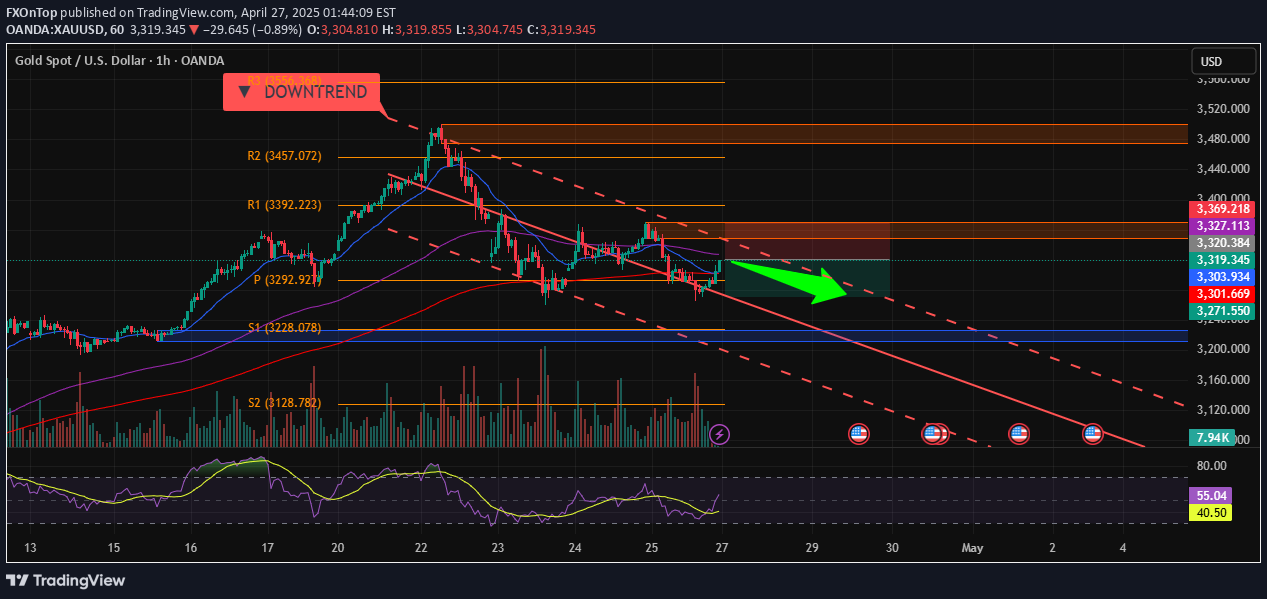
Hi traders! Analyzing XAU/USD on the 1H timeframe, price is rejecting from a key resistance inside the descending channel.🔹 Entry: 3,318🔹 TP: 3,271🔹 SL: 3,369Gold is respecting the upper trendline of the downtrend channel, and momentum remains weak. After a small bounce, sellers have stepped in again, suggesting a possible continuation to the downside.RSI remains below the 50 mark, favoring bearish pressure. A break below 3,300 could confirm acceleration towards the target zone at 3,271.Watching closely for bearish continuation signals!⚠️ DISCLAIMER: This is not financial advice. Every trader must evaluate their own risk and strategy.🔥
FXOnTop
Bulls Warming Up! BTC Aiming Higher – Are You Ready?

Hi traders! Analyzing BTC/USD on the 1H timeframe, price is moving within a rising channel and finding support at key EMA levels.🔹 Entry: 94,115🔹 TP: 96,005🔹 SL: 92,225BTC is holding above the 100 EMA and respecting the lower boundary of the ascending channel. As long as price stays above 93,300, the bullish structure remains intact, pointing towards a potential move to the 96,000 area.Volume remains stable, and the trend detector continues to signal a bullish bias. A break and close above 94,400 would strengthen the bullish momentum!Watching closely for a confirmation of strength!⚠️ DISCLAIMER: This is not financial advice. Every trader must evaluate their own risk and strategy.🔥
Disclaimer
Any content and materials included in Sahmeto's website and official communication channels are a compilation of personal opinions and analyses and are not binding. They do not constitute any recommendation for buying, selling, entering or exiting the stock market and cryptocurrency market. Also, all news and analyses included in the website and channels are merely republished information from official and unofficial domestic and foreign sources, and it is obvious that users of the said content are responsible for following up and ensuring the authenticity and accuracy of the materials. Therefore, while disclaiming responsibility, it is declared that the responsibility for any decision-making, action, and potential profit and loss in the capital market and cryptocurrency market lies with the trader.