
FTT_TRADER369
@t_FTT_TRADER369

What symbols does the trader recommend buying?
Purchase History
پیام های تریدر
Filter
FTT_TRADER369
Santos pump
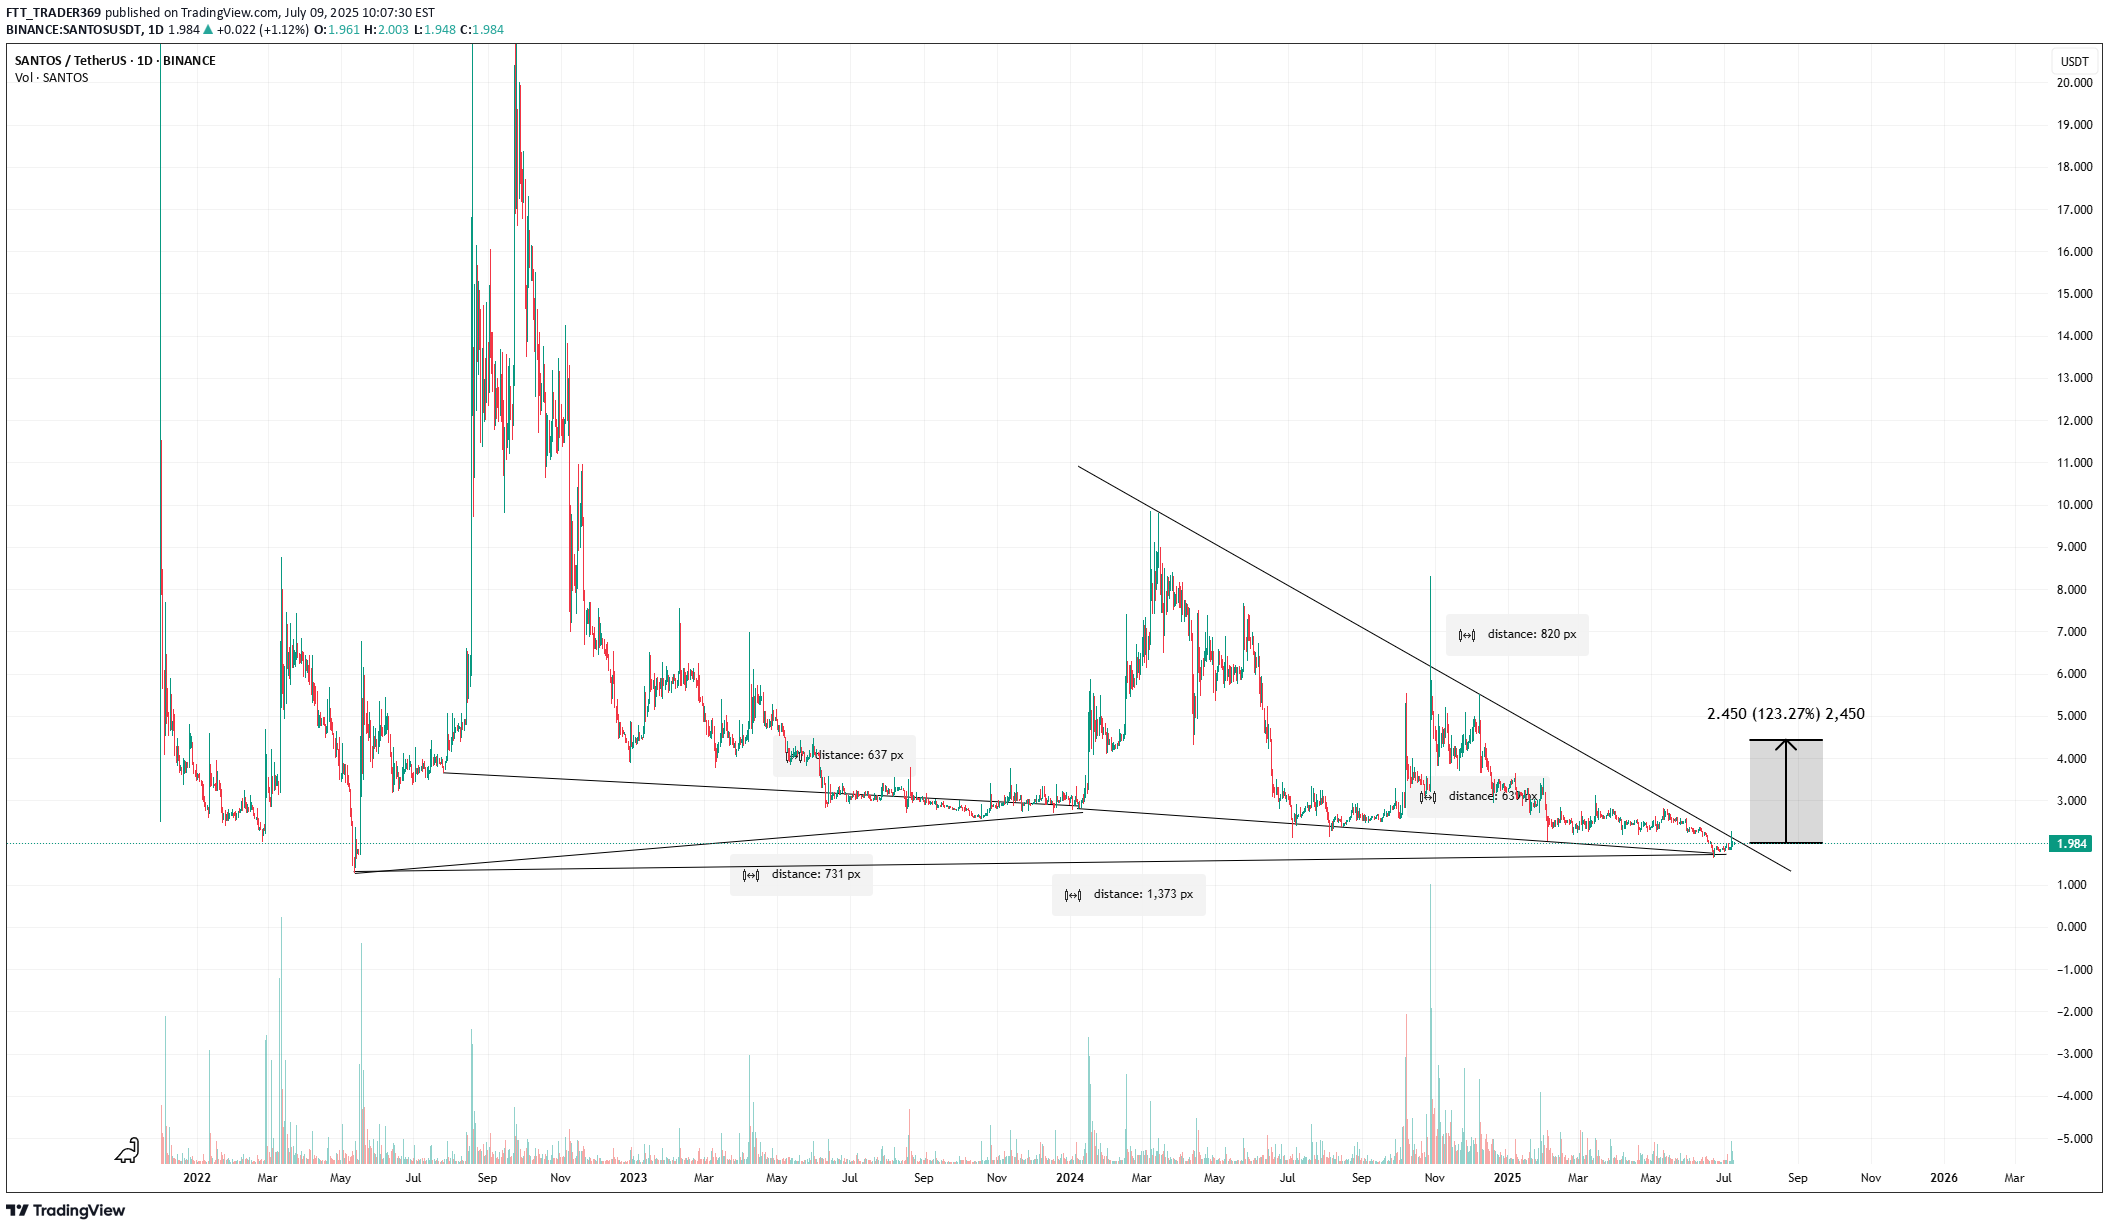
Numerology, as well as testing of an important level, is where altcoin pumps often occur very strongly. I am already entering the trade.
FTT_TRADER369
BTC BIG SHORT!
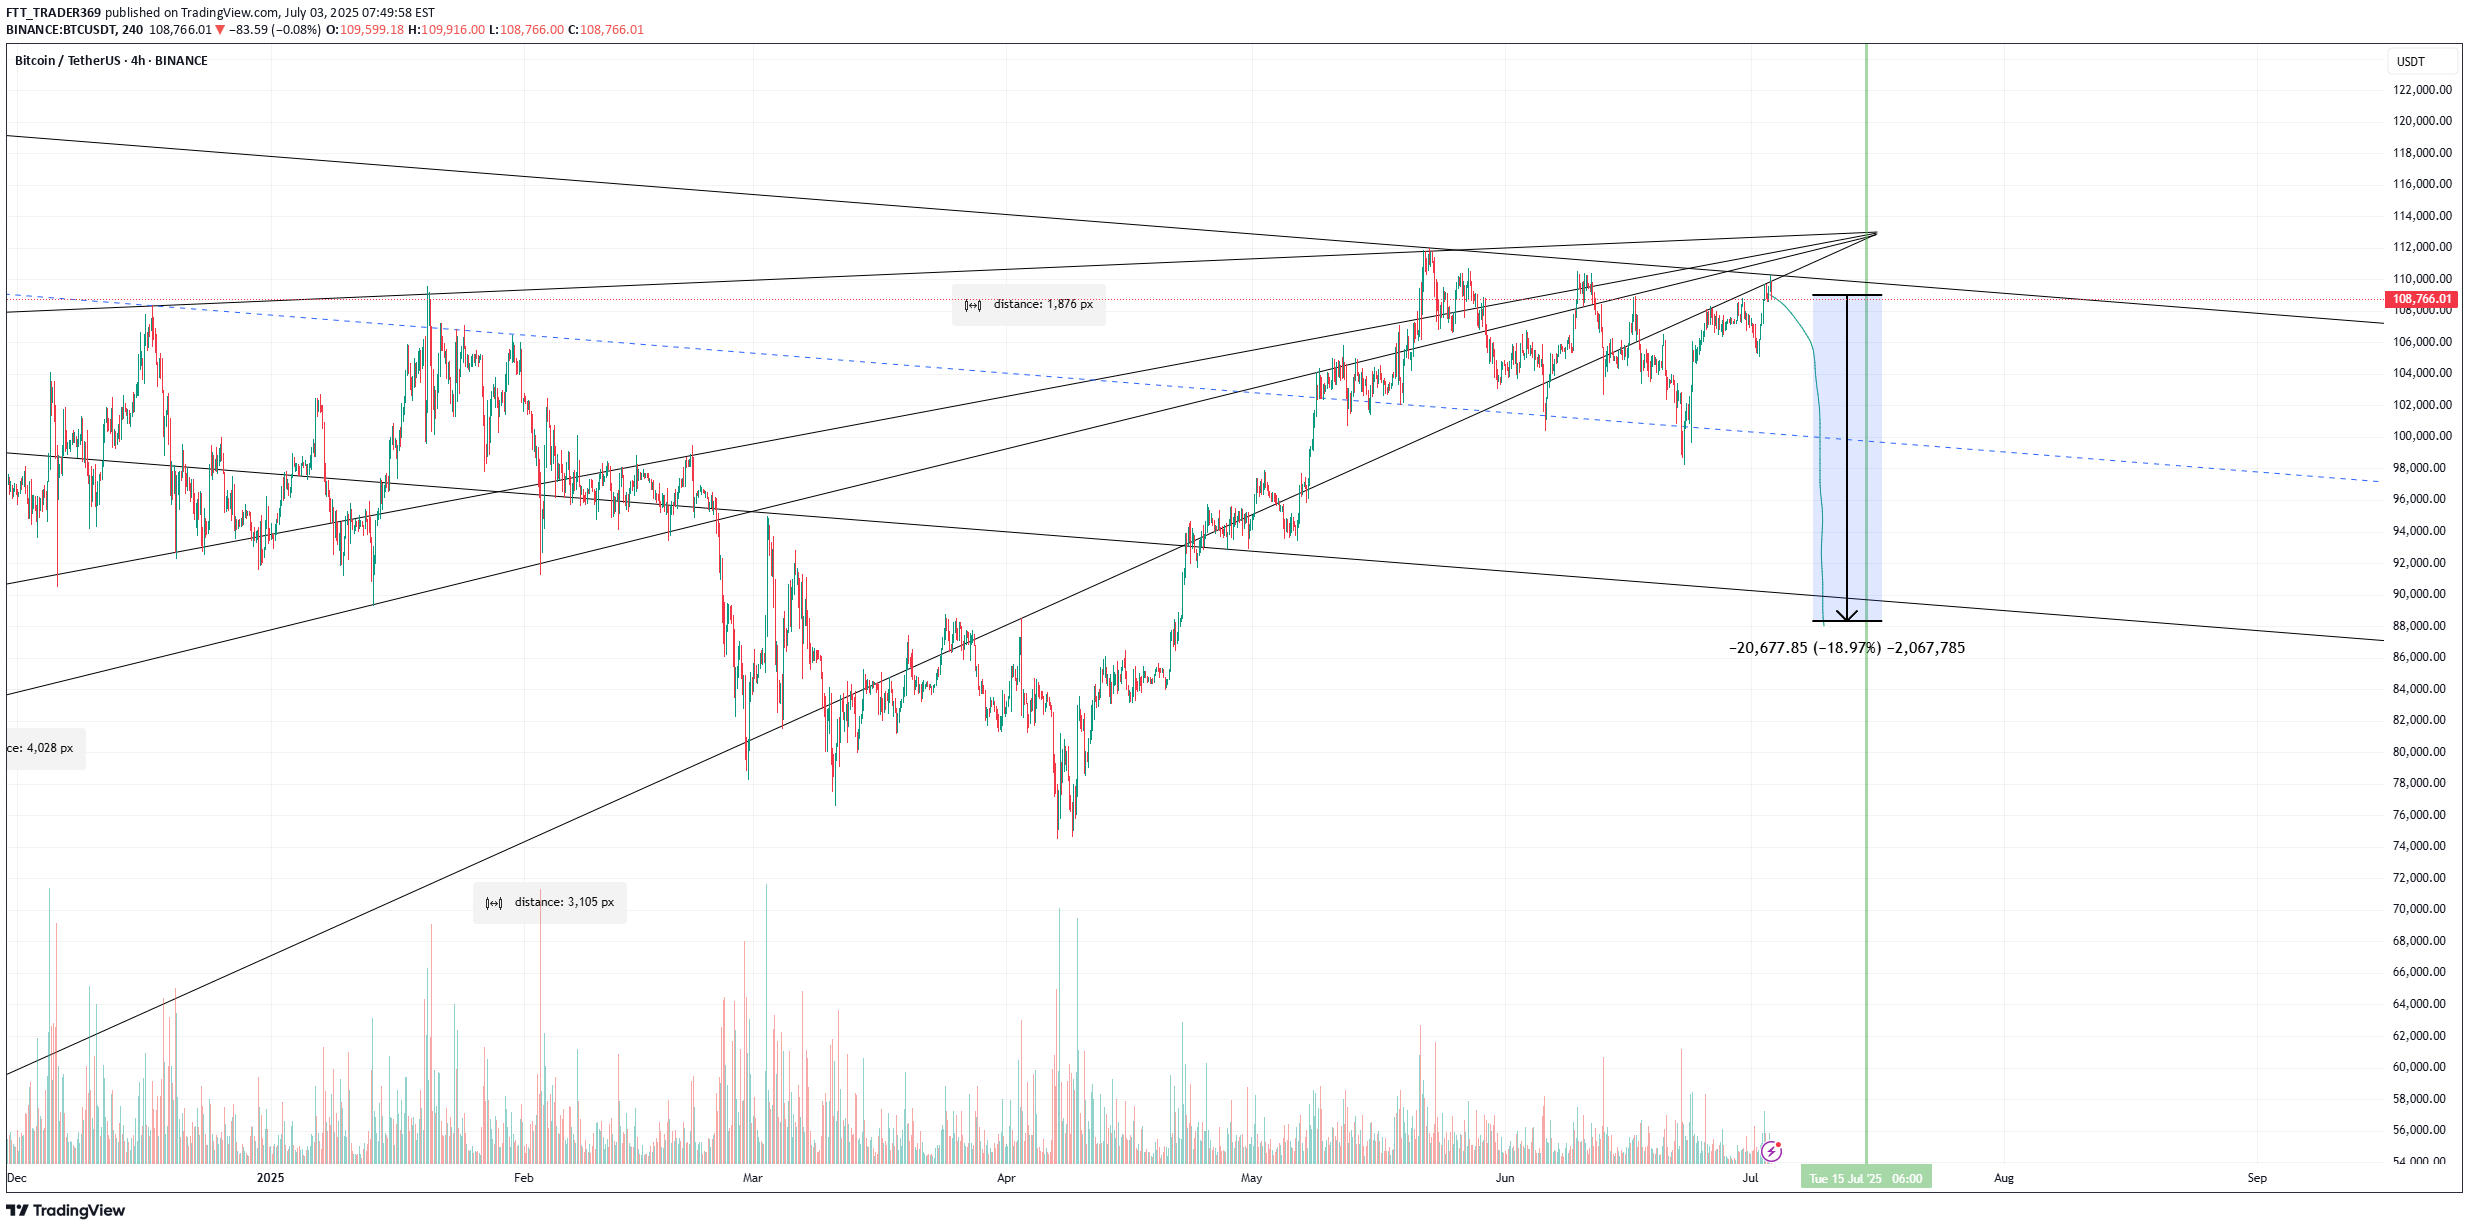
We did a mirror retest, and many other signals also point to a sharp decline, indicating numerological codes 69/96.long now
FTT_TRADER369
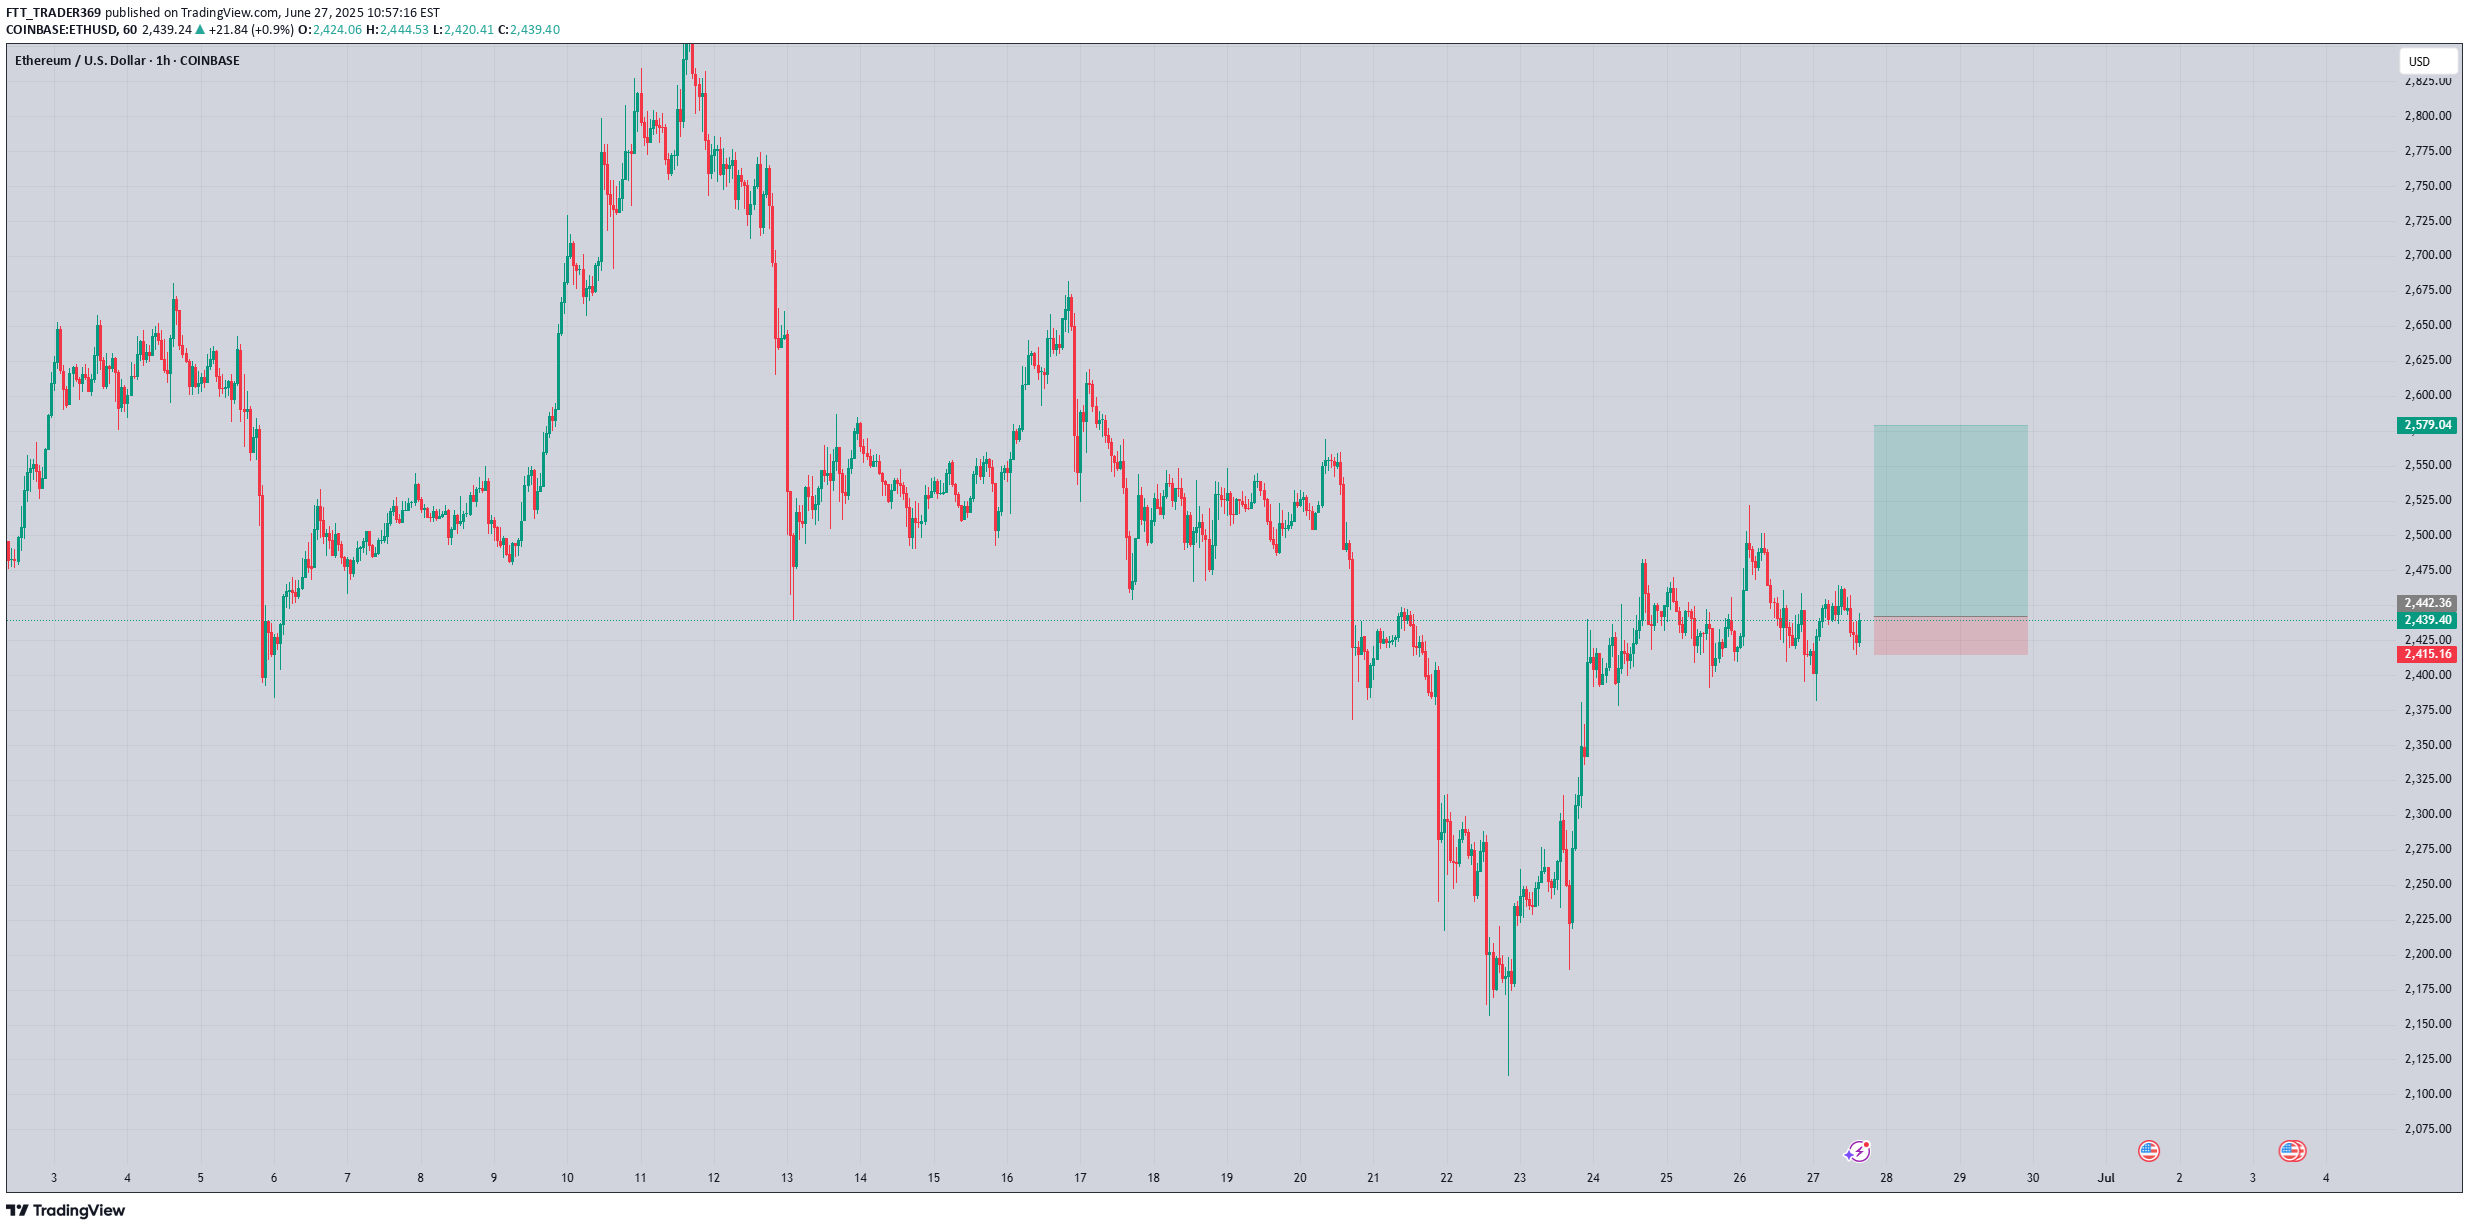
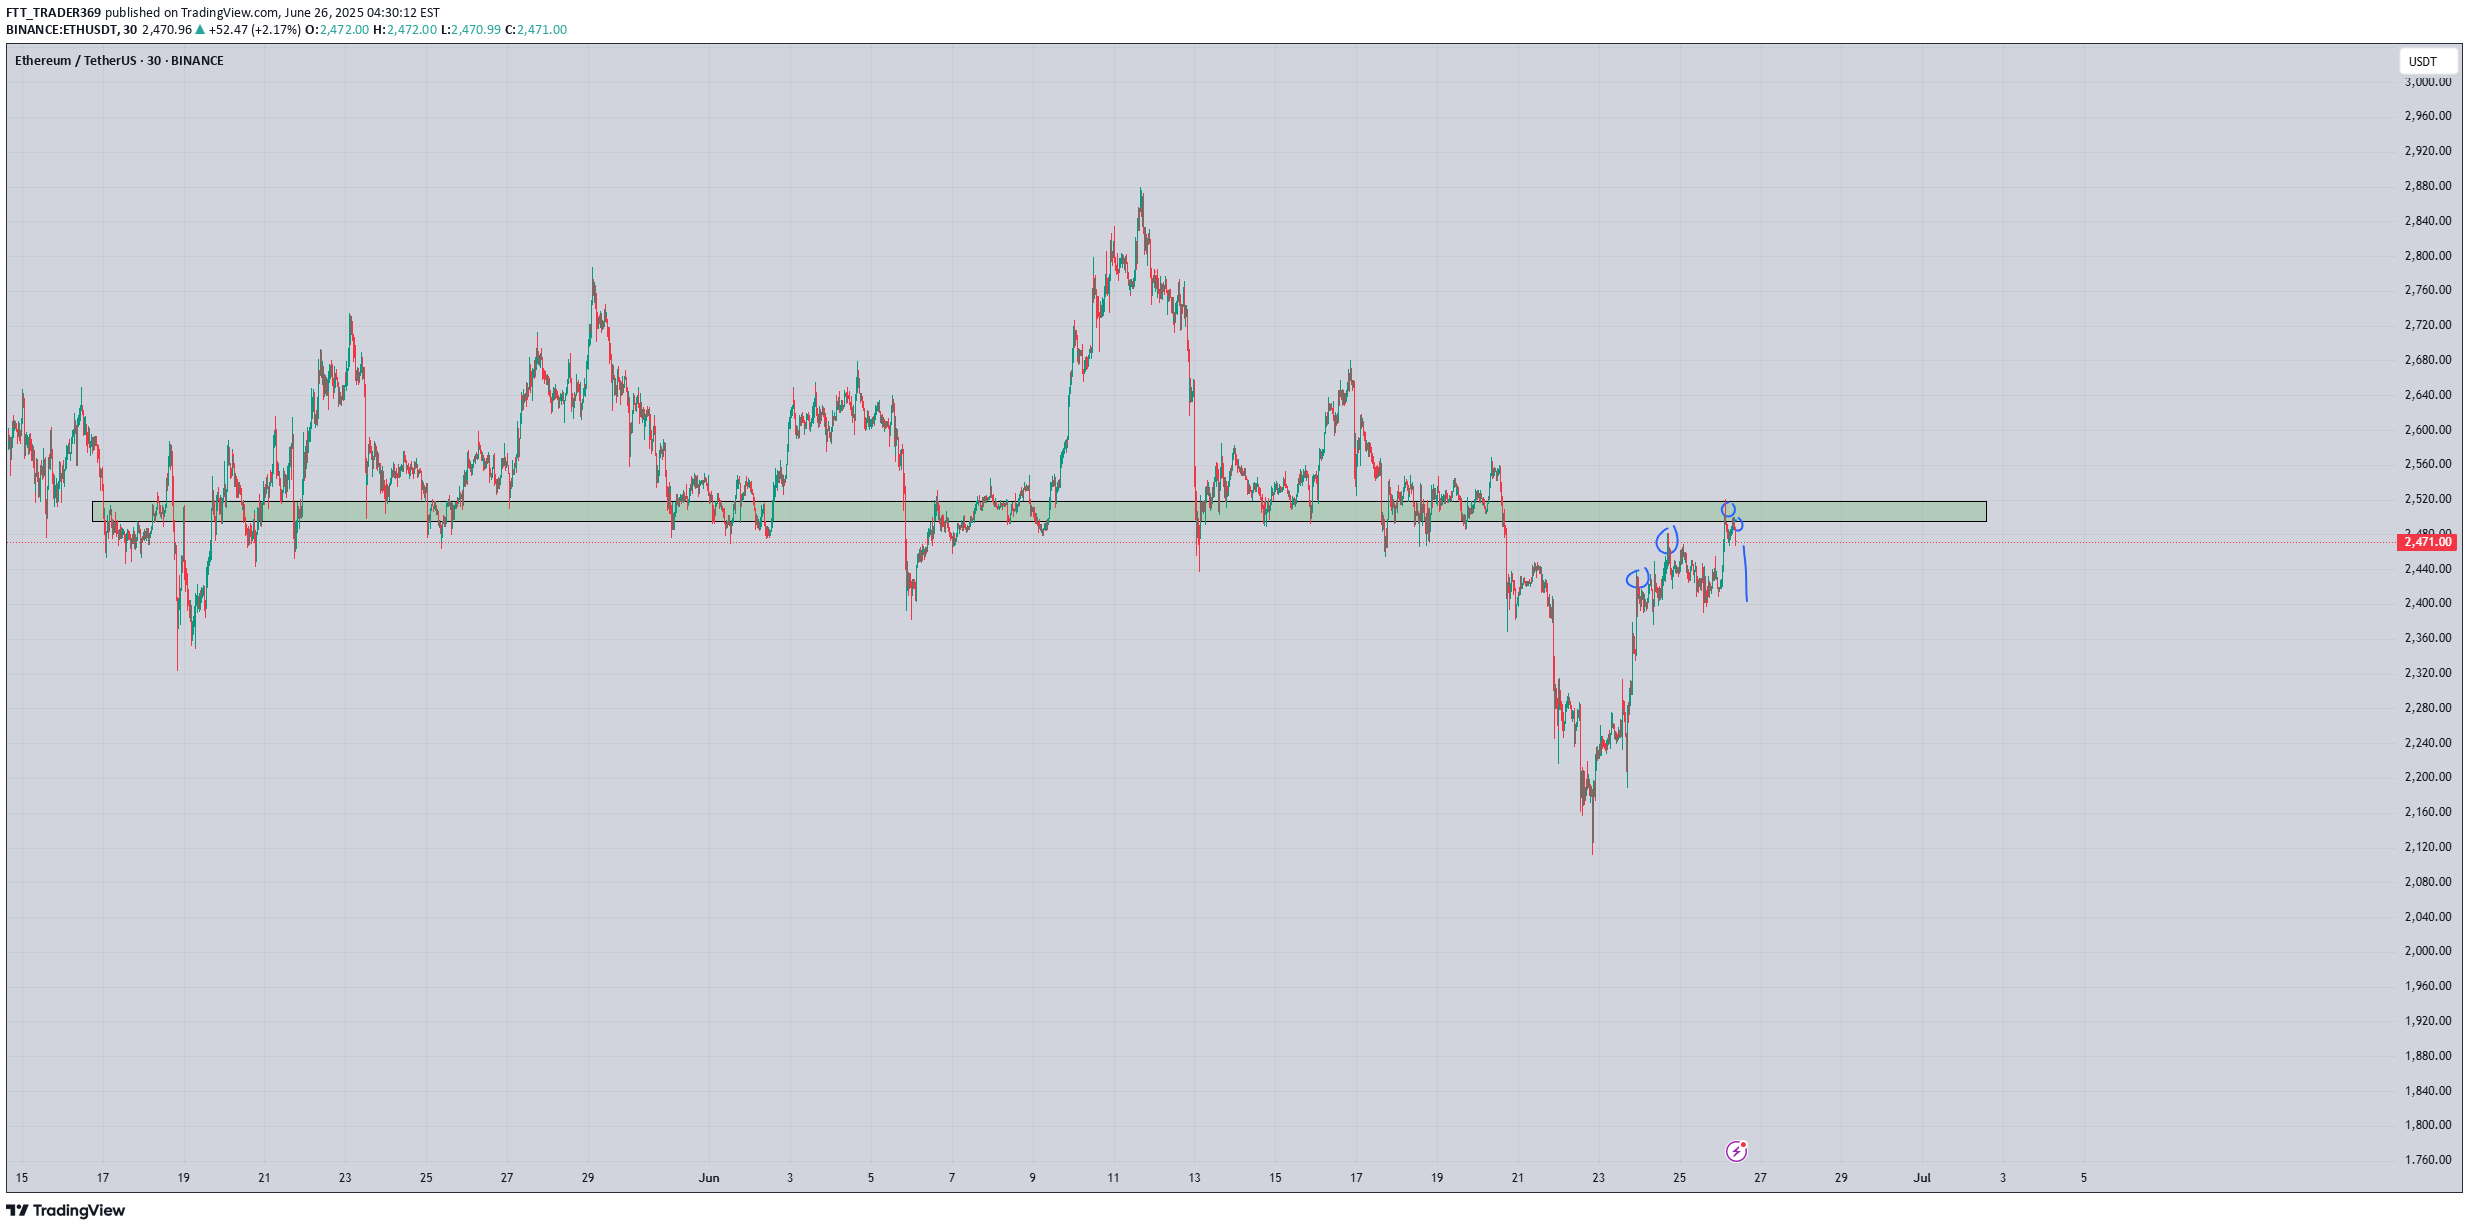
2/6/17 BIG SHORT ETH MEGA DUMP
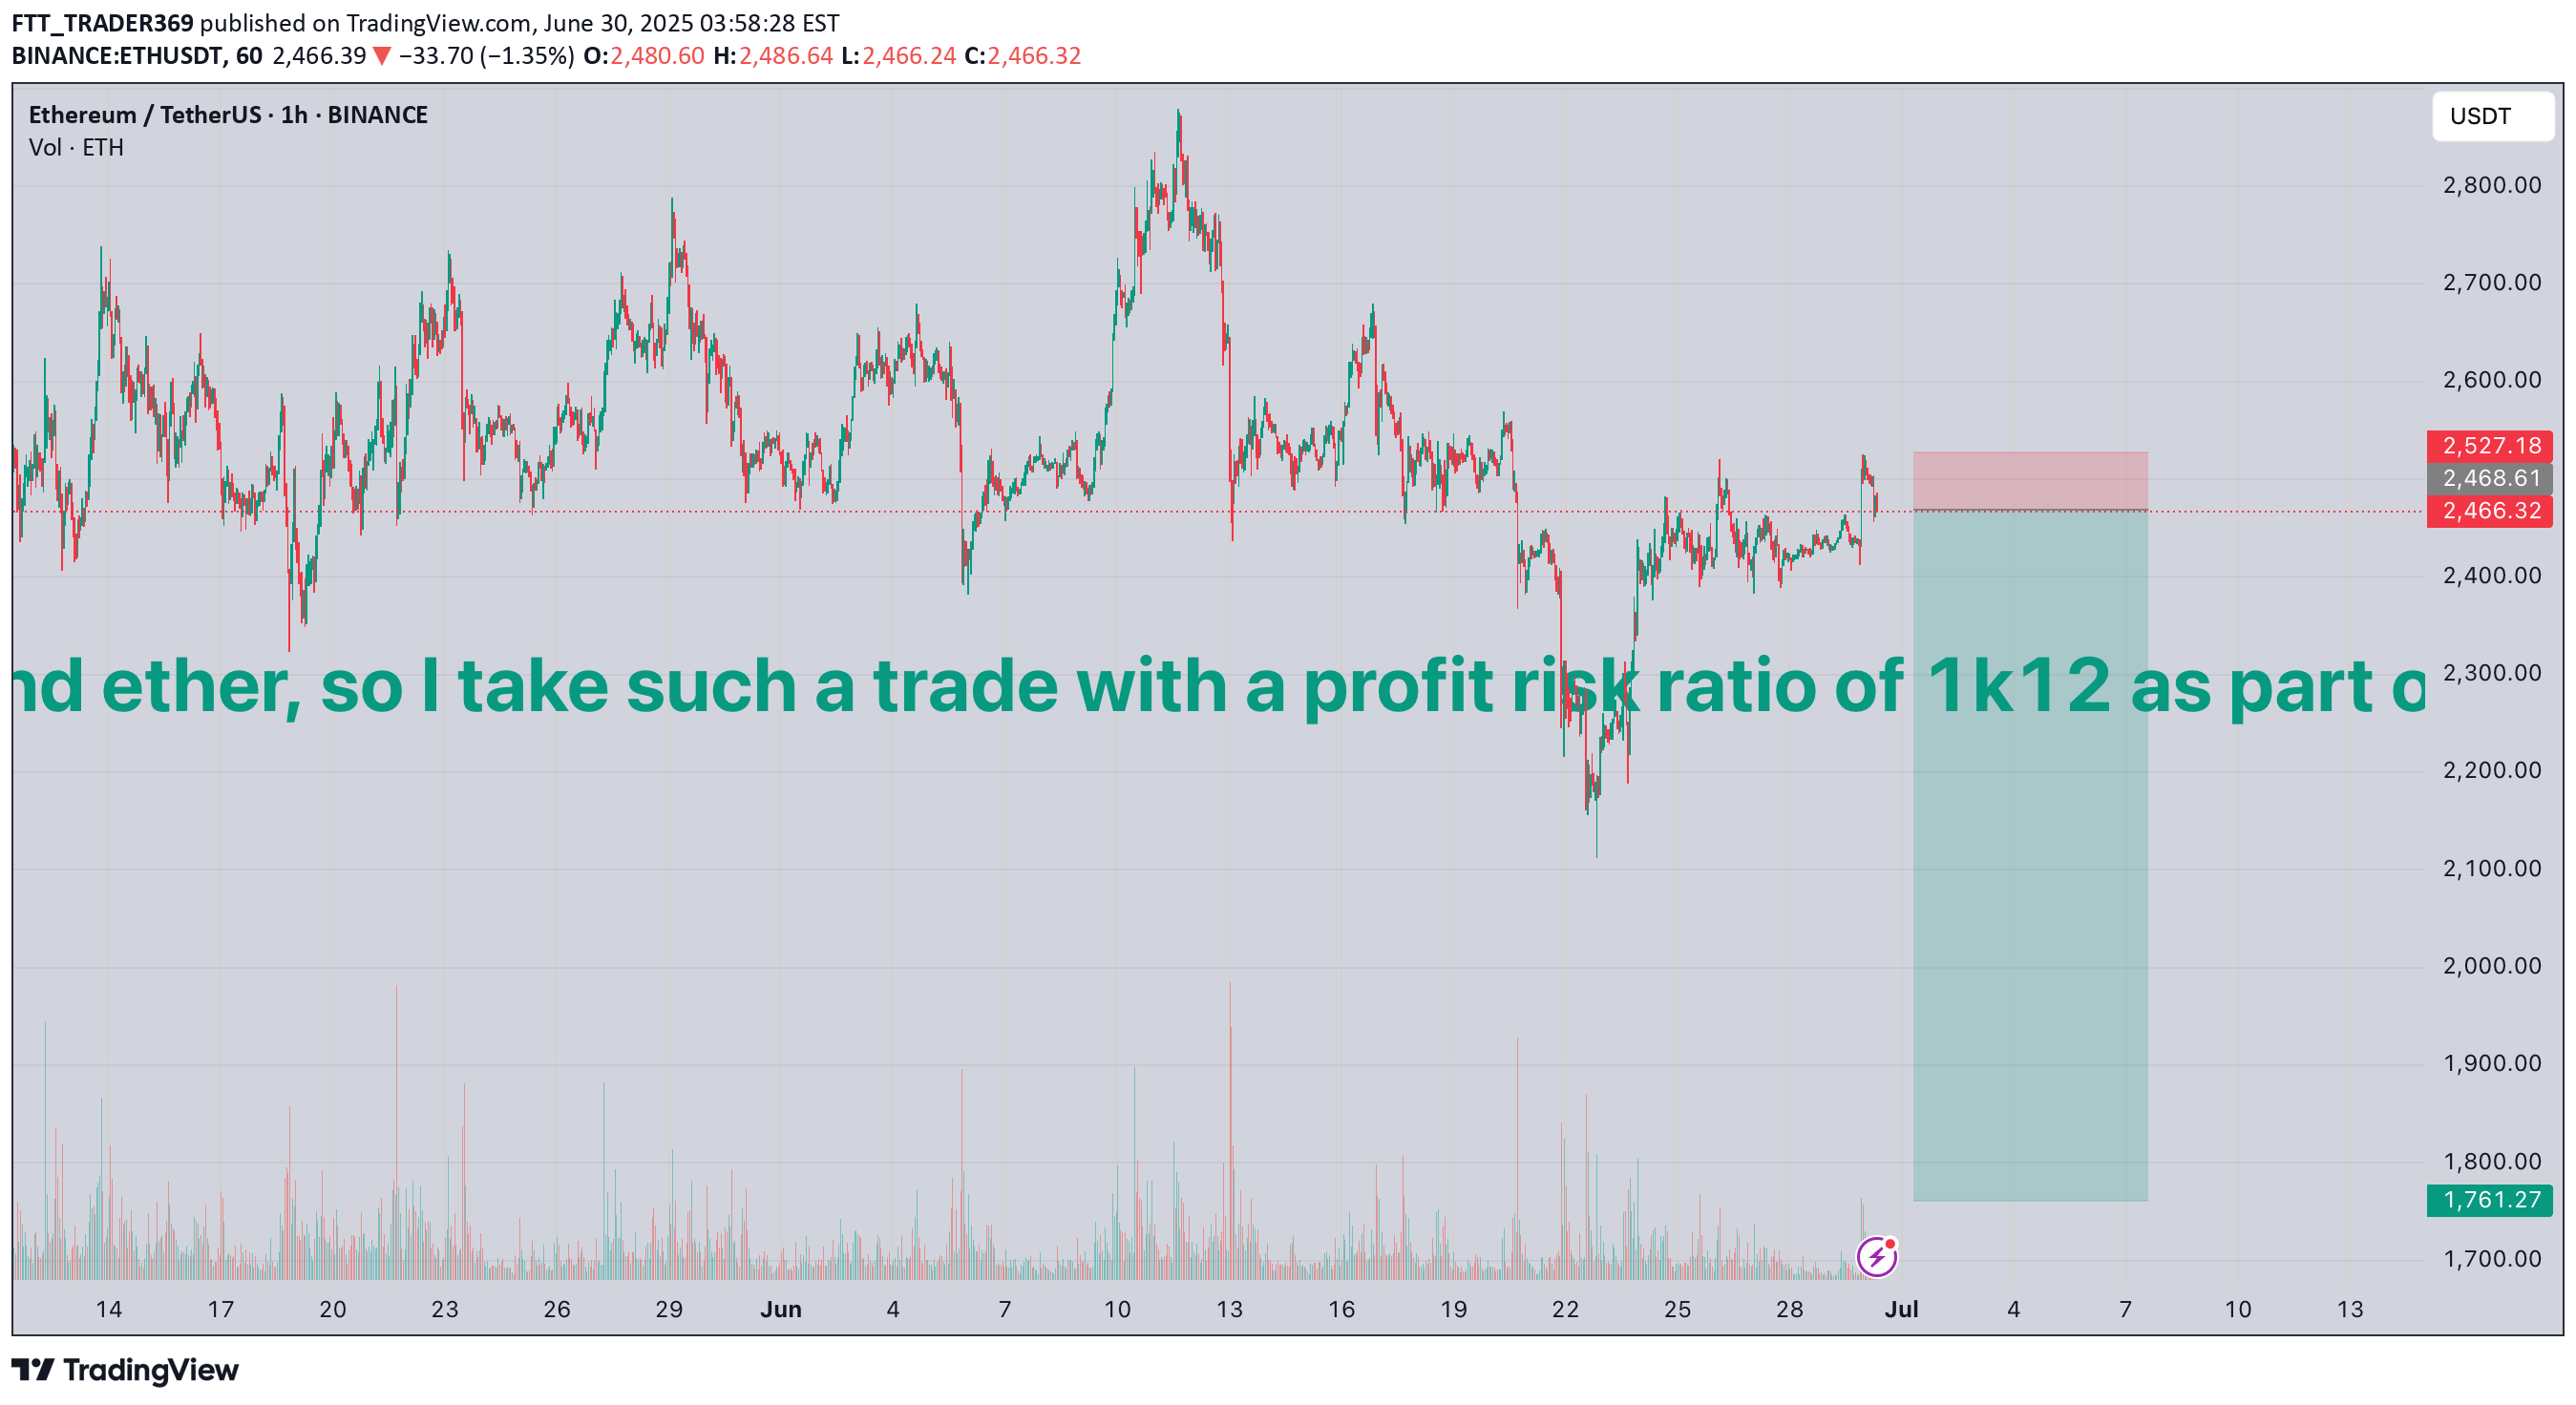
I expect the strongest fall in bitcoin and ether, so I take such a trade with a profit risk ratio of 1k12 as part of a classic pattern stop over the 3 top
FTT_TRADER369
2/1/15
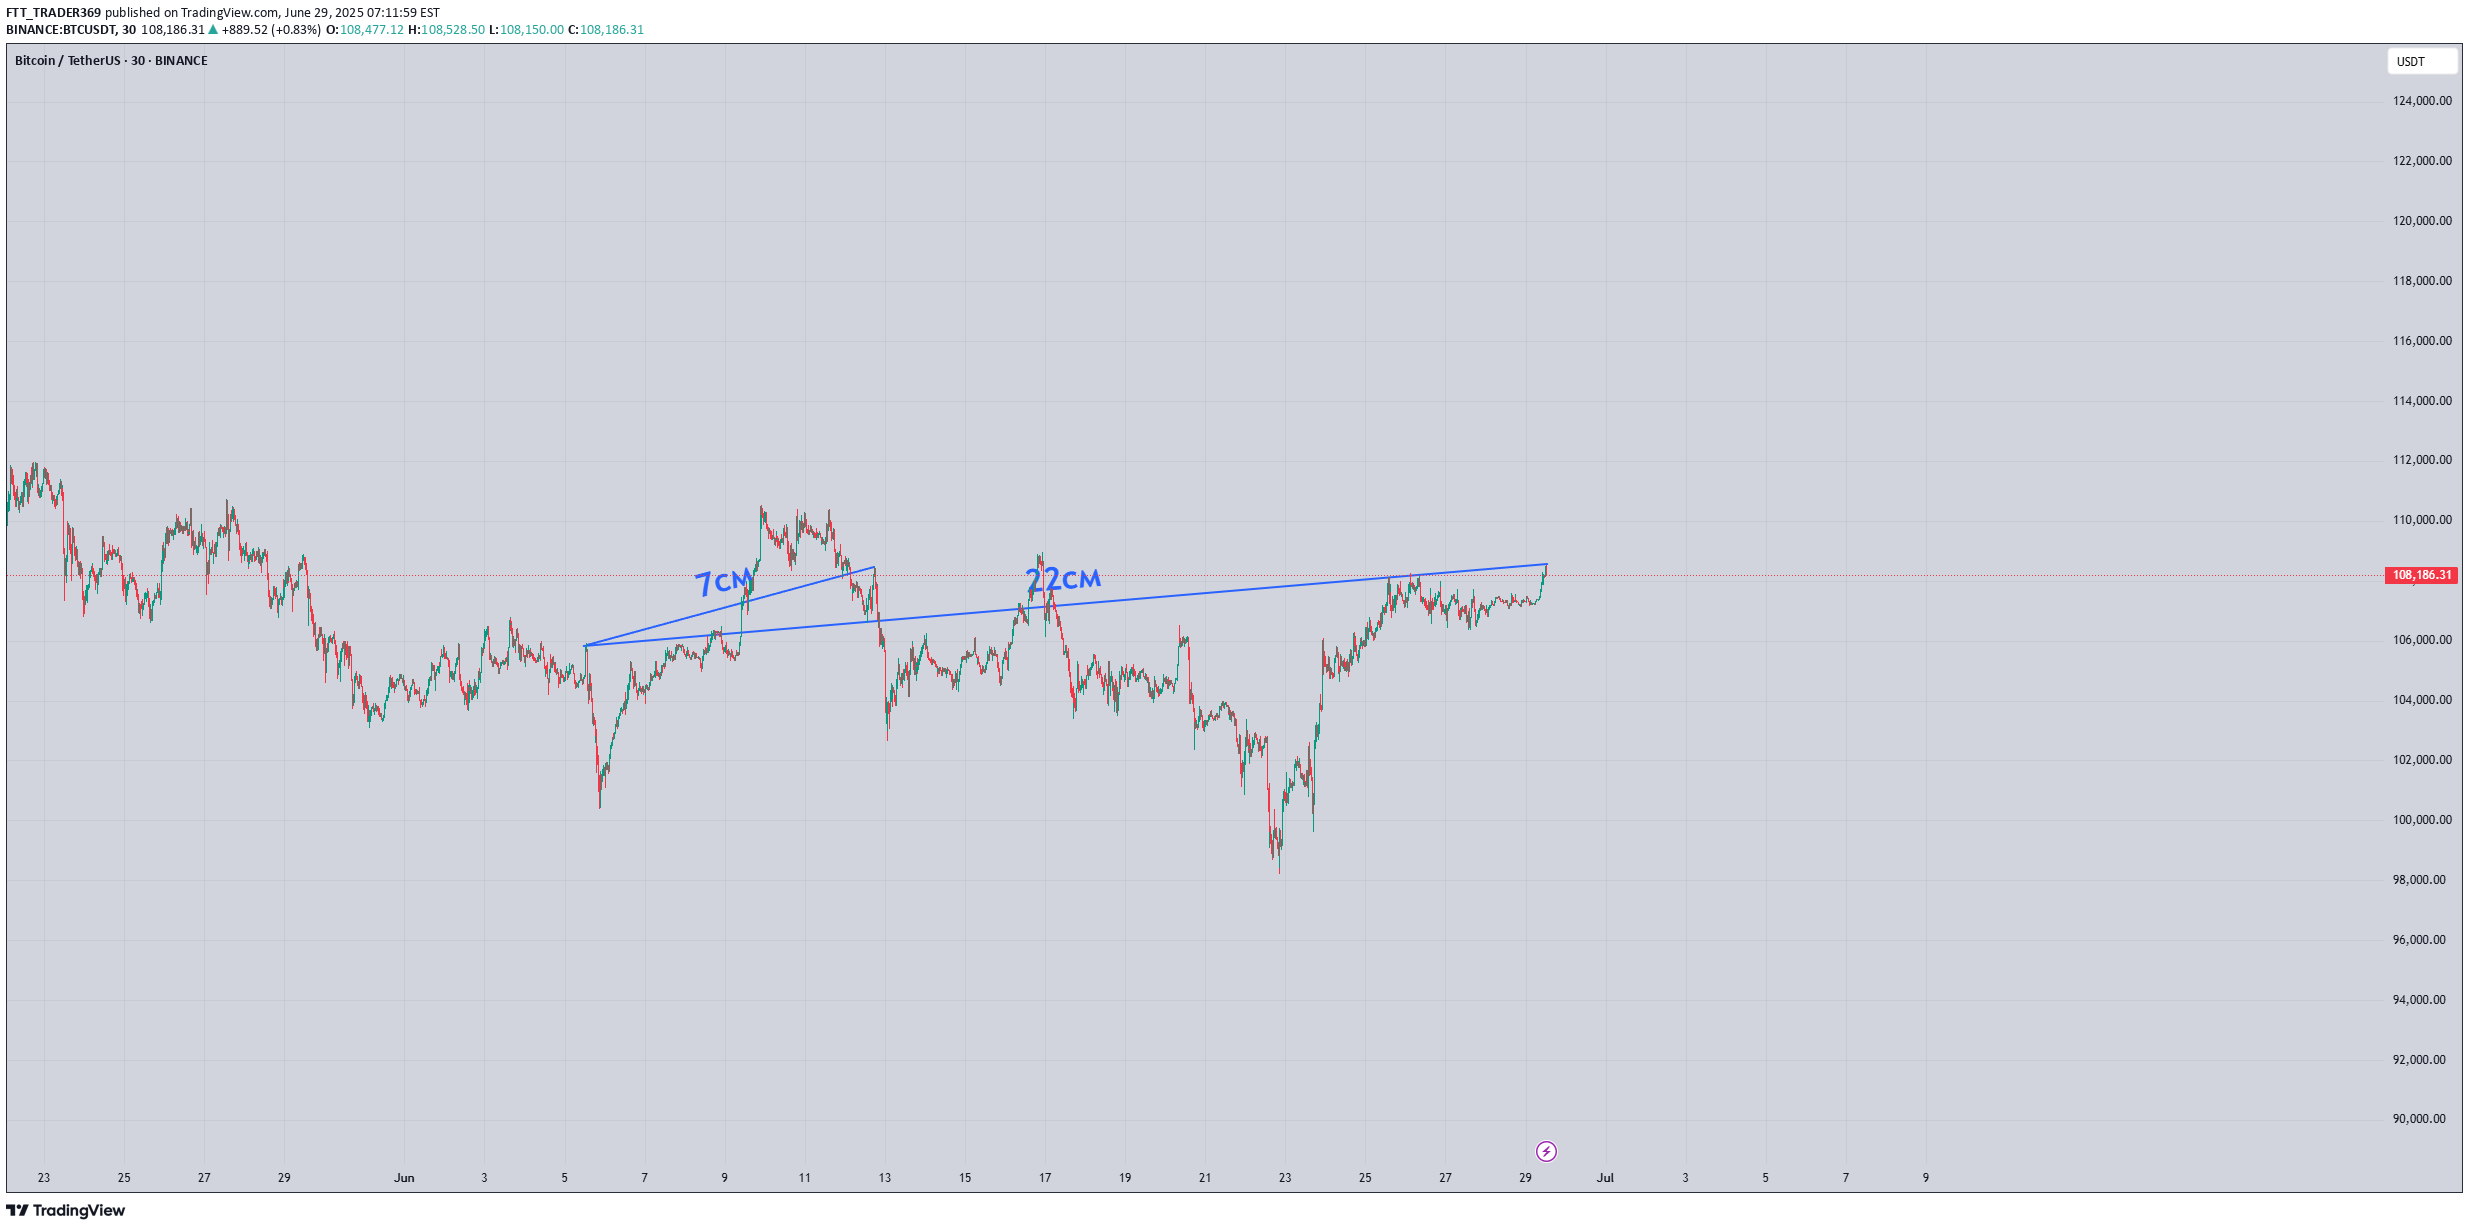
I promised to update the idea of what will happen with the graph in the future. At 22 cm, we should now fall down.
FTT_TRADER369
DOGE - IDEA index to my B/ september pump
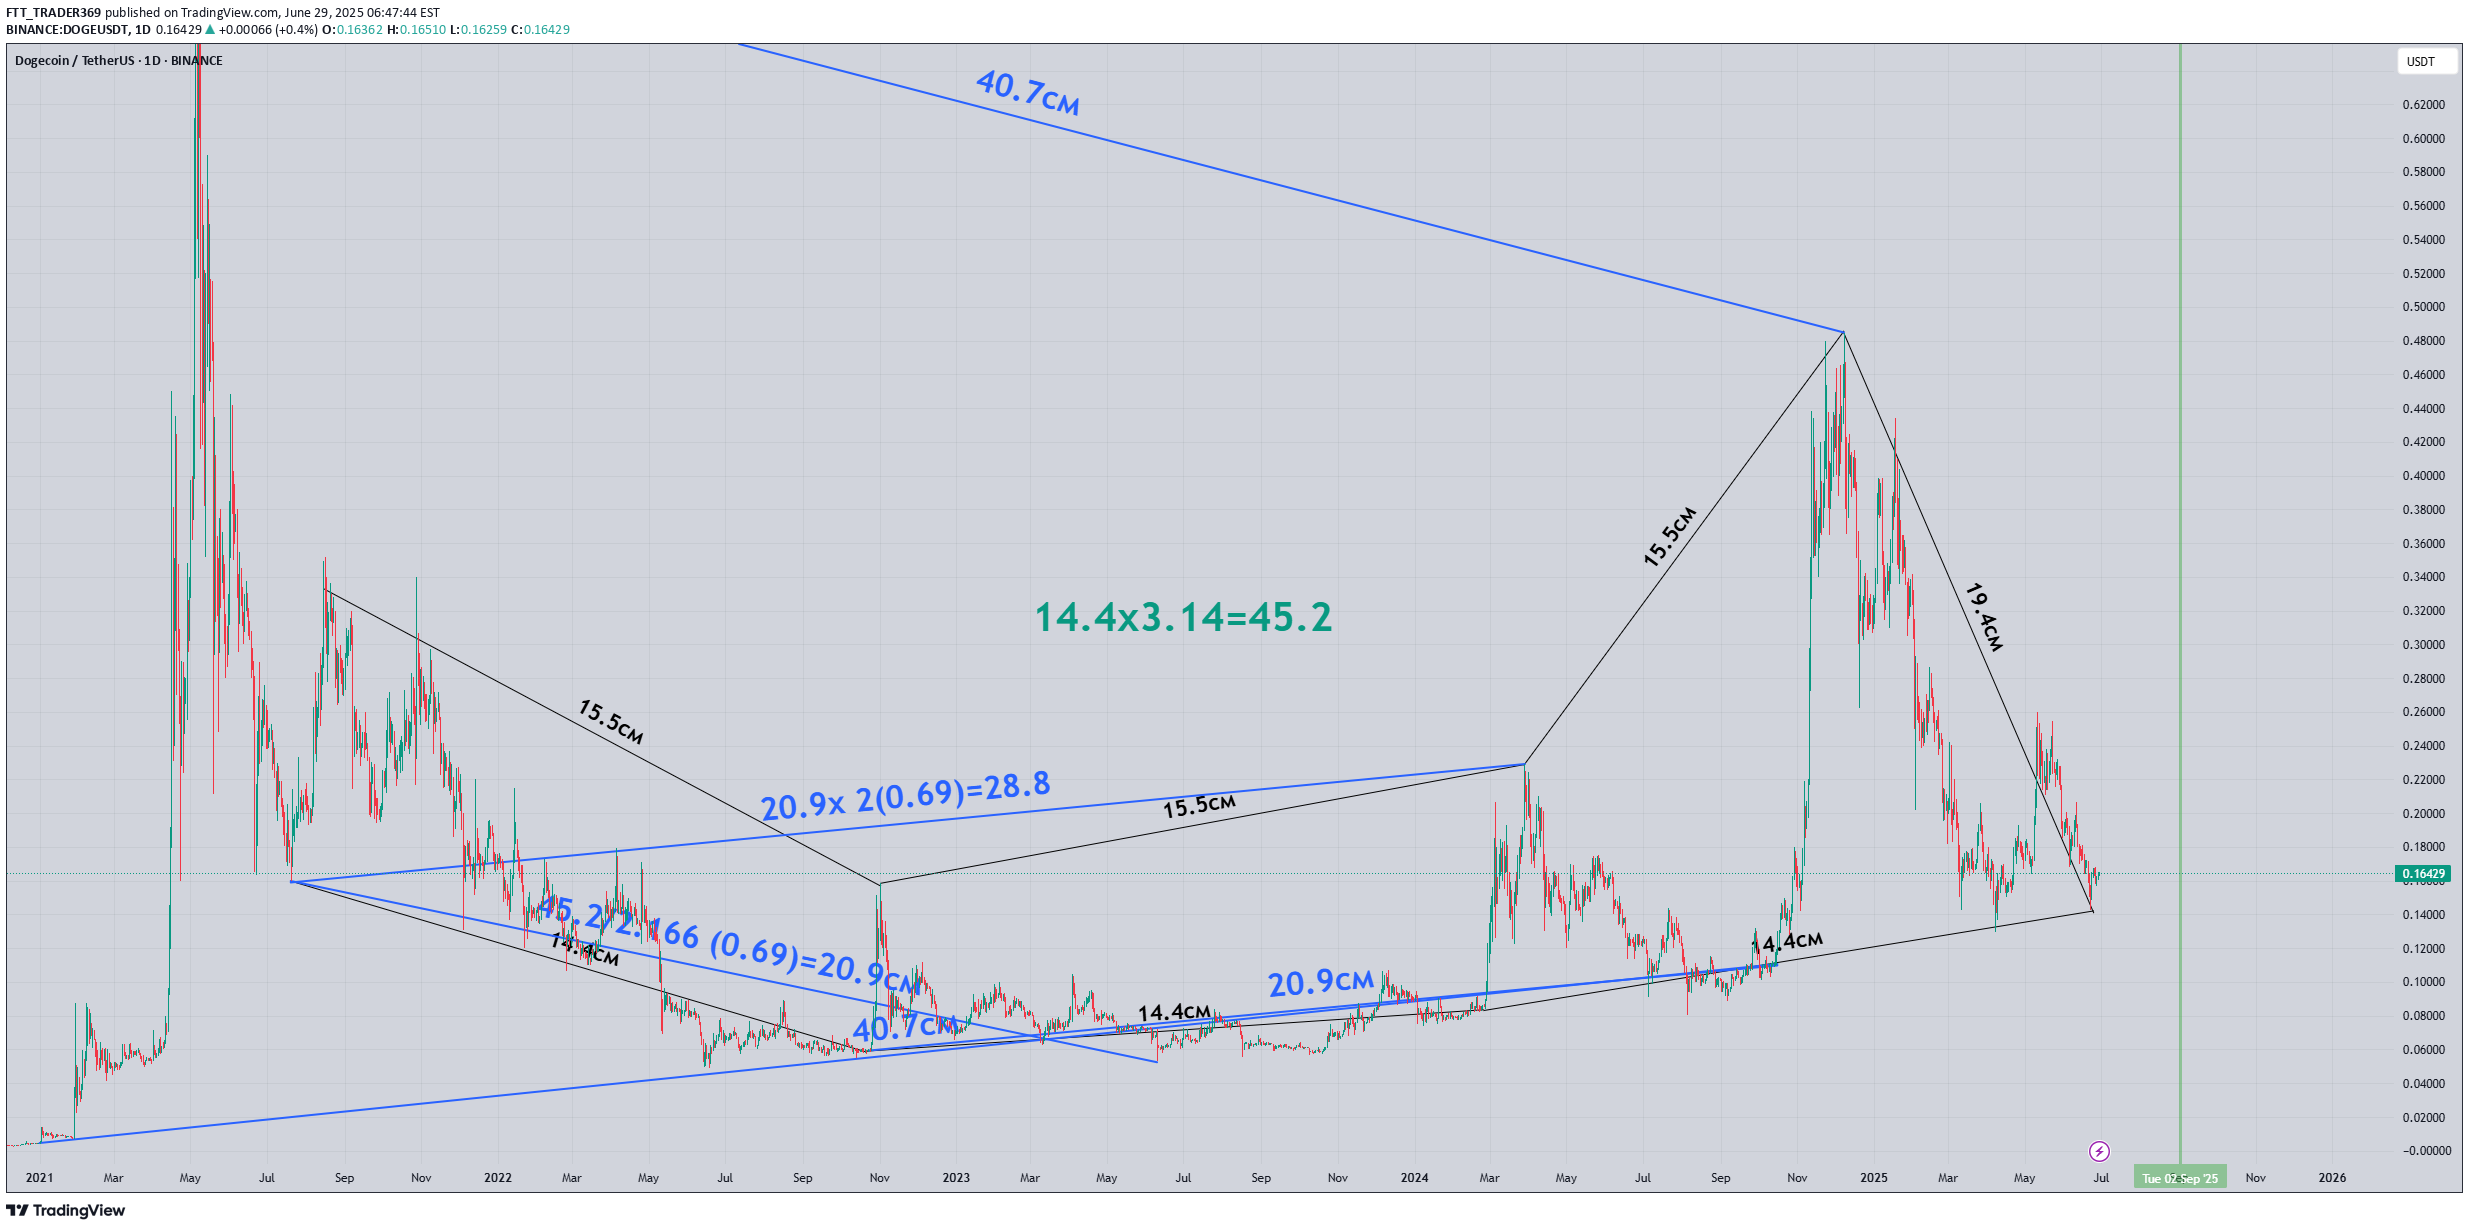
We have an instrument — DOGE — and I see a certain pattern. From one pump zone to the next, it's 14.4 cm, and this happens three times. From the high zone after these pumps, it's 15.5 cm, also three times. From the high at $0.74 to the high at $0.48, we get 40.7 cm. Similarly, from the very first DOGE pump where the mega rally began, there's also a 40.7 cm gap to the next strong pump.After analyzing the old “Sparta” ideaI came to the conclusion that the price is being compressed within a specific range, and after some time, this range gets multiplied by a numerological coefficient. To get 444, you need to multiply 333 by 1.333. But another coefficient close to this value is 0.69 (zone) multiplied by 2, which equals 1.38.On the chart, you can see that from the starting point we have 14.4 cm. If we apply the derived coefficient (0.69) — taken from the length of the circle — we get 20.9 cm. That is, our diameter is 14.4 cm. If we multiply it by Pi (3.14), we get the circumference: 45.2 cm. Then, we need to find the 0.69 zone, which equals 0.69π = 2.166. That means we divide 45.2 by 2.166 and get 20.9 cm. If we measure this from our first control point (from where we took the diameter), we arrive precisely at the bottom from which the trend reversal began.Now, keeping in mind the coefficient that the cycle follows — 1.333 — if it moved exactly, it would be too obvious and there wouldn’t be the necessary chaos on the chart. Since we have more than one cycle, multiplying 0.69 × 2 = 1.38 gives us 28.8 cm, which precisely points to the high formed at $0.23.You might not believe me or understand, but these are facts. I’ve provided you with the chart — you can verify everything yourself.What does this give us?This provides us with valuable information about how the trend develops after the strongest initial pump of the instrument, allowing us to capture all the movements by trading within a channel using complex percentages and taking massive % gains.What do we need to do? Let’s repeat:Study the distance from the lows before the pump to the next low right before the next pump (in cm).Then we carry this same cycle backward to confirm its validity in the past and again forward — that will be the main one from which strong growth begins.From the measured value (in cm), we take it as the diameter and multiply by Pi to get the circumference, which helps us understand what might come in the future.We trade the 0.69 zone or 69%, whichever is easier for you. To find this zone, divide the circumference by 2.166.Then multiply the result by the coefficient 1.333 or 1.38 — this will show us the final zone of growth or decline.This math can also be applied not only to centimeters but to time bars. For example, if from one low to the next is 492 days, you can use the same formulas to extract valuable insights.So, what’s next for DOGE?If the zones I’ve already mentioned have occurred, how do we trade the future?When we extend the diameter — that is, the 14.4 cm cycle in our case — we do this three times. Pi is 3.14, so obviously:14.4 × 3 = 43.2Our Pi value is 45.2.That means 2 cm to the right will be the low before strong growth. This falls around September 1st, give or take — meaning sometime within the first two weeks of September a strong rally should begin, with acceleration in late September 2025.I came to all these conclusions after 2 hours of work and recently developed this linear strategy — or more precisely, I had a breakthrough on it — so I expect a lot more will be added as I continue writing the book.I also realized something else: remember the correlation between the highs and the strong pumps at 40.7 cm? We apply the same formula:40.7 / 2.166 = 18.8Which precisely points to the low before the pump.Then we take:(40.7 / 2.166) × 1.38 = 26 cmWhich also points to the same low as the 20.9 cm from the beginning of the 14.4 cm diameter.An incredible mathematical correlation found using the formula I discovered.To back up my words, I will index this idea and publish this excerpt on TradingView so it’s visible and verifiable. I hope the idea plays out, and that DOGE forms a local bottom in early September, followed by strong growth with acceleration at the end of September.To be clear, I just described how the internal structure works — and it is only Pi that points directly to the strong September rally. Let's see what happens.
FTT_TRADER369
2/4/26
This pattern is similar to many other altcoins that shot up from such a formation, plus the weekend has begun, which means there is potential for reduced volatility in Bitcoin and growth in altcoins.
FTT_TRADER369
2/3/23
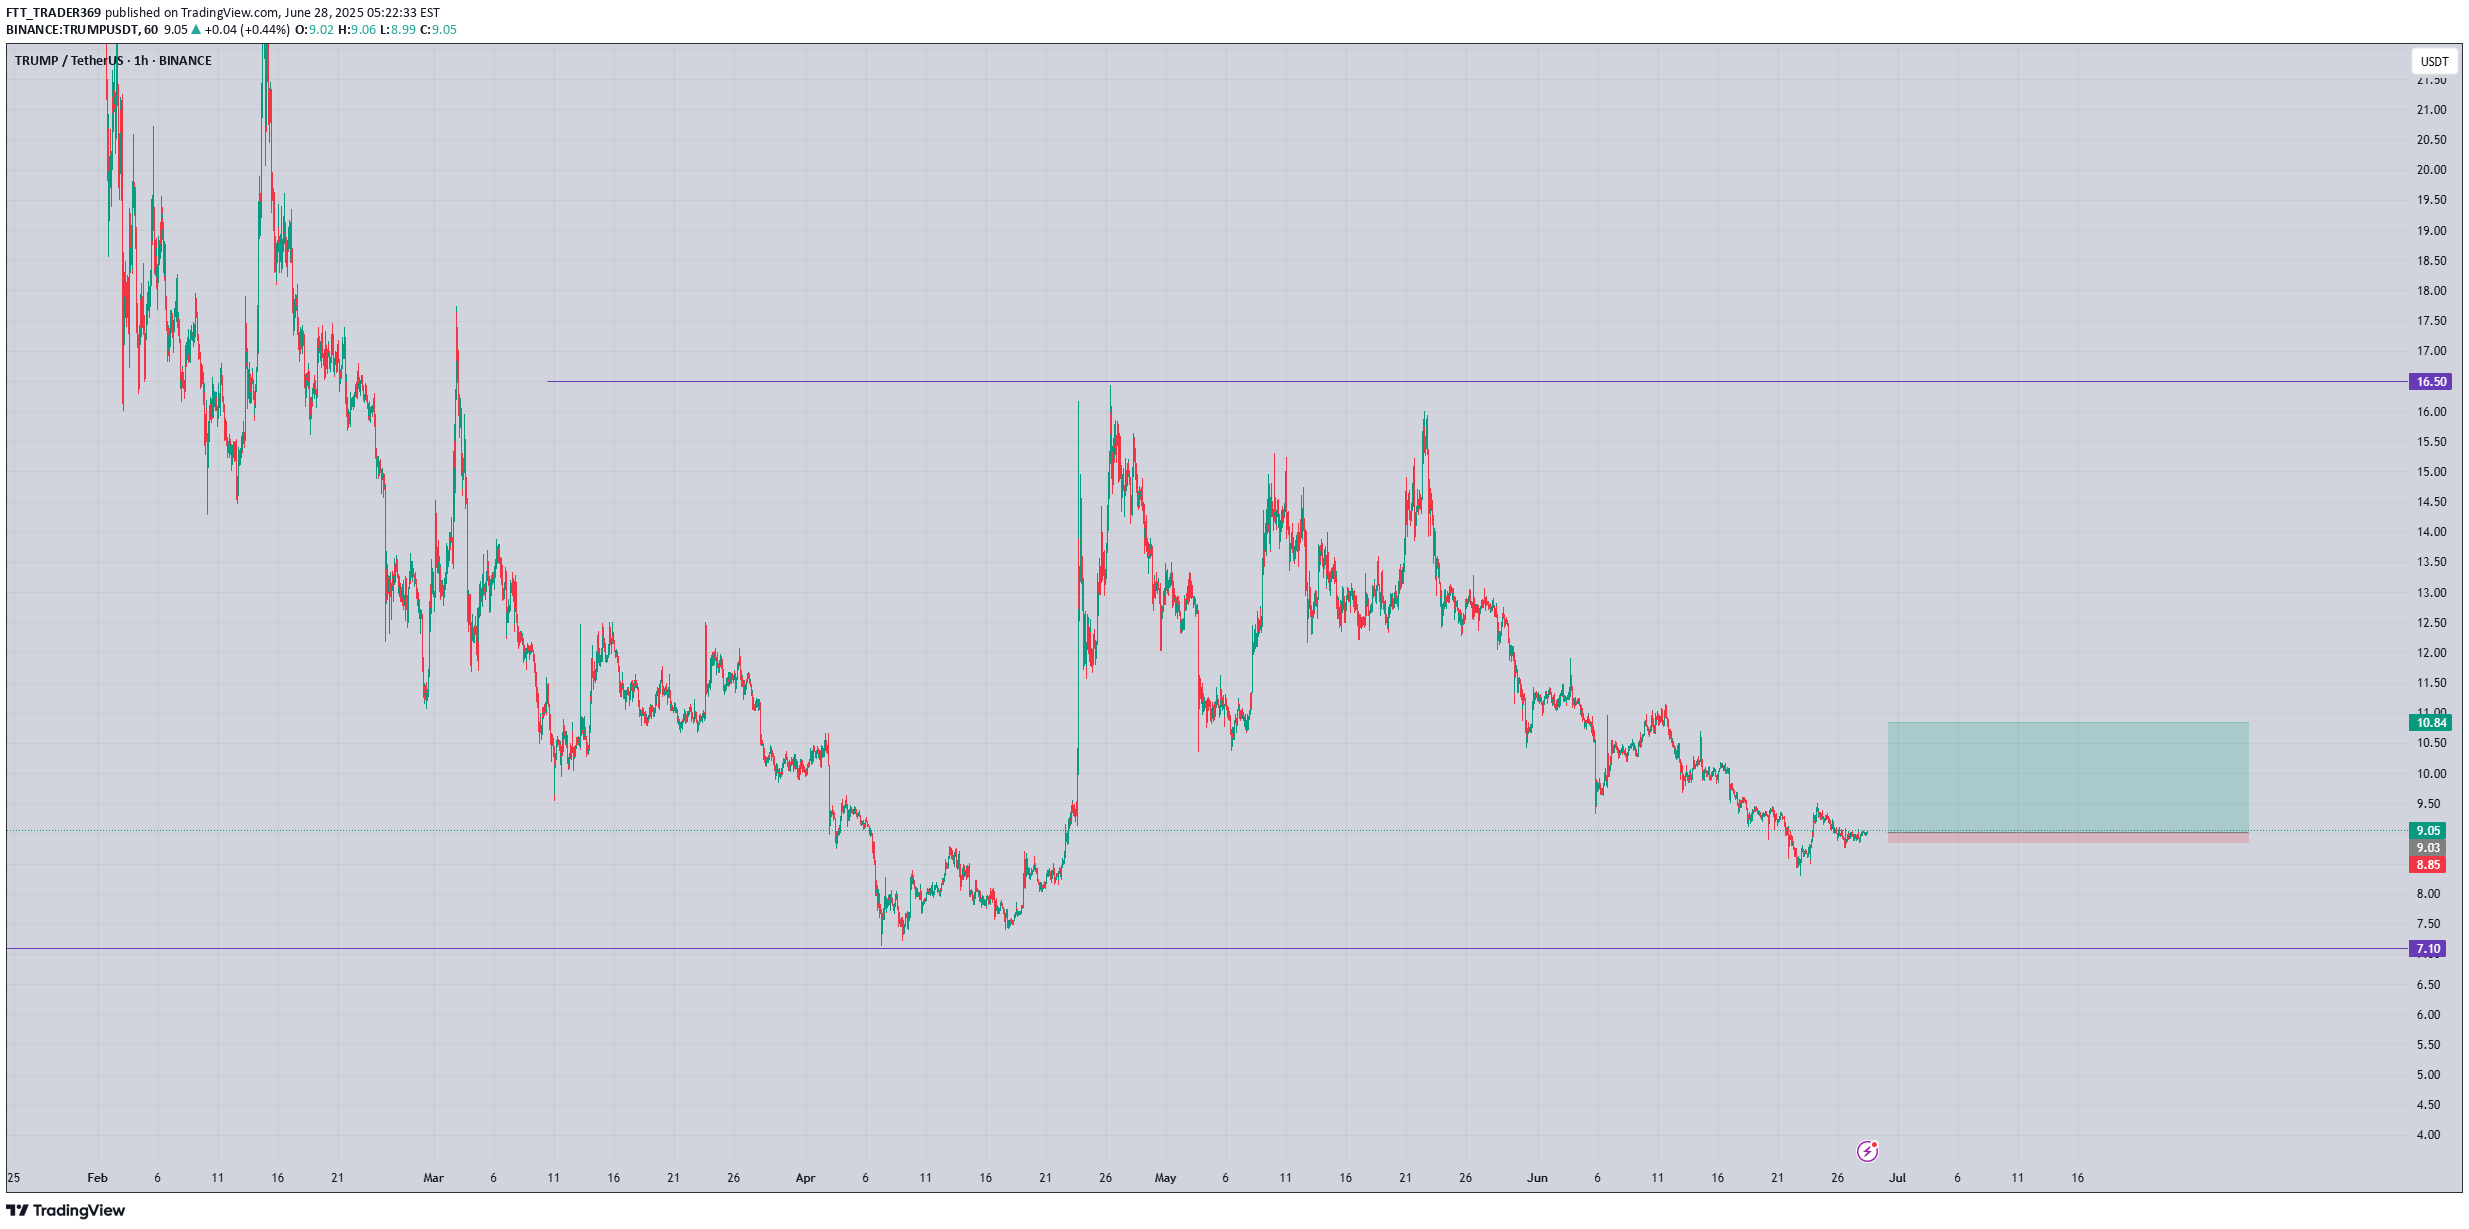
On the air, the classic pattern, I think, may be a sharp rise followed by a sharp decline.closeopen again
FTT_TRADER369
index idea number 1
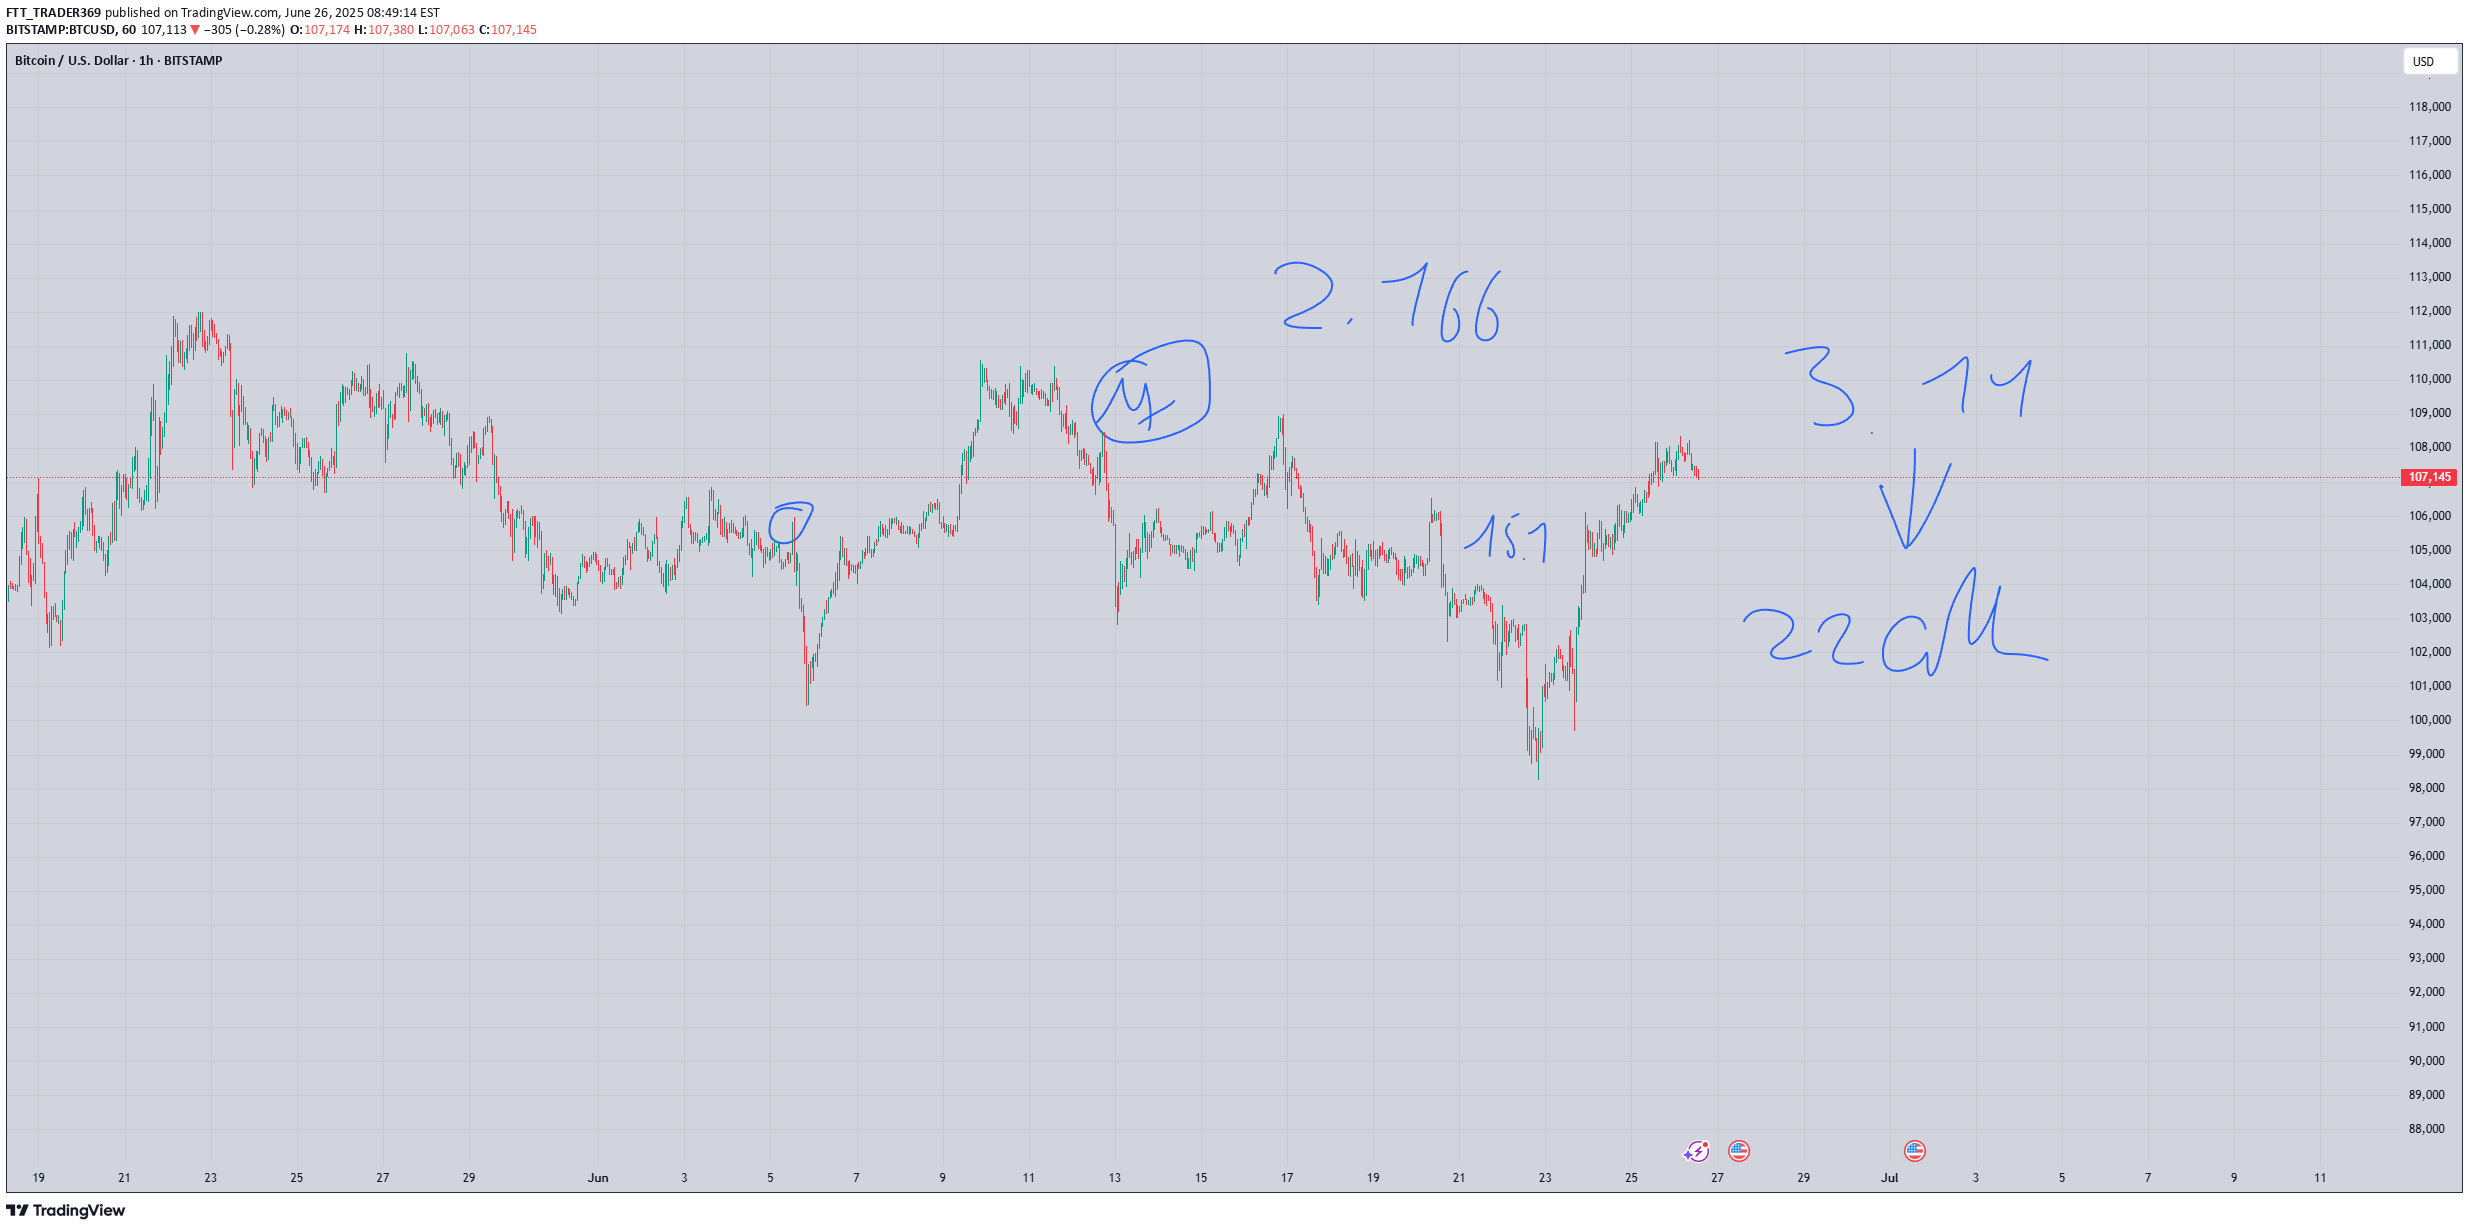
I am indexing an idea for my book. I expect there to be a trade at 22 cm from the control point when the PI cycle closes.
FTT_TRADER369
2/2/15
A classic pattern on the airwaves can be used to pick up good movement.
FTT_TRADER369
2/1/15
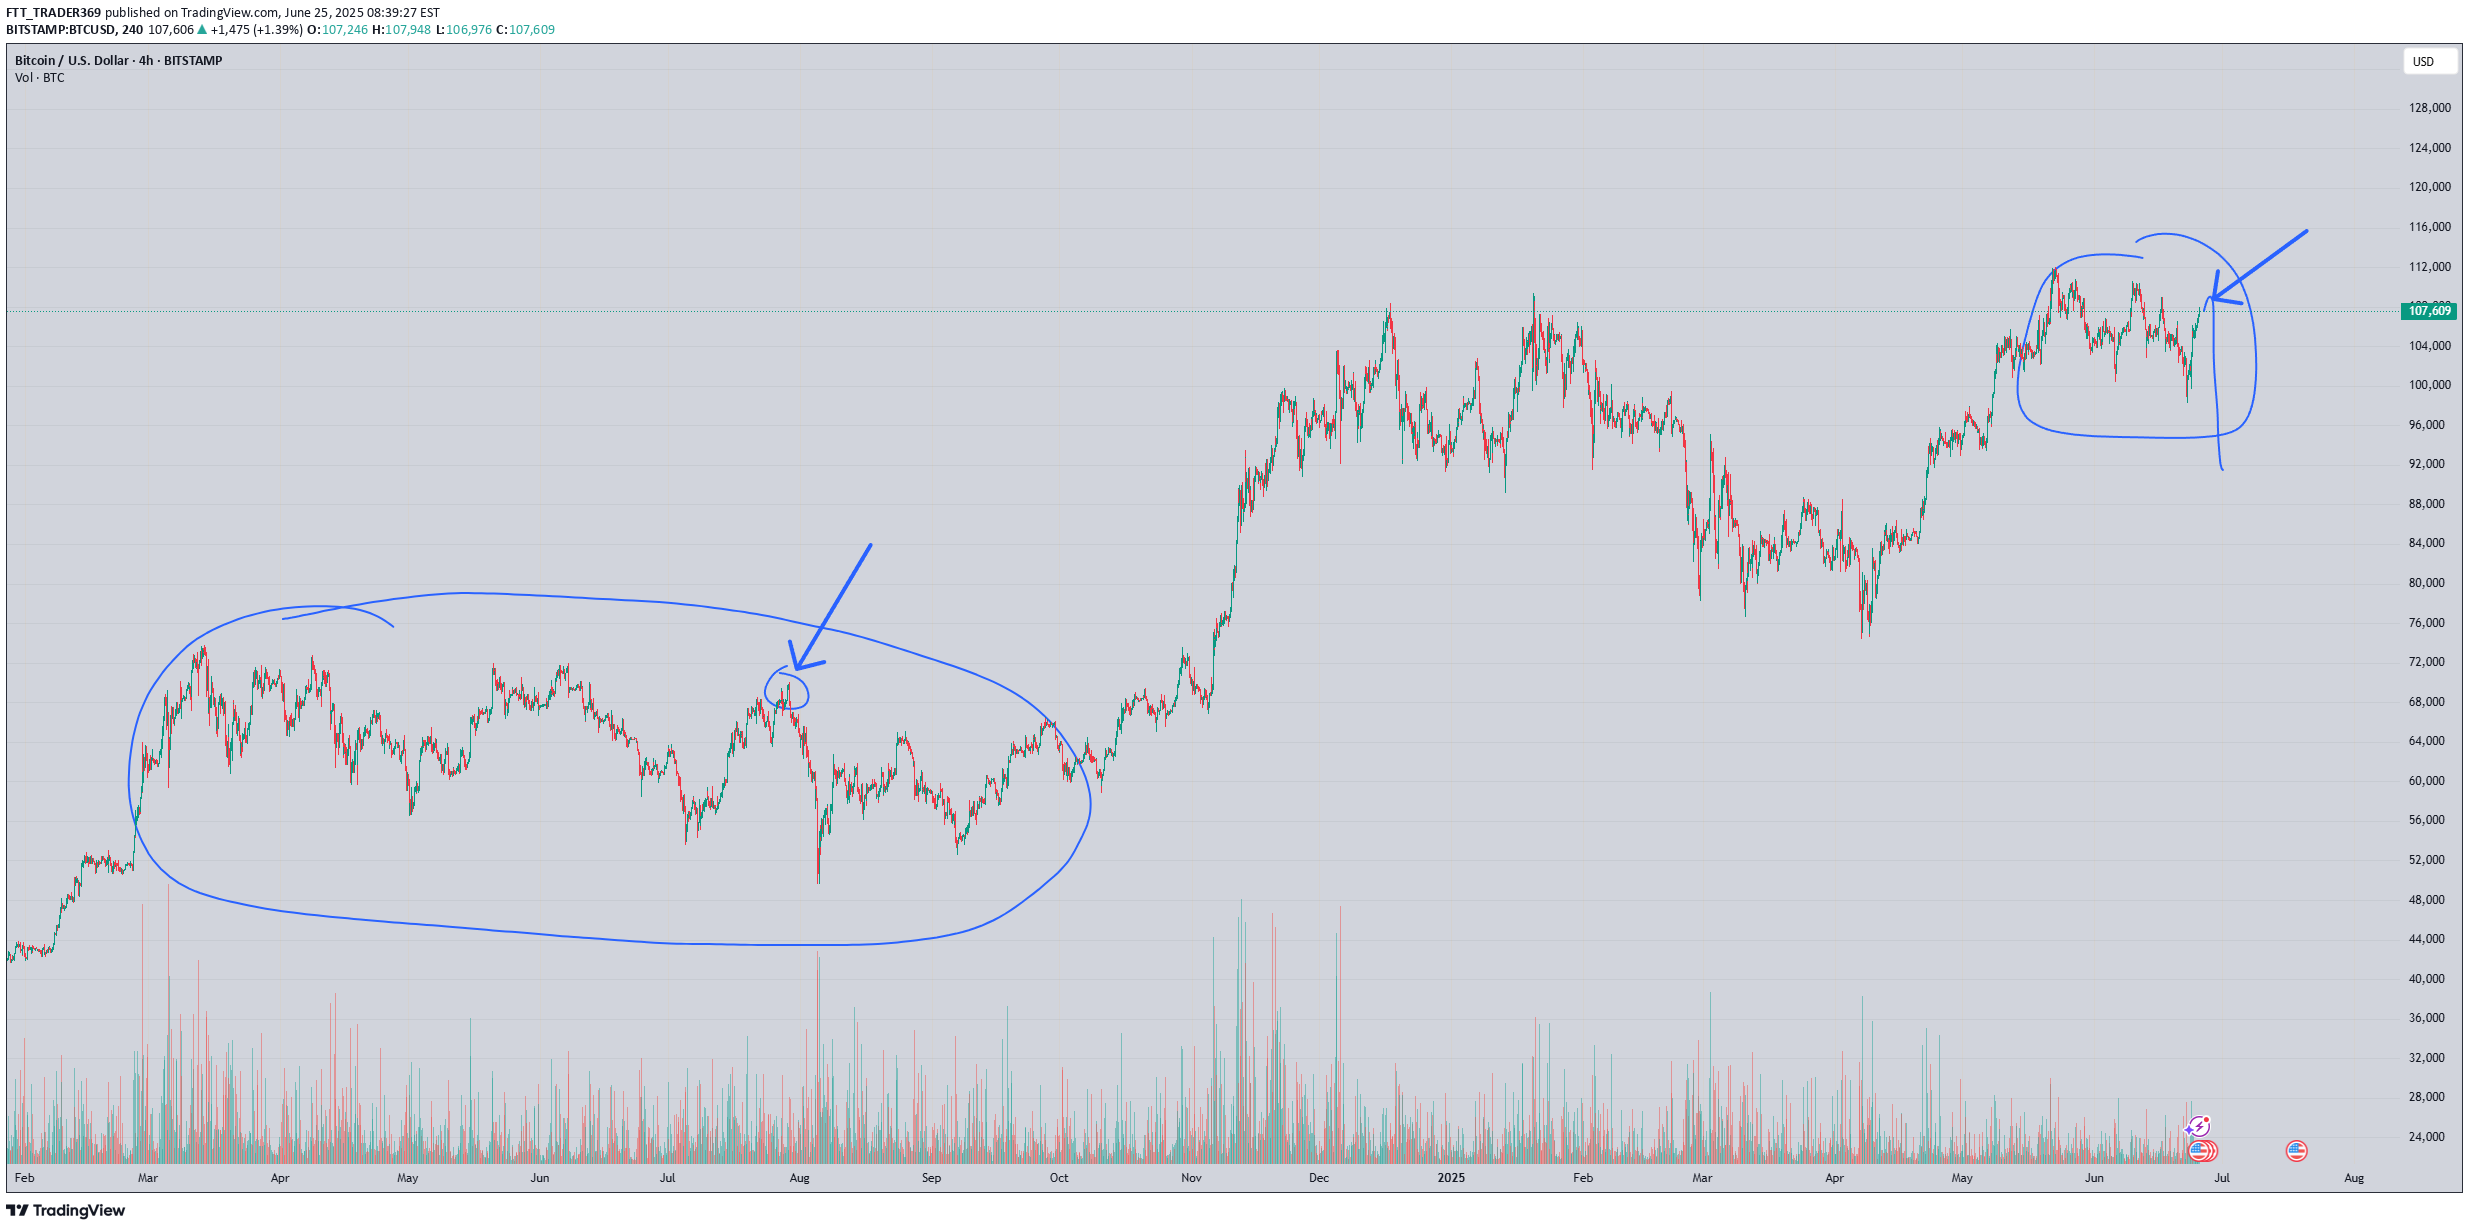
I’ve found a fractal on Bitcoin. Today is June 25, 2025, 13:22 — I’m analyzing the 2-hour timeframe from the high on May 22 up to today, and the same pattern of pre-accumulation is forming as in 2024, from March 13 to July 29, 2024.We are also inside a pattern I named “Dragon’s Wings.” It forms two peaks at the highs after a strong rally, and the shared low between them creates a deep retracement.Whether this pattern leads to the beginning of a major drop and a bear cycle, or whether it’s a pre-accumulation structure in a buffer zone, depends on the area in which it forms.In this case, the 93–74K zone is potentially a re-accumulation zone, with a reversal to the upside — possibly taking Bitcoin above $140,000.
Disclaimer
Any content and materials included in Sahmeto's website and official communication channels are a compilation of personal opinions and analyses and are not binding. They do not constitute any recommendation for buying, selling, entering or exiting the stock market and cryptocurrency market. Also, all news and analyses included in the website and channels are merely republished information from official and unofficial domestic and foreign sources, and it is obvious that users of the said content are responsible for following up and ensuring the authenticity and accuracy of the materials. Therefore, while disclaiming responsibility, it is declared that the responsibility for any decision-making, action, and potential profit and loss in the capital market and cryptocurrency market lies with the trader.