
Elliottwave-Forecast
@t_Elliottwave-Forecast

What symbols does the trader recommend buying?
Purchase History
پیام های تریدر
Filter
Elliottwave-Forecast
**صعود QQQ هنوز تمام نشده: گام بعدی تا قلههای 645 دلاری!**
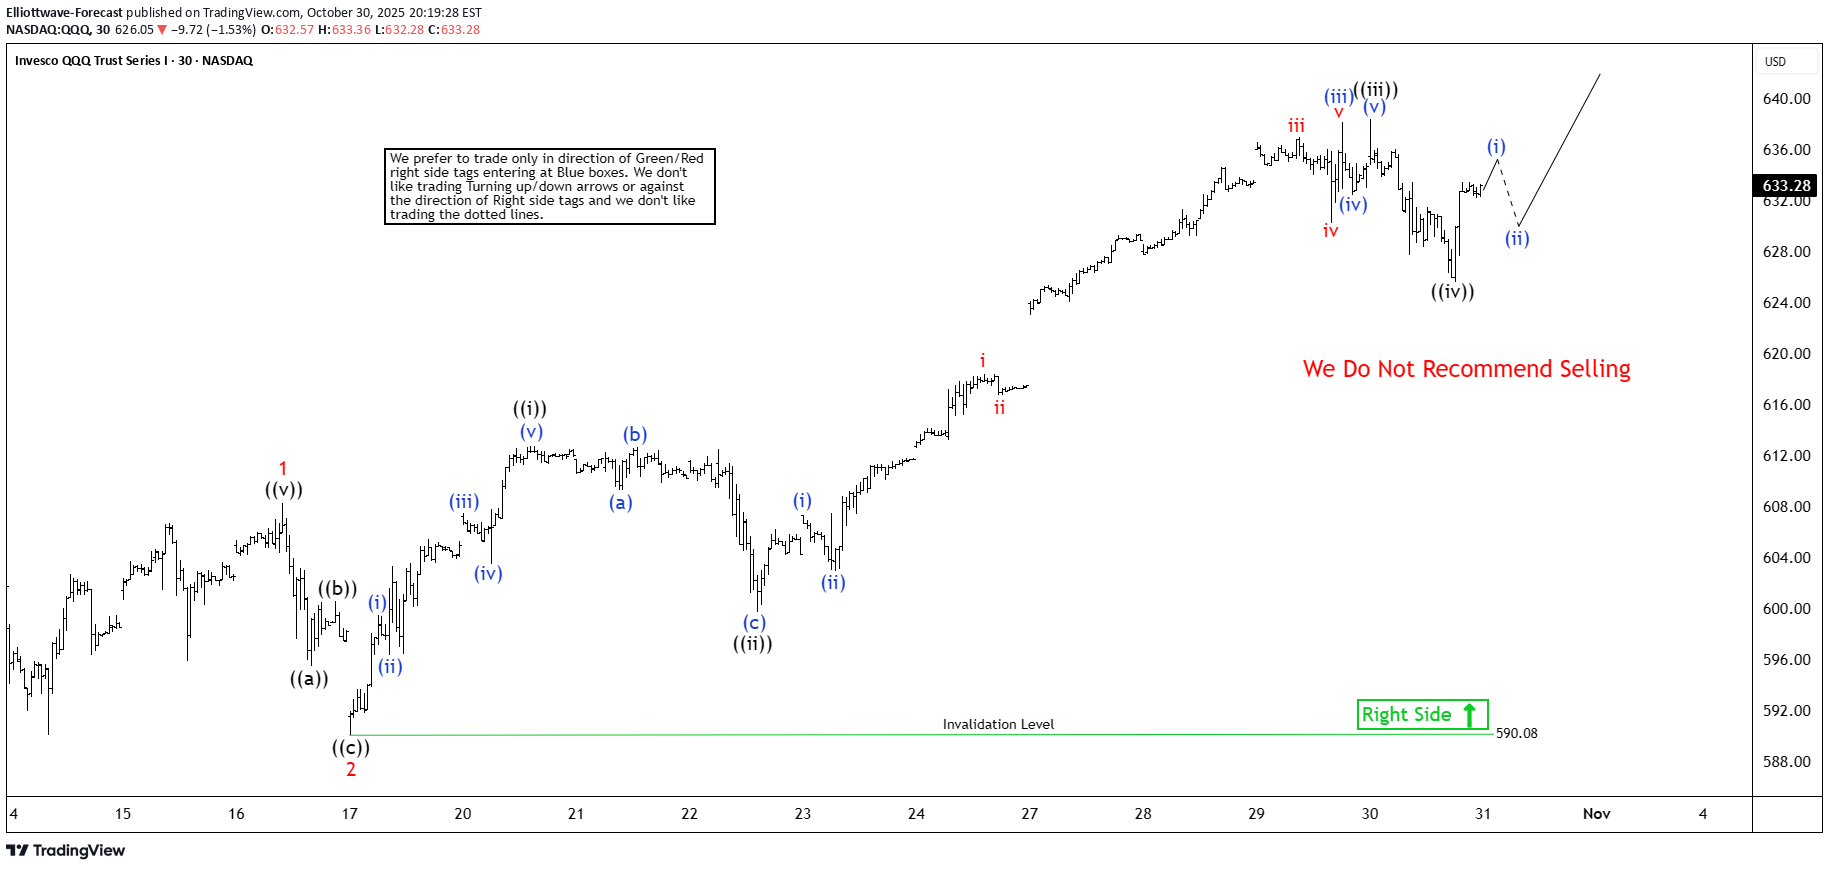
The Invesco QQQ Trust (QQQ) just reached a new all-time high. This milestone highlights an incomplete short-term Elliott Wave structure. A clear five-wave impulse cycle continues to advance from the October 11, 2025 low. Wave 1 completed at 608.31. It gave way to wave 2, which dipped to 590.08. The 30-minute chart clearly shows this correction. From there, the ETF surged higher into wave 3. Within wave 3, wave ((i)) peaked at 612.80. A brief wave ((ii)) followed and ended at 599.74. Price then accelerated upward in wave ((iii)), reaching 638.18. Wave ((iv)) corrected modestly to 625.61. One final push remains in wave ((v)). It should finish wave 3. After that, wave 4 will pull back. The ETF then resumes its climb in wave 5. This leg completes the full cycle from October 11. The key pivot at 590.08 stays intact. Any dip should hold support in a 3-, 7-, or 11-swing area. Upside momentum resumes above this level. The upside target derives from the 123.6%–161.8% inverse Fibonacci extension of wave ((iv)). This projects a zone of 640.80–645.50. Once wave 5 tops, a more significant correction follows. For now, price action favors higher levels, so the path of least resistance stays upward as long as 590.08 holds.
Elliottwave-Forecast
صعود انفجاری اپل (AAPL): رمزگشایی حرکت موج پنجم به قلههای تاریخی!
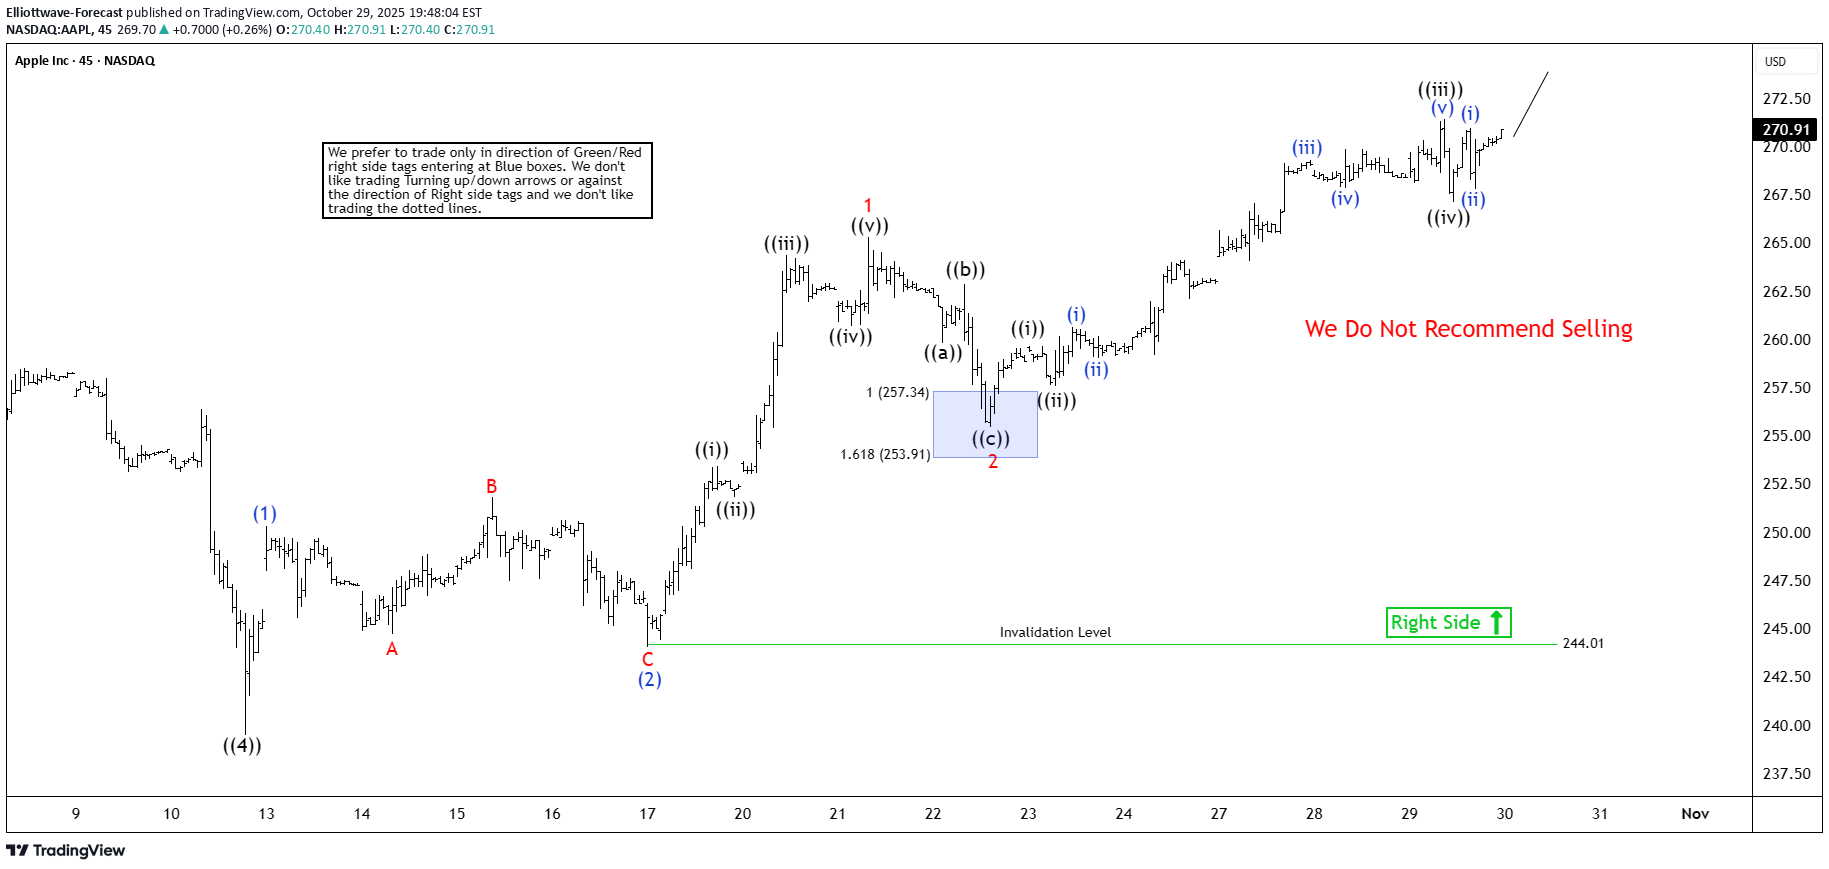
Apple (AAPL) has surged to a new all-time high, extending an impulse wave that began from the April 2025 low. Wave ((4)) of this larger impulse concluded at $239.49, as clearly illustrated on the 45-minute chart. Now, wave ((5)) advances higher in the form of a nested impulse structure. Rising from the wave ((4)) base, wave (1) completed at $250.65 before wave (2) pulled back to $244.01. From there, the stock nested upward again, with wave 1 ending at $265.29 and wave 2 correcting to $255.43. Apple then extended further in wave 3, which itself unfolds as an impulse of lesser degree. Within wave 3, wave ((i)) topped at $259.67, followed by a dip in wave ((ii)) to $257.55. Wave ((iii)) pushed higher to $271.41, and wave ((iv)) retraced to $267.11. Wave ((v)) of 3 should finish soon, leading to a pullback in wave 4 before the uptrend resumes with renewed strength.In the near term, the bullish outlook remains intact as long as the pivot low at $244.01 holds. Any dips are likely to find support in 3, 7, or 11 swing sequences, setting the stage for continued upside. This Elliott Wave progression underscores persistent momentum, with nested impulses reinforcing the primary trend and positioning Apple for additional gains ahead.
Elliottwave-Forecast
صعود انفجاری انویدیا (NVDA): راز موج پنجم الیوت و رسیدن به اوج تاریخی
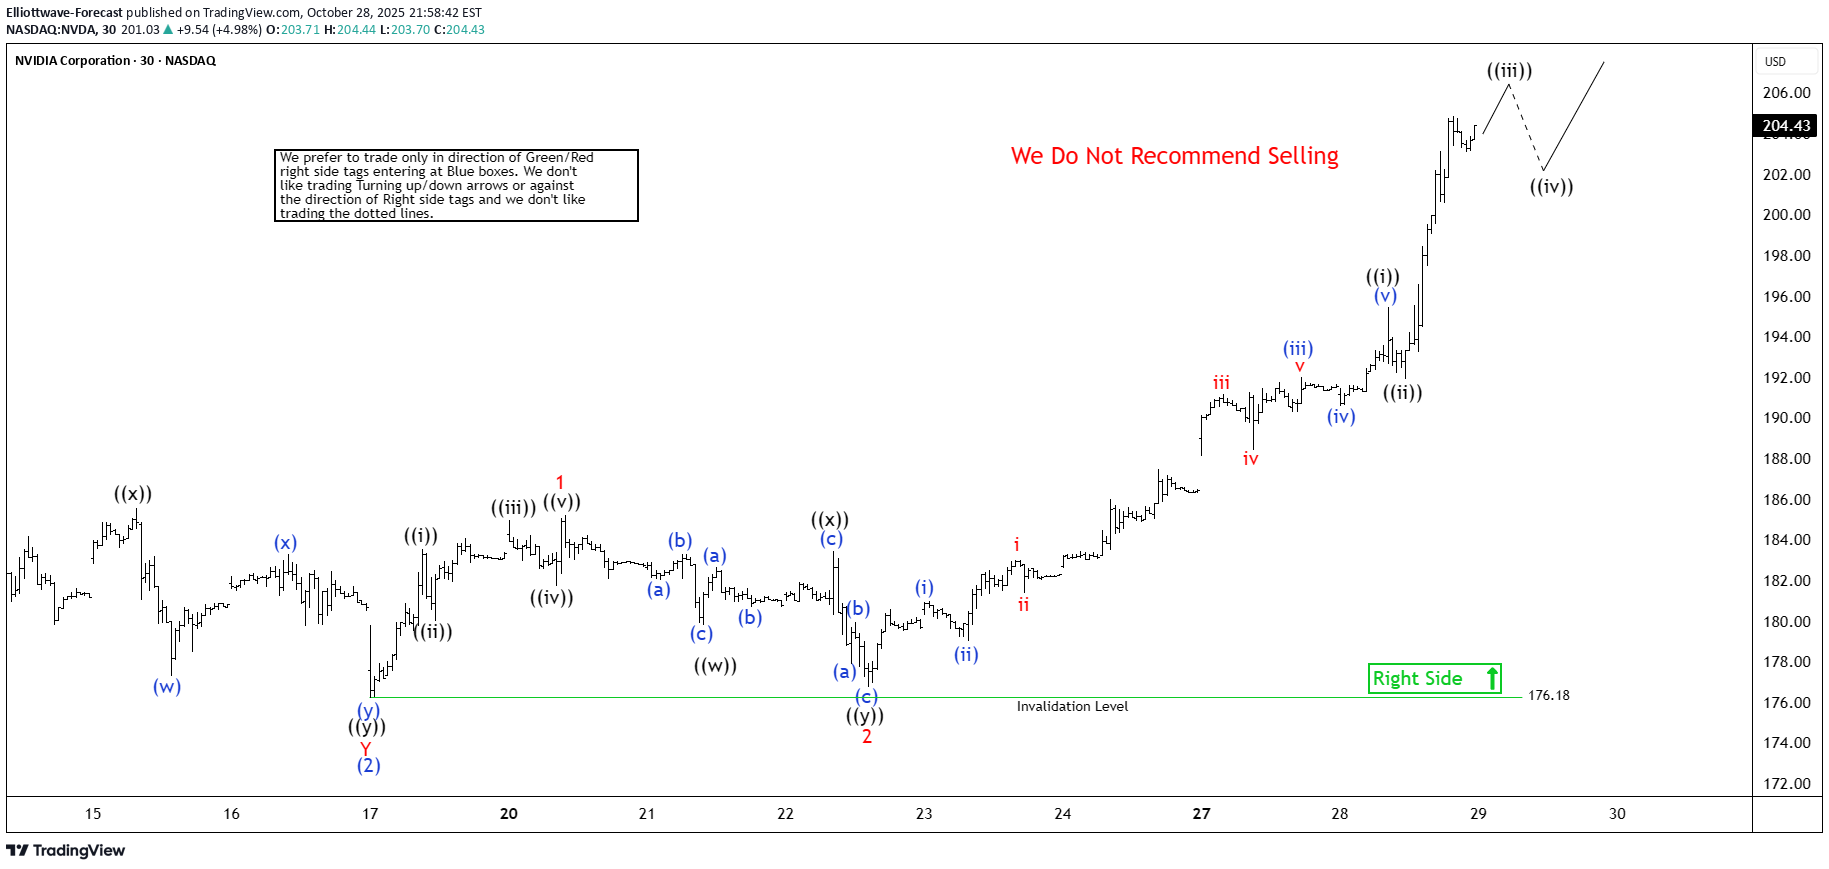
Nvidia (NVDA) continues its impulsive cycle from the April 2025 low, manifesting a clear five-wave advance. The stock now progresses through the terminal wave ((5)), which subdivides into a nested five-wave structure of lesser degree. The advance originated at the wave ((4)) low of $164.07, where wave (1) rallied to $195.62. A subsequent correction in wave (2) concluded at $176.18, as evidenced by the 30-minute chart. From this point, wave (3) resumed the upward trajectory. Within wave (3), wave 1 terminated at $185.20, followed by a retracement in wave 2 to $176.76. The rally then accelerated in wave 3. From the wave 2 low, wave ((i)) completed at $195.47, and wave ((ii)) found support at $191.91. The structure projects further extension in wave ((iii)), followed by a consolidation in wave ((iv)) before the final push in wave ((v)) of 3. This internal progression supports a series of higher highs, continuing until wave (5) of ((5)) reaches completion and concludes the cycle from April 2025. Near-term support remains firmly established at the $176.18 pivot low. As long as this level holds, any corrective dips—typically unfolding in three, seven, or eleven swings—should attract buyers and set the stage for additional upside. The overall impulsive framework remains intact, with bullish momentum driving the advance in accordance with Elliott Wave principles.
Elliottwave-Forecast
هدف بعدی انویدیا (NVDA) کجاست؟ پیشبینی صعود تا ۱۹۳ دلار!
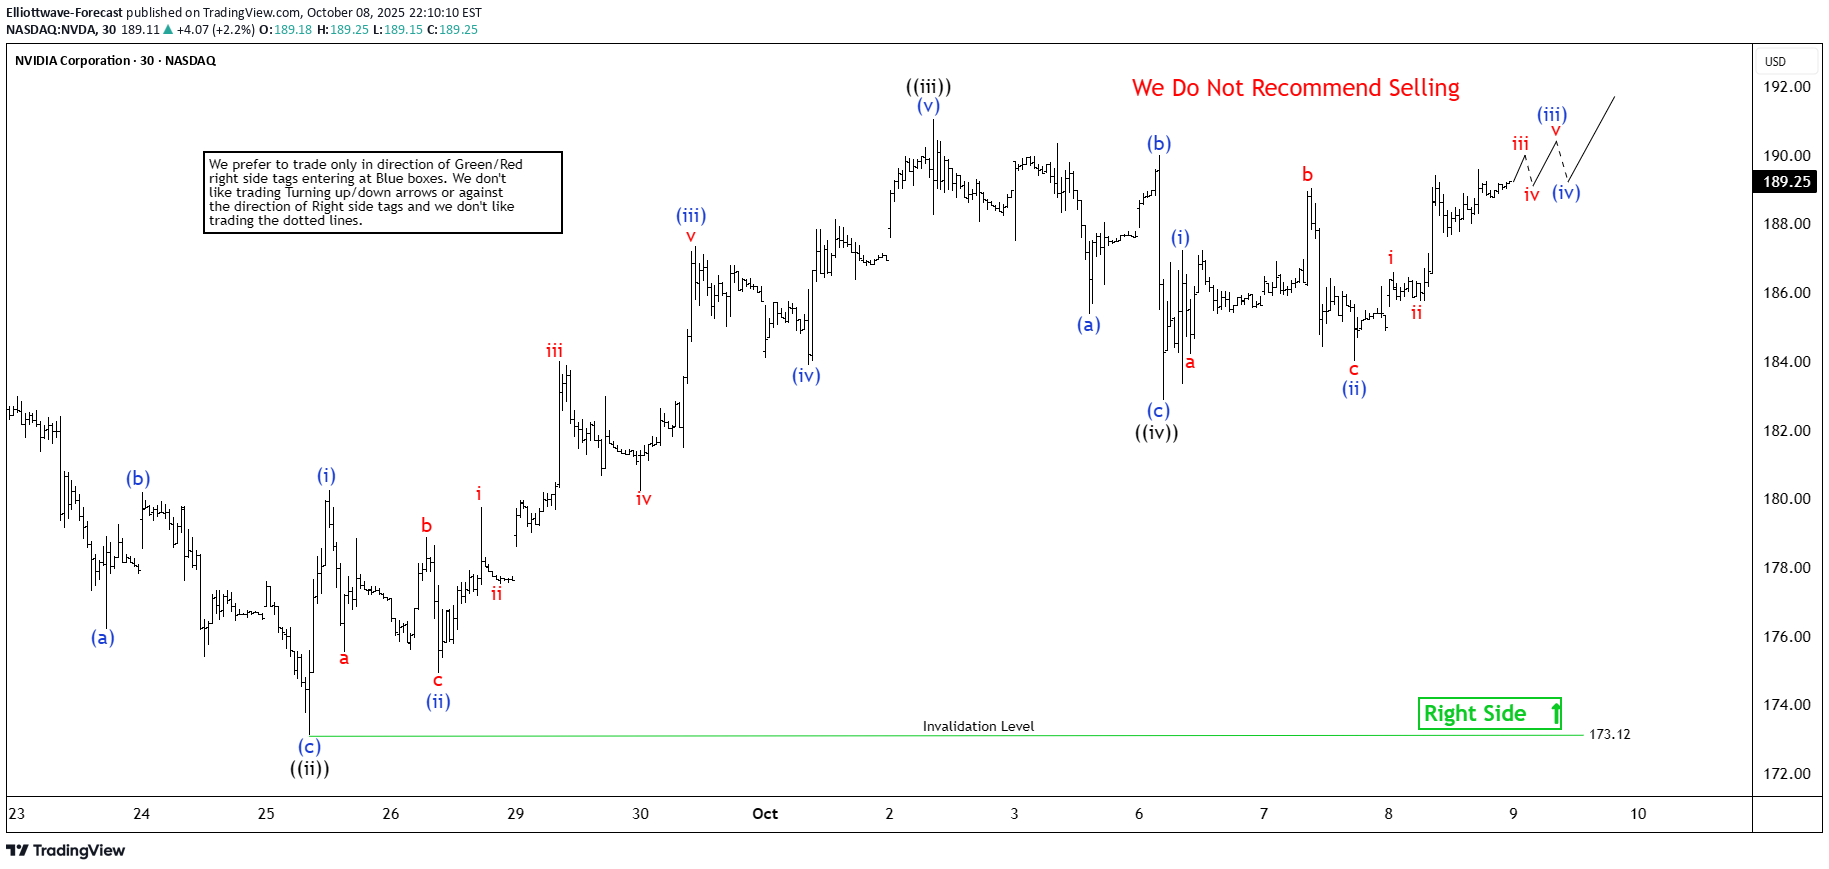
The short-term Elliott Wave analysis for Nvidia (NVDA) indicates that the cycle from the September 18 low is unfolding as a leading diagonal. Starting from that low, wave ((i)) concluded at $184.55, followed by a pullback in wave ((ii)) that ended at $173.12, as depicted in the 30-minute chart. The stock then surged in wave ((iii)), displaying an internal impulse structure. From wave ((ii)), wave (i) peaked at $180.26, with wave (ii) dipping to $174.93. Wave (iii) climbed to $187.35, followed by a wave (iv) pullback to $183.90. The final leg, wave (v), reached $191.05, completing wave ((iii)) in a higher degree. The subsequent wave ((iv)) pullback formed a zigzag Elliott Wave pattern. From wave ((iii)), wave (a) declined to $185.38, wave (b) rose to $190, and wave (c) dropped to $182.88, finalizing wave ((iv)). The stock has since resumed its ascent in wave ((v)), with wave (i) ending at $187.23 and wave (ii) dips concluding at $184. The stock is poised to climb further, likely completing wave (iii) soon. A wave (iv) pullback should follow to correct the cycle from the October 8, 2025 low before resuming higher. As long as the $173.12 pivot holds, any pullback should find support in a 3, 7, or 11 swing, setting the stage for additional upside.
Elliottwave-Forecast
آینده بیت کوین پس از اوجهای تاریخی: تحلیل موجی و هدفهای صعودی بعدی
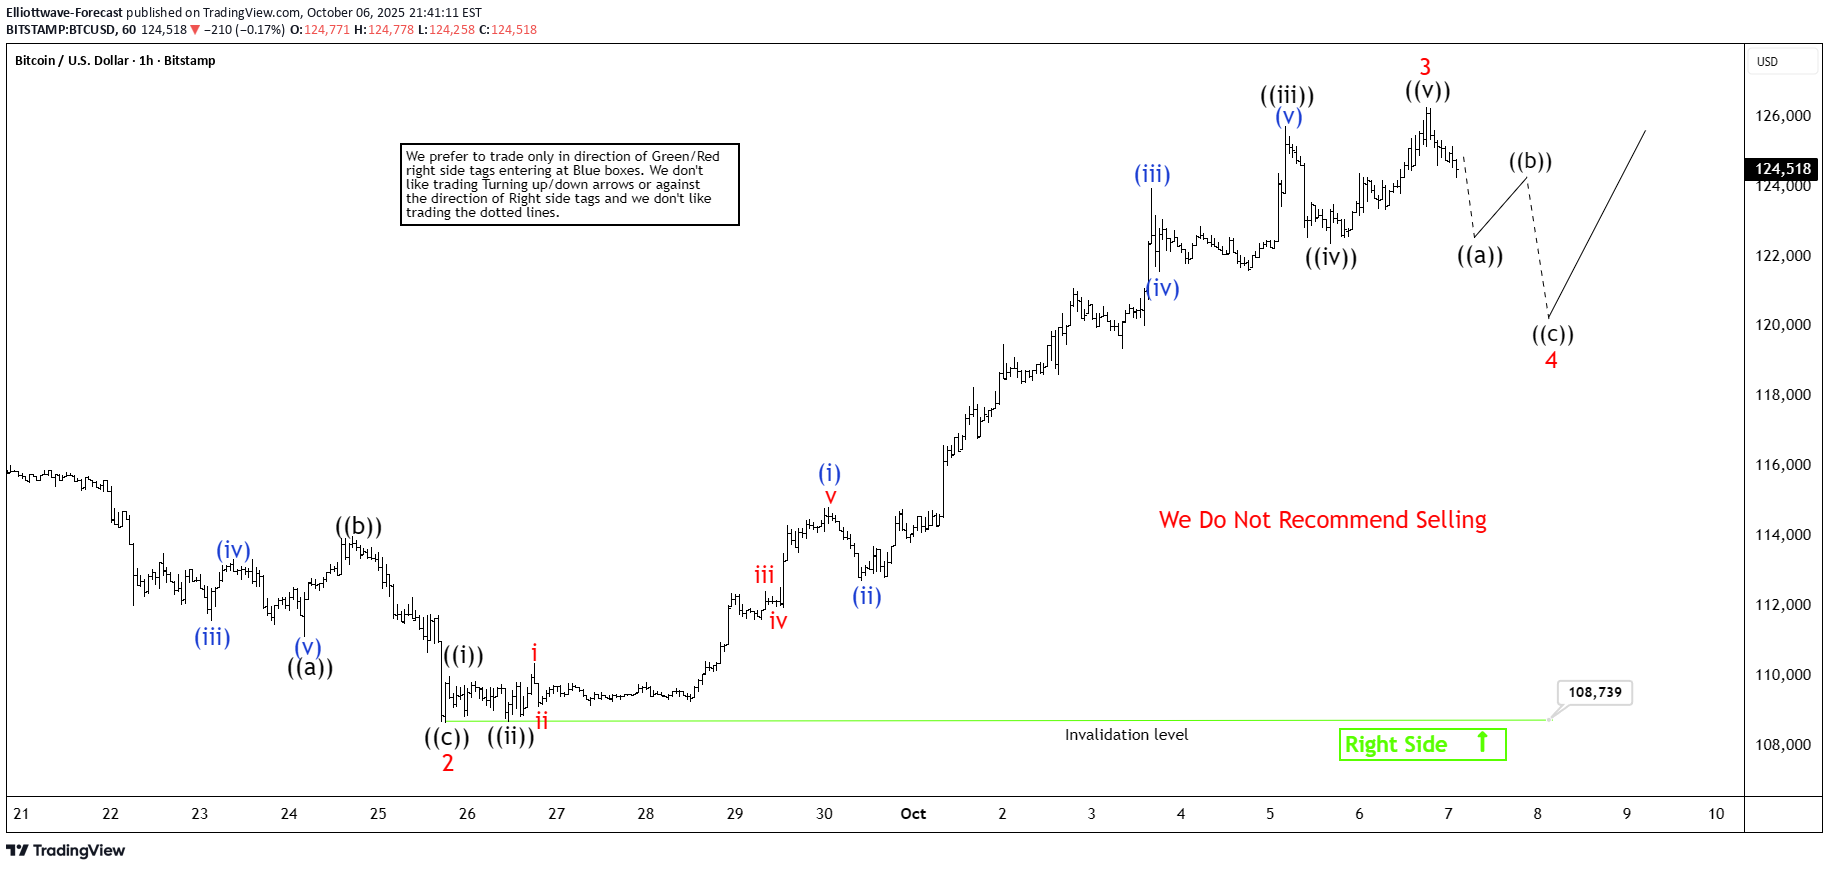
The short-term Elliott Wave analysis for Bitcoin (BTCUSD) indicates a five-wave impulse cycle unfolding from the September 1, 2025 low. Wave 1 reached $117,968, and wave 2 corrected to $108,739. Bitcoin then surged to a new all-time high, advancing in wave 3. Within wave 3, sub-wave ((i)) peaked at $109,995. Sub-wave ((ii)) pulled back to $108,676. The rally progressed, with sub-wave ((iii)) hitting $125,725. Sub-wave ((iv)) found support at $122,355, maintaining the bullish structure. Sub-wave ((v)) is nearing completion, finalizing wave 3 on a higher degree. Following this, wave 4 should correct the rally from the September 25, 2025 low. The uptrend will likely resume in wave 5. As long as the pivot low at $108,676 from September 25 remains intact, dips should find support in a 3, 7, or 11 swing pattern. This support will facilitate further upside. After wave 4 concludes, traders can project the wave 5 target using the 123.6–161.8% inverse Fibonacci retracement of wave 4. This calculation will provide a precise target for Bitcoin’s next rally. The cryptocurrency’s price action reflects strong bullish momentum, suggesting continued growth in the near term.
Elliottwave-Forecast

The short-term Elliott Wave analysis for Gold (XAUUSD) indicates that the cycle starting from the September 18, 2025 low is unfolding as a five-wave impulse. From that low, wave (i) advanced to $3647.32, followed by a corrective wave (ii) that concluded at $3631.94. Gold then surged in wave (iii) to $3759.16, with a subsequent dip in wave (iv) ending at $3736.45. The final leg, wave (v), peaked at $3791.08, completing wave ((i)) on a higher degree. A corrective pullback in wave ((ii)) reached $3716.41, unfolding as a zigzag Elliott Wave structure. From the wave ((i)) high, wave (a) declined to $3750.29, wave (b) rallied to $3779.41, and wave (c) dropped to $3716.41, finalizing wave ((ii)). Gold has since resumed its upward trajectory in wave ((iii)), reaching $3871.73, with a minor pullback in wave ((iv)) concluding at $3792.88. As long as the pivot at $3716.41 remains intact, expect Gold to continue its ascent.
Elliottwave-Forecast

The short-term Elliott Wave analysis for Ethereum (ETHUSD) indicates that the cycle from the August 24, 2025 peak continues to unfold as a zigzag Elliott Wave structure. From that peak, wave A concluded at $4,214.14, followed by a wave B rally that reached $4,770.92. Ethereum then turned lower in wave C, which is developing as an impulse Elliott Wave structure. Within wave C, wave ((i)) ended at $4,429.03, and the subsequent rally in wave ((ii)) peaked at $4,649.37. The cryptocurrency has since extended lower in wave ((iii)), hitting $4,074.40, with wave ((iv)) concluding at $4,208.33. Currently, wave ((v)) is underway and appears mature, suggesting it could end soon. As long as the pivot at $4,770.92 remains intact, further downside is possible. The target for wave C can be calculated using the 100% to 161.8% Fibonacci extension of wave A, measured from the August 24, 2025 peak. This projects a range of $3,553.64 to $4,013.04. Once Ethereum reaches this zone, it could reverse higher or at least rally in three waves. Traders should monitor this area for potential buying opportunities, as it may signal the end of the current corrective phase and the start of a new upward move.
Elliottwave-Forecast

The short-term Elliott Wave analysis for Apple (AAPL) indicates that a rally from the September 11, 2025 low is unfolding as a five-wave impulse structure. Starting from that low, wave ((i)) concluded at $228.40, followed by a pullback in wave ((ii)) that ended at $226.50. The subsequent advance in wave ((iii)) reached $238.19, with a brief dip in wave ((iv)) closing at $236.10. The final leg, wave ((v)), peaked at $241.22, completing wave 1 of a higher degree. A corrective wave 2 followed, concluding at $236.68, exhibiting an internal zigzag structure with segments ((a)), ((b)), and ((c)). The stock has since resumed its upward trajectory in wave 3. From the wave 2 low, wave ((i)) advanced to $247.42, and a minor pullback in wave ((ii)) settled at $244.39. The rally in wave ((iii)) climbed to $256.64, followed by a dip in wave ((iv)) to $253.16. The final push in wave ((v)) reached $257.34, completing wave 3 of a larger degree. A corrective wave 4 appears to have concluded at $251.04, aligning with the 100%–161.8% Fibonacci extension of the zigzag structure. As long as the pivot at $236.68 holds, any near-term pullback should find support in a 3, 7, or 11 swing, setting the stage for further upside momentum in AAPL’s price action.
Elliottwave-Forecast

The short-term Elliott Wave analysis for the S&P 500 (SPX) indicates that the cycle starting from the August 2, 2025 low is unfolding as a five-wave structure. From that low, wave ((i)) concluded at 6481.34. The subsequent pullback in wave ((ii)) developed as a running flat Elliott Wave pattern. In this structure, wave (a) declined to 6343.86, wave (b) rallied to 6508.23, and wave (c) fell to 6360.3, completing wave ((ii)) at a higher degree. The Index then advanced in wave ((iii)). From the wave ((ii)) low, wave (i) reached 6532.65, followed by a dip in wave (ii) to 6443.98. The Index climbed higher in wave (iii) to 6626.99, with a pullback in wave (iv) ending at 6551.15. Wave (v) then pushed to 6699.52, finalizing wave ((iii)). Currently, wave ((iv)) is correcting the cycle from the September 2, 2025 low, expected to unfold in a 3, 7, or 11 swing pattern before the Index resumes its upward trajectory. In the near term, as long as the pivot low at 6360.3 holds, dips should attract buyers in a 3, 7, or 11 swing structure, supporting further upside.
Elliottwave-Forecast

The short-term Elliott Wave analysis for Alphabet Inc. (GOOGL) indicates that the cycle starting from the August 20, 2025 low is unfolding as a five-wave impulse. From that low, wave (1) concluded at $214.65, followed by a pullback in wave (2) that ended at $206.19. The subsequent wave (3) advanced in a five-wave impulse structure on a smaller scale. From wave (2), wave 1 peaked at $229.75, and wave 2 retraced to $222.44. The stock then surged in wave 3 to $241.66, with wave 4 correcting to $236.25. The final leg, wave 5, reached $255, completing wave (3) on a higher degree. A pullback in wave (4) likely concluded at $246.28, structured as a zigzag. From wave (3), wave A declined to $249.47, wave B rallied to $253, and wave C fell to $246.28, finalizing wave (4). The stock has since resumed its upward trajectory in wave (5). However, it must break above the wave (3) high of $255 to eliminate the possibility of a double correction. In the near term, as long as the pivot at $206.19 holds, any pullback should find support in a 3, 7, or 11-swing sequence, setting the stage for further upside.
Disclaimer
Any content and materials included in Sahmeto's website and official communication channels are a compilation of personal opinions and analyses and are not binding. They do not constitute any recommendation for buying, selling, entering or exiting the stock market and cryptocurrency market. Also, all news and analyses included in the website and channels are merely republished information from official and unofficial domestic and foreign sources, and it is obvious that users of the said content are responsible for following up and ensuring the authenticity and accuracy of the materials. Therefore, while disclaiming responsibility, it is declared that the responsibility for any decision-making, action, and potential profit and loss in the capital market and cryptocurrency market lies with the trader.