
Eldric_Morran
@t_Eldric_Morran

What symbols does the trader recommend buying?
Purchase History
پیام های تریدر
Filter
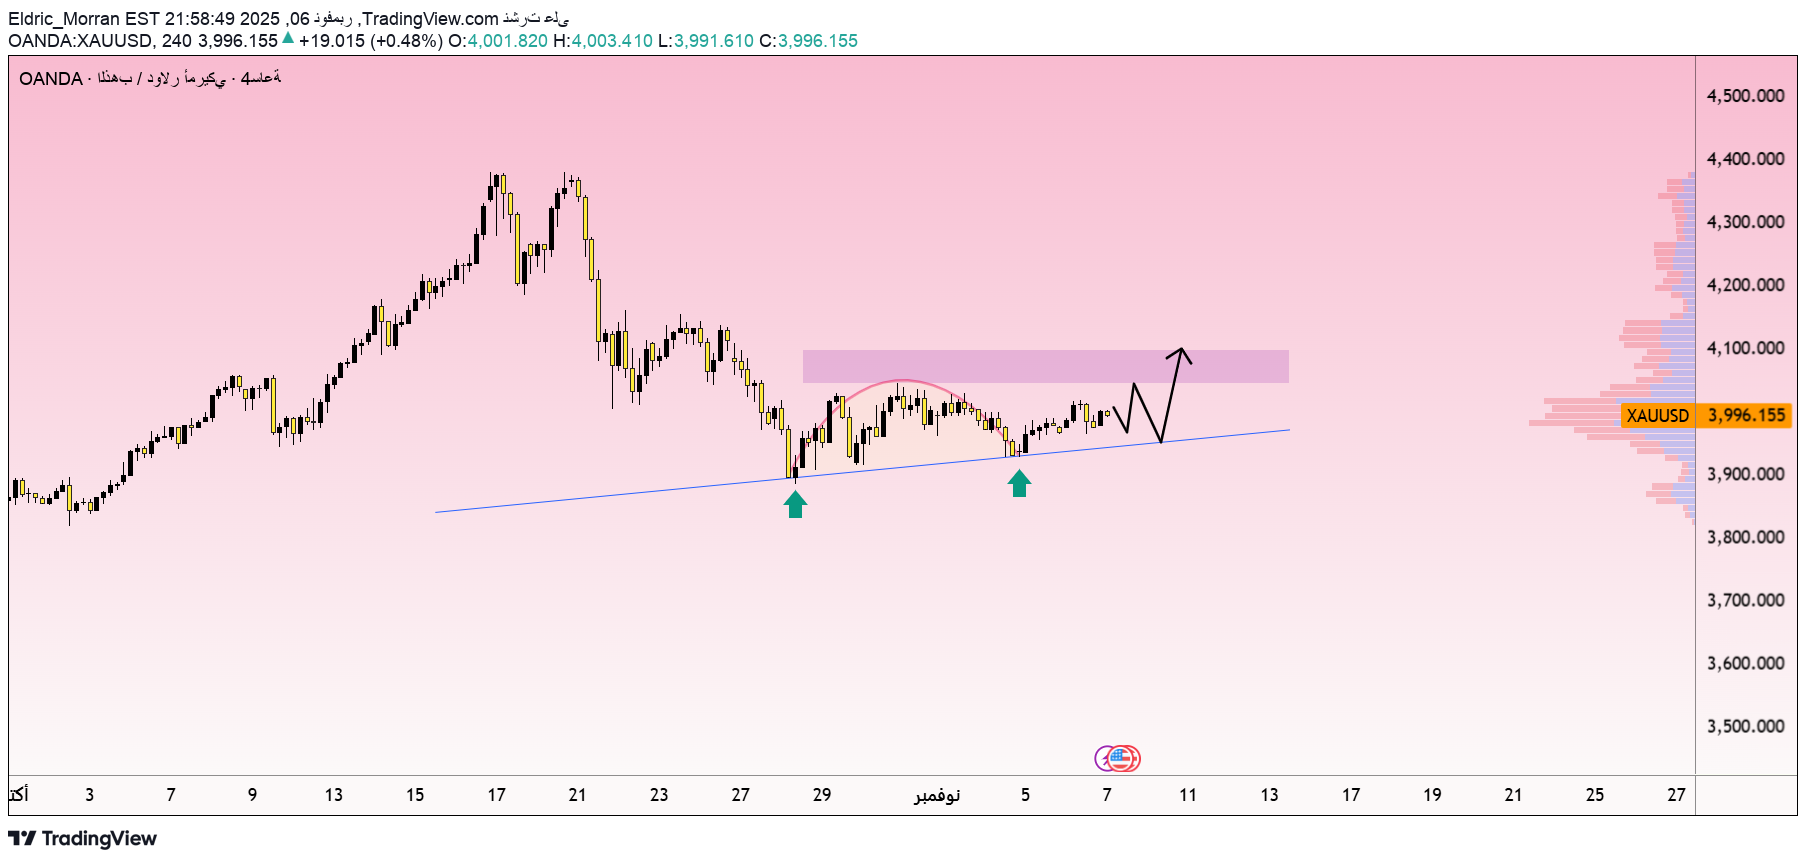
آیا طلا آماده انفجار قیمتی است؟ تحلیل قویترین سیگنالهای صعودی طلا
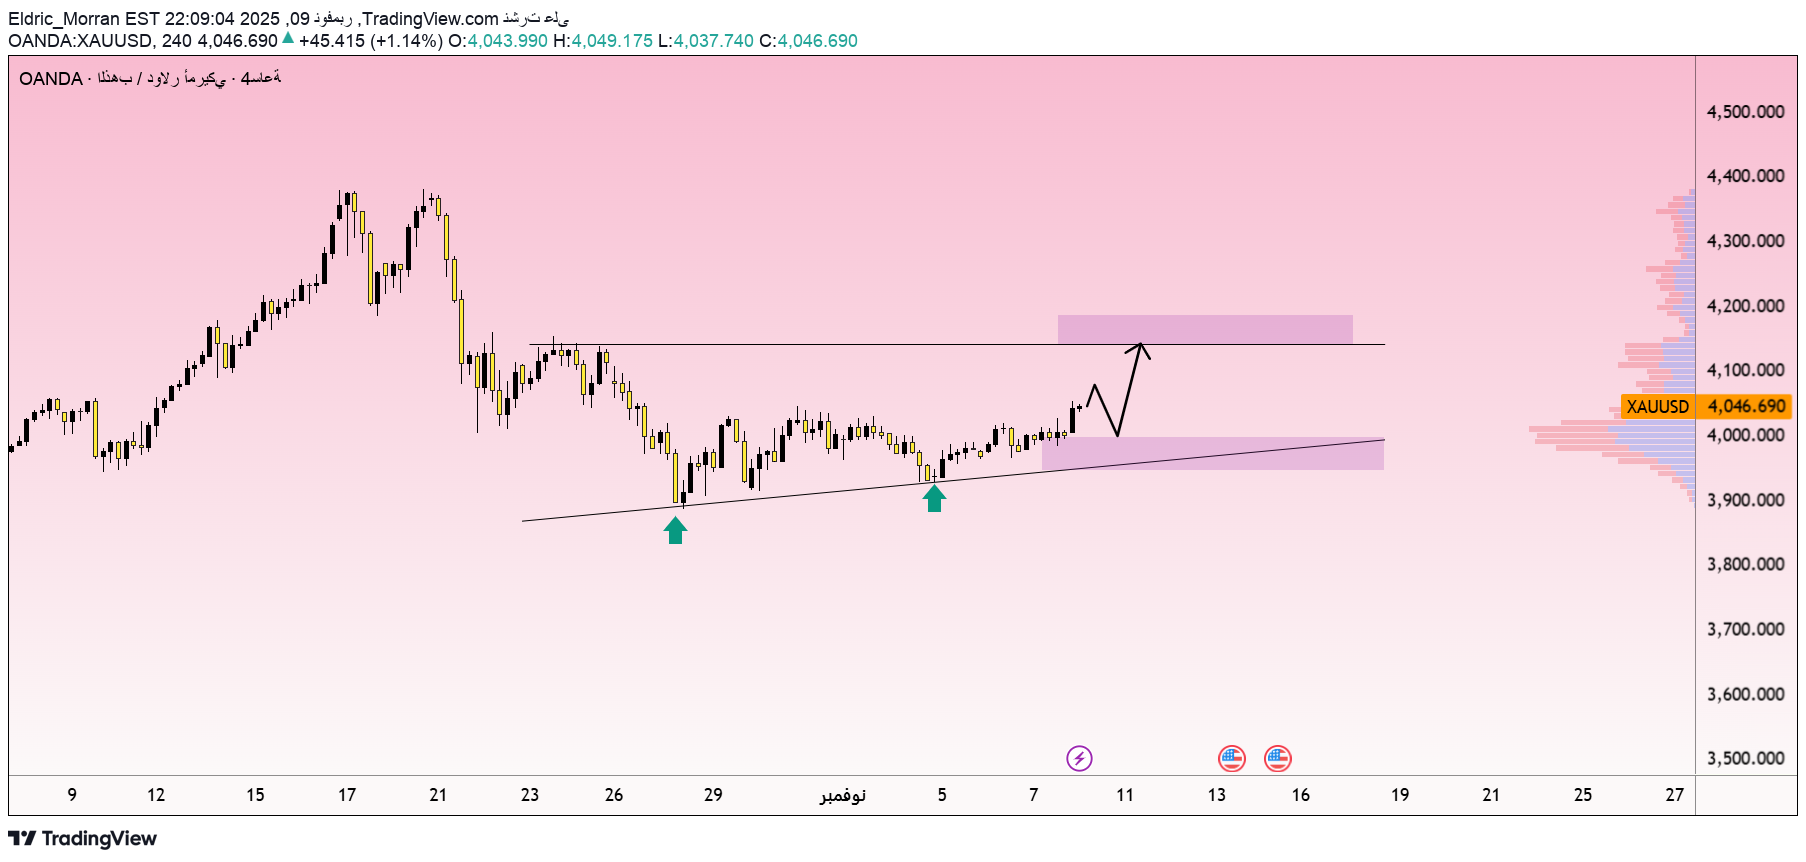
Gold continues to maintain its stable upward momentum in light of the weakness of the US dollar and increasing expectations of interest rate cuts by the Federal Reserve. Investors' mood towards safe assets has returned strongly, strengthening gold's position as one of the most important safe havens in the markets. On the chart, the price is moving above the rising trend line and reacting strongly around the $4,000 area, which represents a strategic support area. The current price structure indicates that gold is in a consolidation phase in preparation for a potential bullish breakout. If gold continues to hold above the $4,000 level, it is likely to see a strong push towards the resistance area between $4,130 and $4,140, an area that intersects with the previous highs. A breach of this area may pave the way for a medium-term uptrend towards the $4,200 area. Overall, the main trend is still up, and any short-term corrections can be viewed as opportunities to buy into the trend.
أسرار الدخول المثالي: 3 خطوات لإيجاد أفضل نقاط الربح مع الاتجاه في التداول
When you trade with the trend, the issue is not "Is the trend up or down?" Rather, it is “Where do you enter the trade to have the highest probability of winning?” This is exactly what most traders overlook. But in fact, if you understand the following three basic principles, determining the ideal entry point will become very clear and easy. 🔹 1. Trade with the trend – “Don’t fight the trend” Most mistakes come from entering against the main trend. If the price is forming higher highs & higher lows, just look for suitable areas to buy. If the price is forming lower highs and lower lows, wait for the opportunity to sell when the price rebounds to resistance. → Principle 1: Do not try to catch the tops or bottoms, but go with the natural market flow. 🔹 2. Identify the “confluence of factors” – where the odds are highest A good entry point often appears where several technical factors intersect. For example: The price returns to a strong support or resistance area, Touching the main trend line (Trendline), Price interaction with Fibonacci retracement 0.618, And the appearance of a clear reversal candlestick pattern (such as Pin Bar or Engulfing). When 2 to 3 factors come together at the same point, the probability of a successful trade rises significantly – and this is exactly where a professional trader moves. 🔹 3. Wait for confirmation – “Don’t rush, don’t guess” The biggest mistake individual traders make is to enter based on feeling alone. Instead, wait for confirmation from Price Action, such as: The appearance of a strong reversal candle, Or a false breakout followed by a bounce in the direction of the main trend. Remember: the market always sends signals before a strong move, the question is: Do you have enough patience to see it?
بیت کوین در آستانه جهش بزرگ: آماده حمله به سقف ۱۱۰,۶۰۰ دلار؟
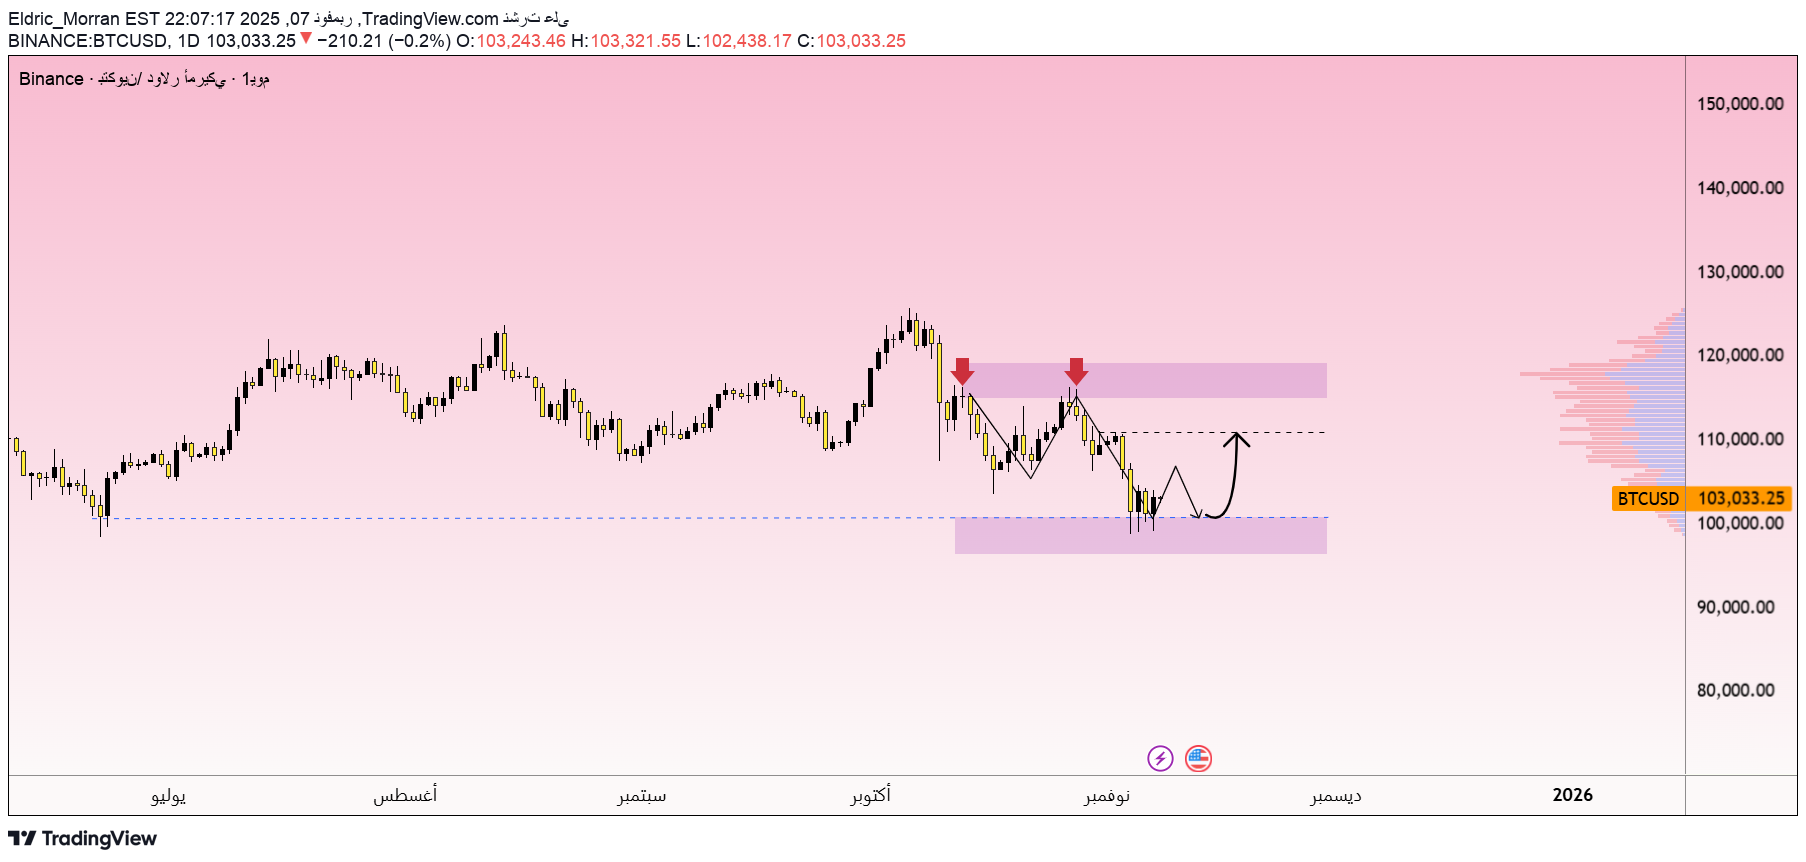
Bitcoin price is currently moving around the $100,700 support area, where the price has shown repeated positive interactions during recent sessions. The selling pressure appears to have dissipated, and the market is starting to show signs of selling absorption, indicating a possible recovery soon. The current price structure shows that a short-term consolidation phase is forming, with a clear appearance of the inverted shoulder-head-shoulder pattern on the 4-hour time frame. If the price continues to hold above this area, I expect Bitcoin to bounce to test the resistance at $110,600, an area where previous highs intersect with a strong supply zone. When this resistance is successfully breached, the upward trend will be confirmed, which may open the way for a medium-term recovery phase, targeting the $115,000 area in the next phase.
بیت کوین (BTC/USDT) پس از حمایت ۹۹,۶۰۰ دلار: آیا هدف بعدی ۱۰۵,۳۰۰ دلار است؟
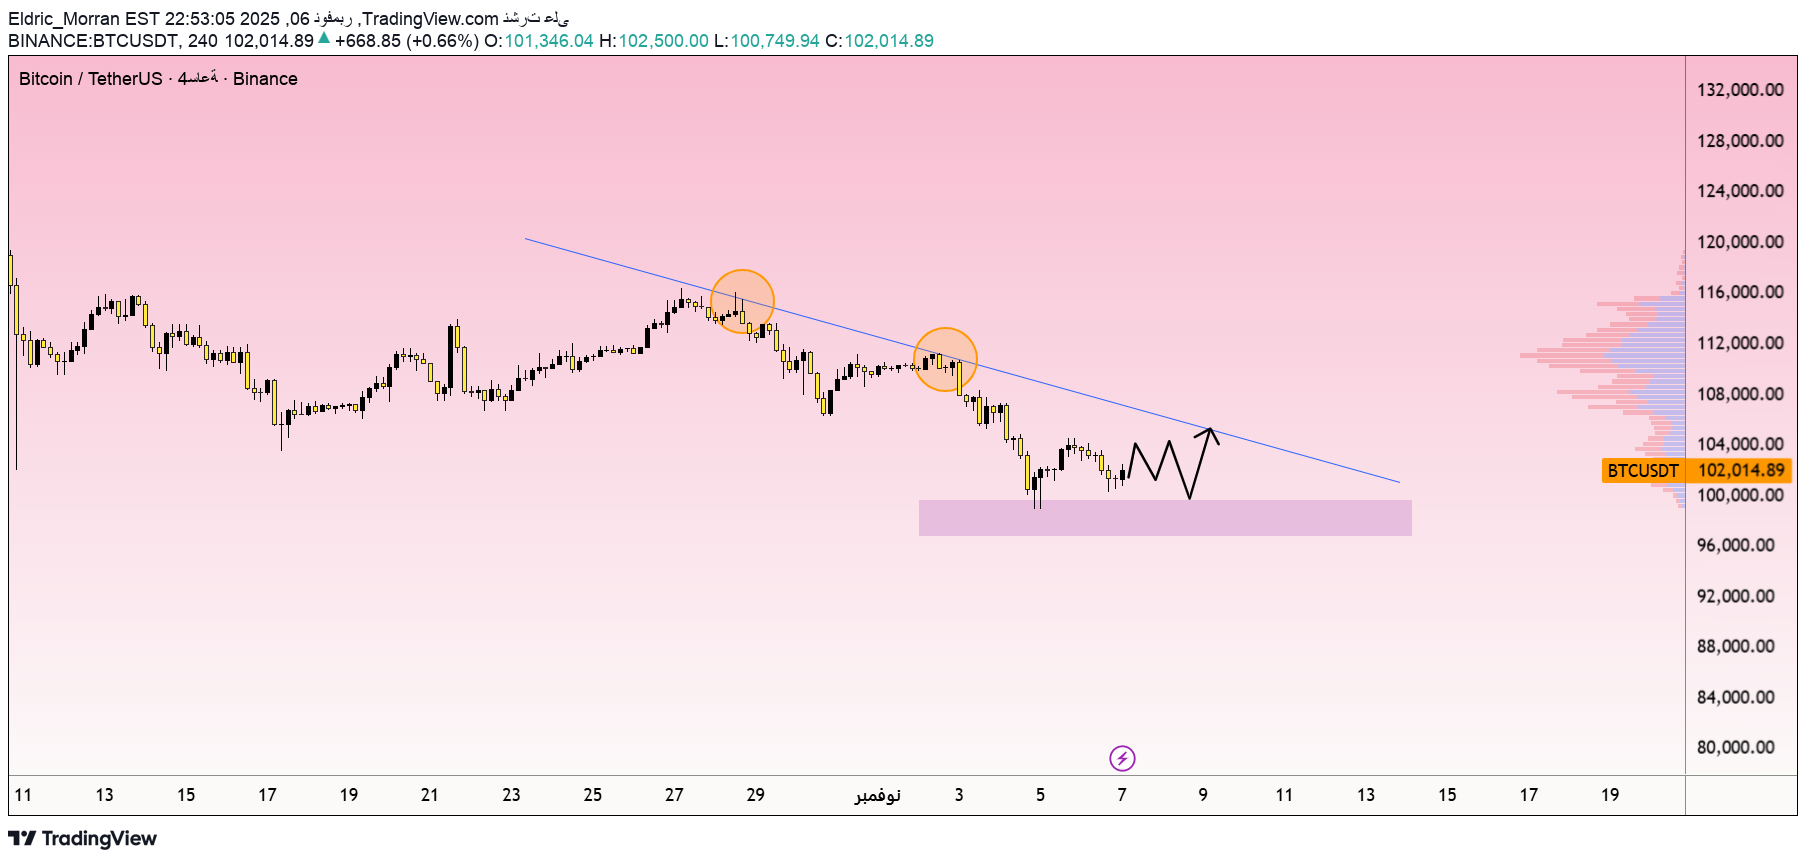
After touching the support at $99,600, BTC/USDT started to rebound and showed signs of a price increase. The next resistance is $105,300, and if it is broken, BTC may continue to rise strongly. Although still in a down channel, this recovery indicates the possibility of a price breakout, creating a trading opportunity with higher targets. If it fails to break above $105,300, BTC may fall back to lower support levels. With the current positive signals, there is a high probability that BTC will continue to rise, and traders should follow these support and resistance levels to take advantage of the available opportunities.
طلاء يكسر حاجز 4100 دلار: راز جهش قیمت در ضعف دلار آمریکا و ترس از بحران!
The price of gold is currently in an upward trend supported by a number of positive factors in the market. The weakness of the US dollar and increased demand for safe havens due to concerns about the US government shutdown have strengthened the appeal of gold, which is considered a safe investment vehicle in times of instability. Issues related to tariffs and uncertainty about economic policies also contribute to gold's attractiveness. Technically, gold is currently trading in a clear uptrend, with support points at $3,930 and the next resistance at $4,100. If gold continues to maintain this bullish momentum, a break above the $4,100 level seems a strong possibility. Moreover, the US Federal Reserve's decision to cut interest rates for the second time this year and market expectations of another cut in December, reinforce the US dollar's weakness and support gold's bullish trend. Investors should monitor support and resistance areas to develop appropriate trading strategies.
طلای آبشده (XAUUSD) در آستانه صعود: آیا 4040 دلار هدف بعدی است؟
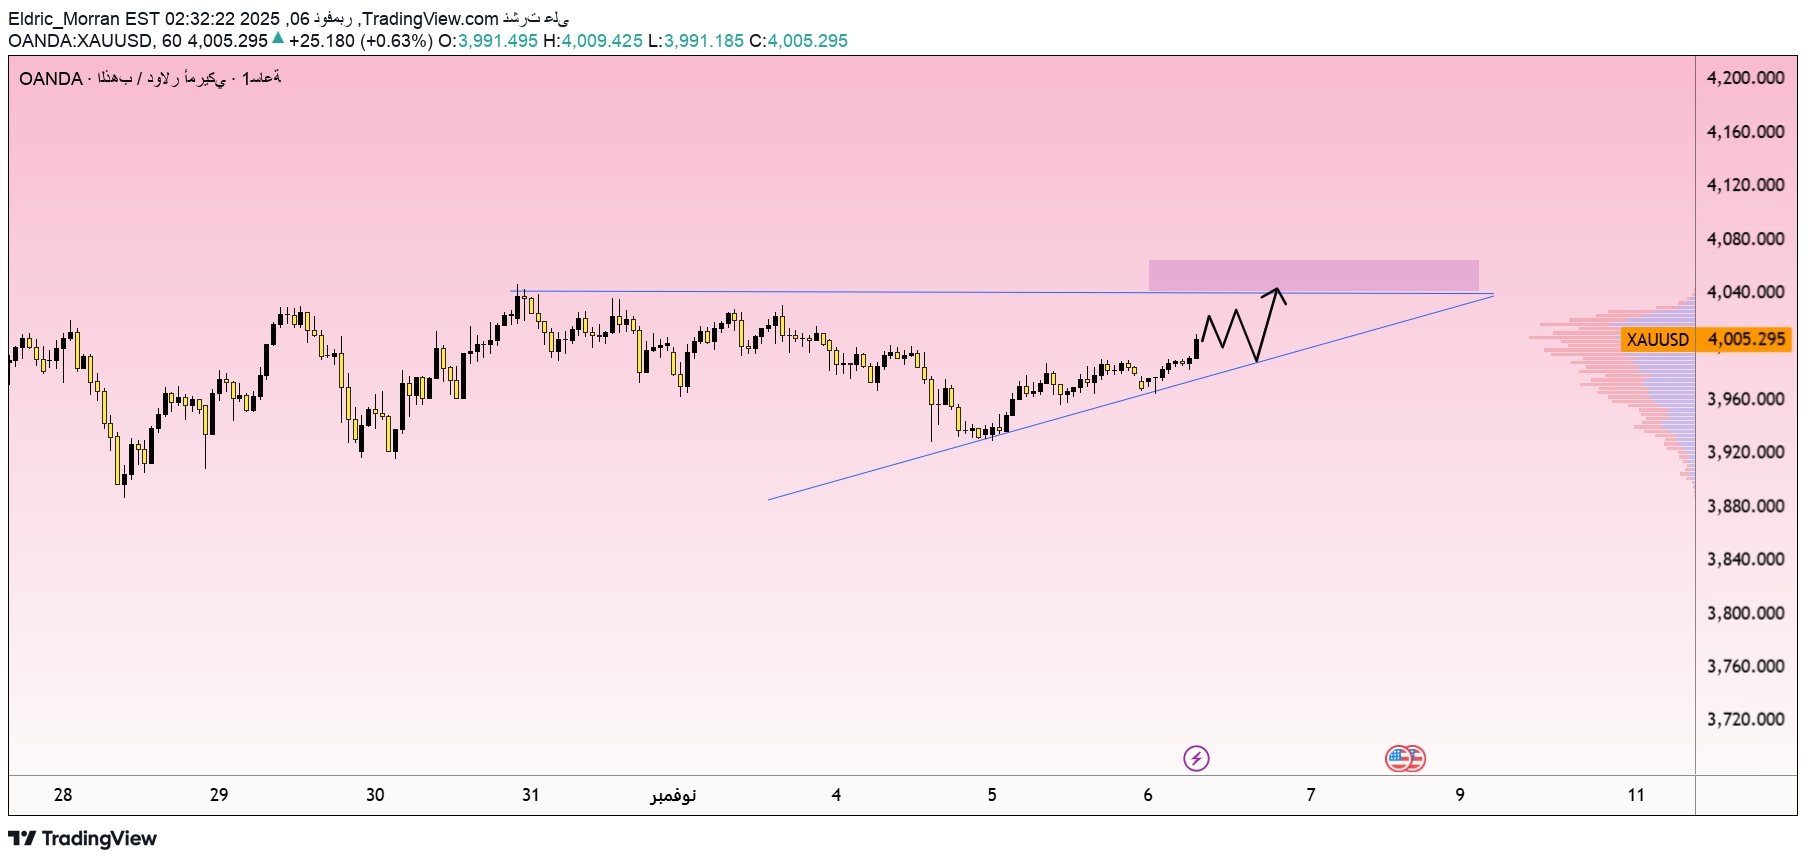
After a brief period of consolidation, gold appears to be gradually regaining momentum. Buyers were able to defend the $3,990 area, making it a strong support base paving the way for the current bullish wave. On the 1H time frame, a clear bullish structure is forming, with prices recording higher highs and lows than before, reflecting the return of purchasing liquidity flow into the market. The $4,040 level represents a critical barrier for gold; Consistently exceeding it could open the way towards $4,070-$4,100 in the near term. If this area fails to penetrate, the market may witness a temporary correction before resuming the upward trend. At the same time, demand for safe assets continues to support the precious metal, which enhances the chances of its continued rise in the short term.
اتریوم (ETH): آیا این جهش کوتاه قبل از سقوط دوباره رخ میدهد؟
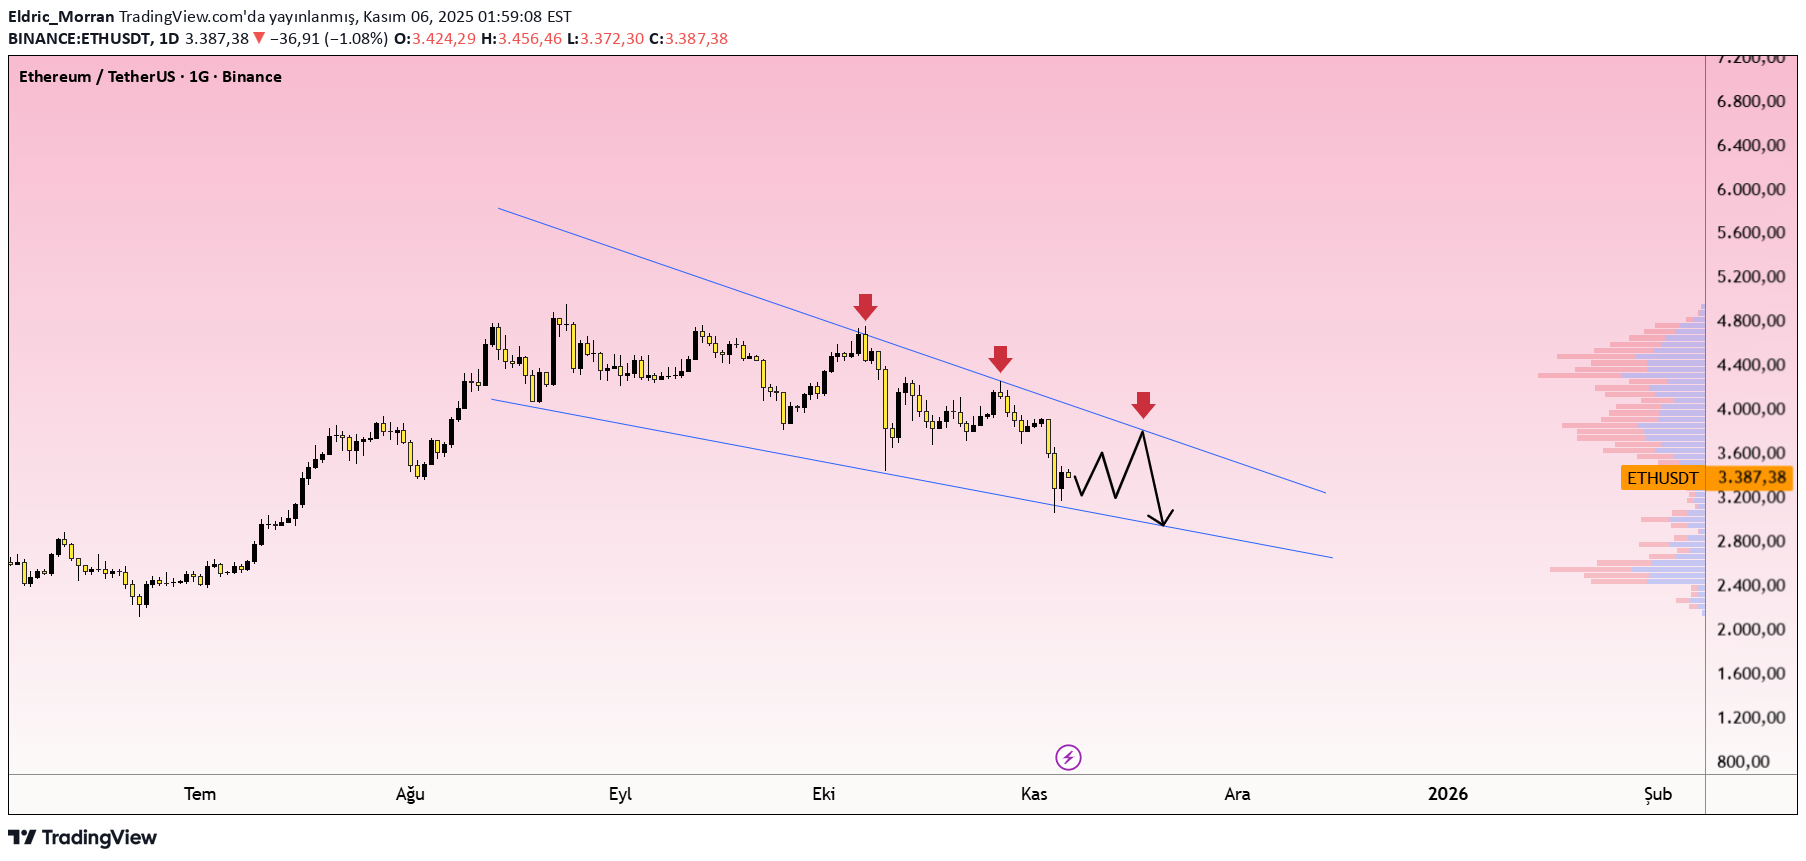
Ethereum is showing signs of recovery after consecutive bearish sessions as buying pressure re-emerged near USD 2,940. This rise could cause the price to rise to the USD 3,810 region and retest the upper resistance line of the falling channel. However, the technical structure shows that the medium-term downtrend is not over yet. ETH Strong selling pressure occurs whenever resistance touches the trend line — a signal that the bears still control the market. Therefore, after the price rises to the USD 3,810 region, the selling pressure is likely to return and the price may retest the previous low near USD 2,940. In summary: ETH is in a short-term recovery phase, but the main trend is still downward. This move could be a “breathing” phase before the market continues a deeper decline.
طلا (XAUUSD) دوباره تحت فشار: آیا سقوط به ۳۸۰۰ دلار قطعی است؟
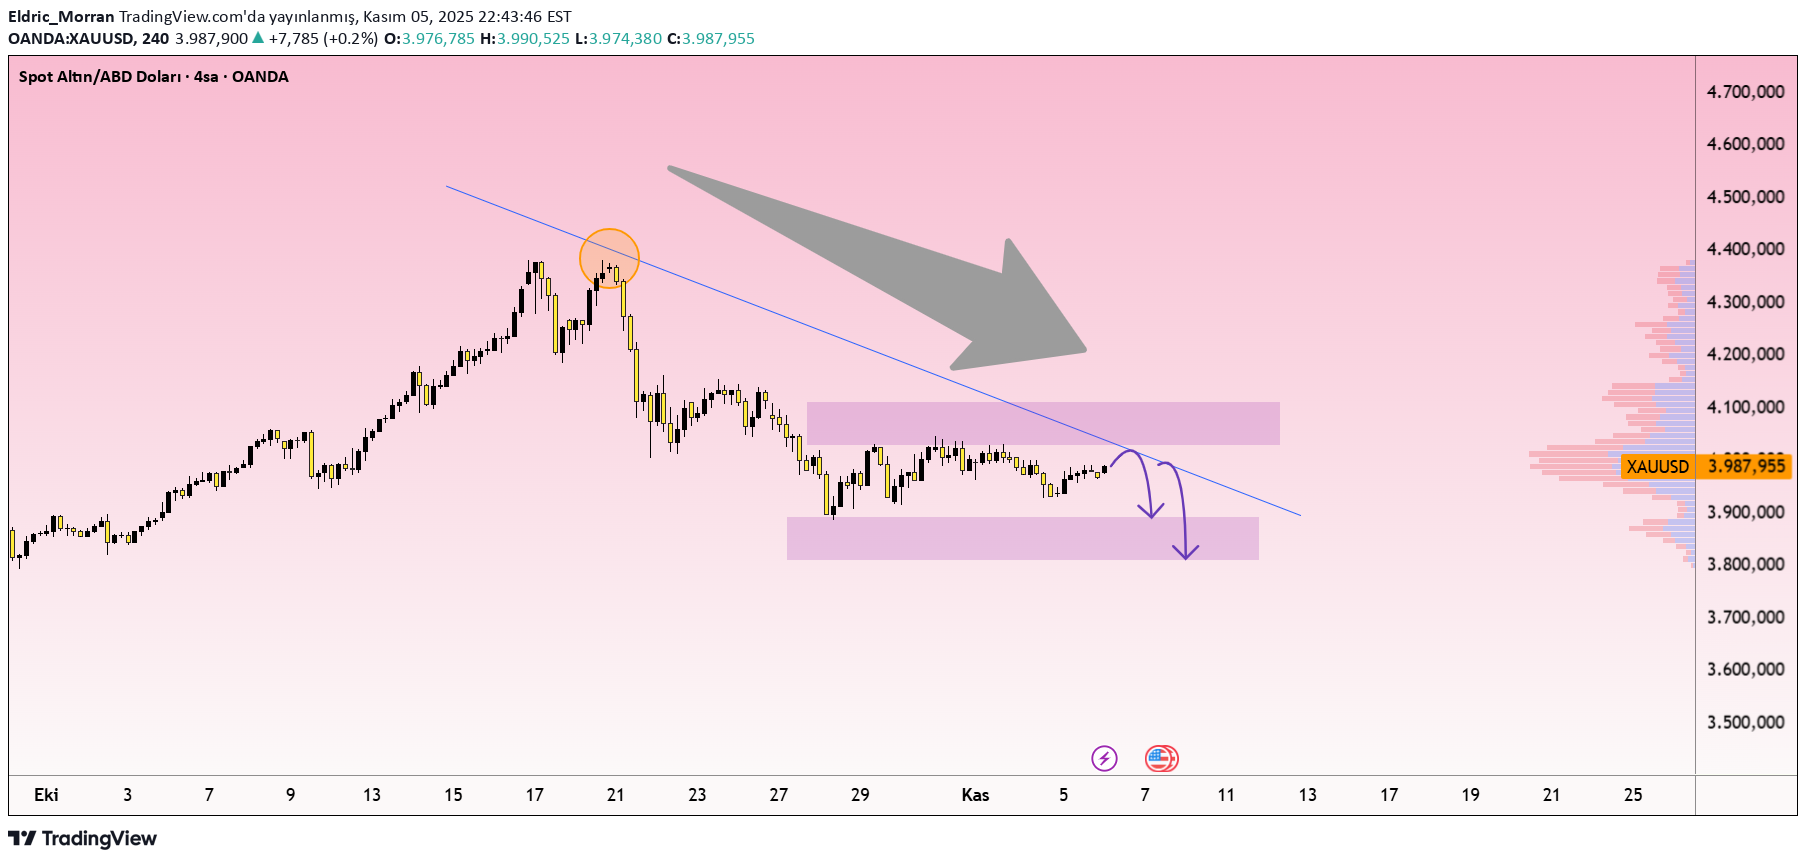
The gold price rose slightly in the middle of the week despite US employment data coming in well above expectations. However, behind this increase, there are signals that clearly show that the market has lost its purchasing power and the dollar continues to gain strength. The ADP report showed the U.S. created 42,000 new jobs, well above the 32,000 predicted. Additionally, ISM Services PMI data was announced as 52.4 — indicating that the economy remains consistently strong. This makes it difficult for the Fed to cut interest rates anytime soon and causes USD and bond yields to rise — a factor that usually weighs on gold. On the 4-hour chart, the gold price is restrained by the falling trend line drawn from the previous peak. The USD 4,020 level stands out as a strong resistance point and every contact creates harsh rejection signals. The current scenario shows that there is a high probability that gold will test the 4,020 level with a slight correction and then retreat to USD 3,800.
سقوط البيتكوين بعد 100 ألف دولار: هل انتهى زمن الصمود وبدأ الهبوط نحو الذعر؟
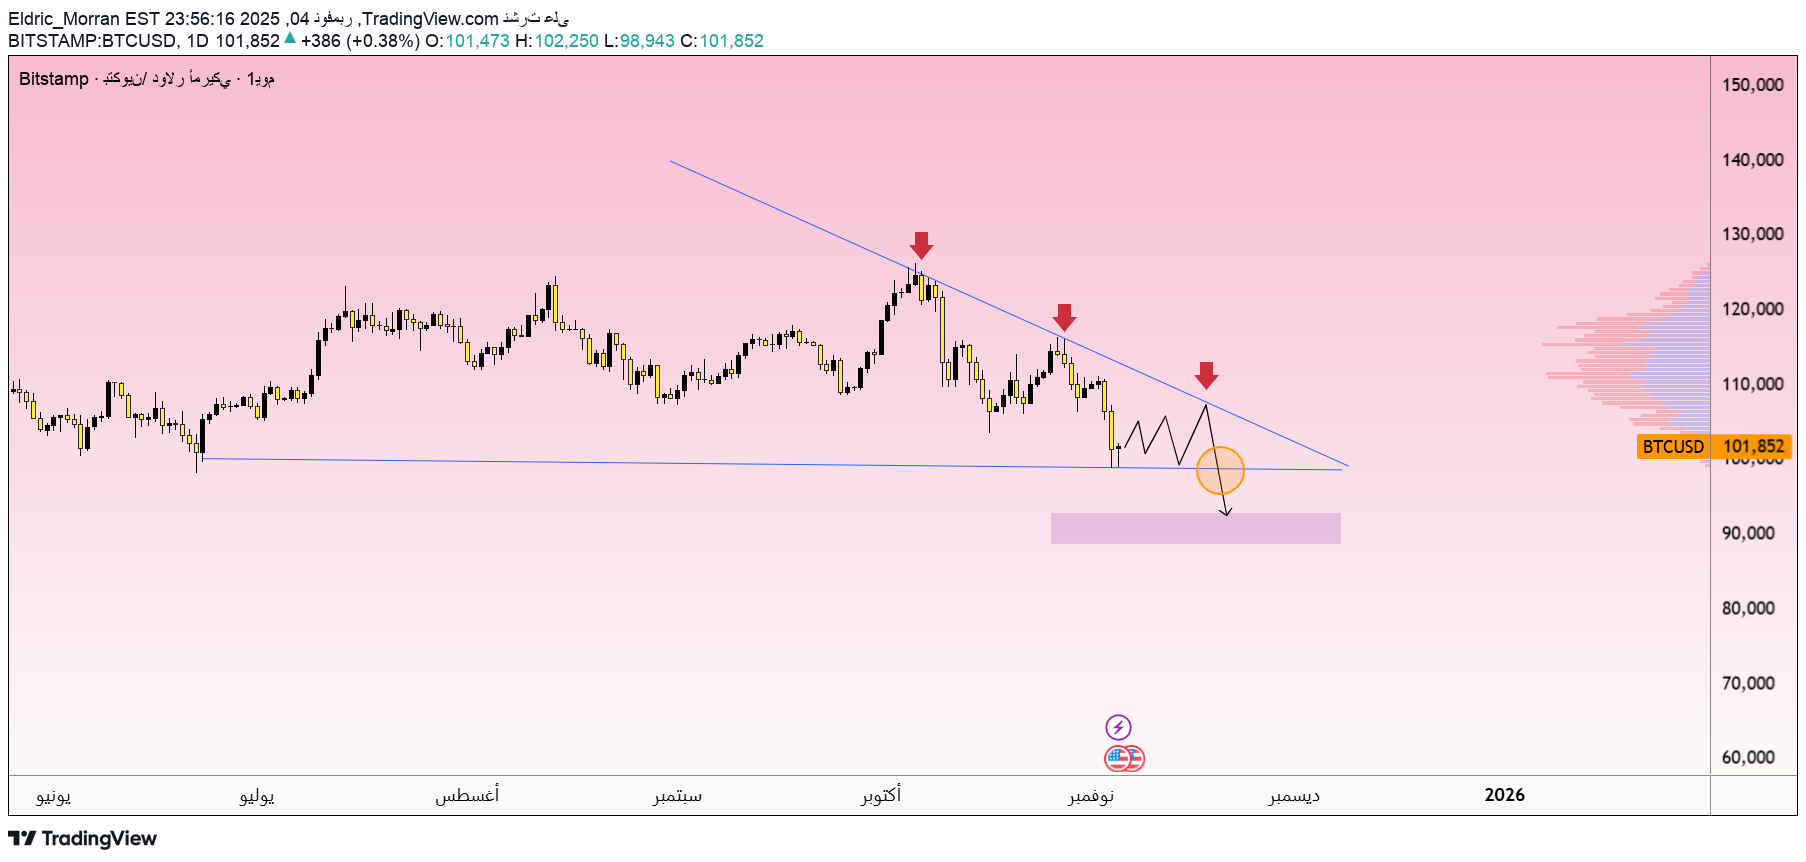
This is no longer just a normal corrective move, this time Bitcoin made the whole market hold its breath. After many months of stability above the $100,000 barrier, the psychological wall finally broke, beginning a new phase in which only those with nerves of steel dare to remain. The reason is clear: “whales” – those who control the rhythm of the market – liquidated positions worth more than $45 billion, unleashing a massive liquidation wave that swept the crypto world like a domino effect. Meanwhile, expectations of an interest rate cut by the Federal Reserve in December gradually began to fade, with capital flowing towards the safe-haven US dollar, increasing pressure on weak digital assets. On the technical chart, Bitcoin appears trapped inside a descending triangle, like a monster backed into a corner. The downtrend line extending from the August highs is like an invisible rope restricting every timid rebound attempt around the $107,600 level – where sellers still remain coolly in control. If this scenario continues, the price could slide towards the $92,600 area, where there is a layer of old liquidity and defensive buyers waiting anxiously. However, if this barrier is broken, the market will no longer remain a battleground... but rather a long slope towards true panic.
سقوط مدوّی طلا: فشار دلار آمریکا و شکستن حمایتها!
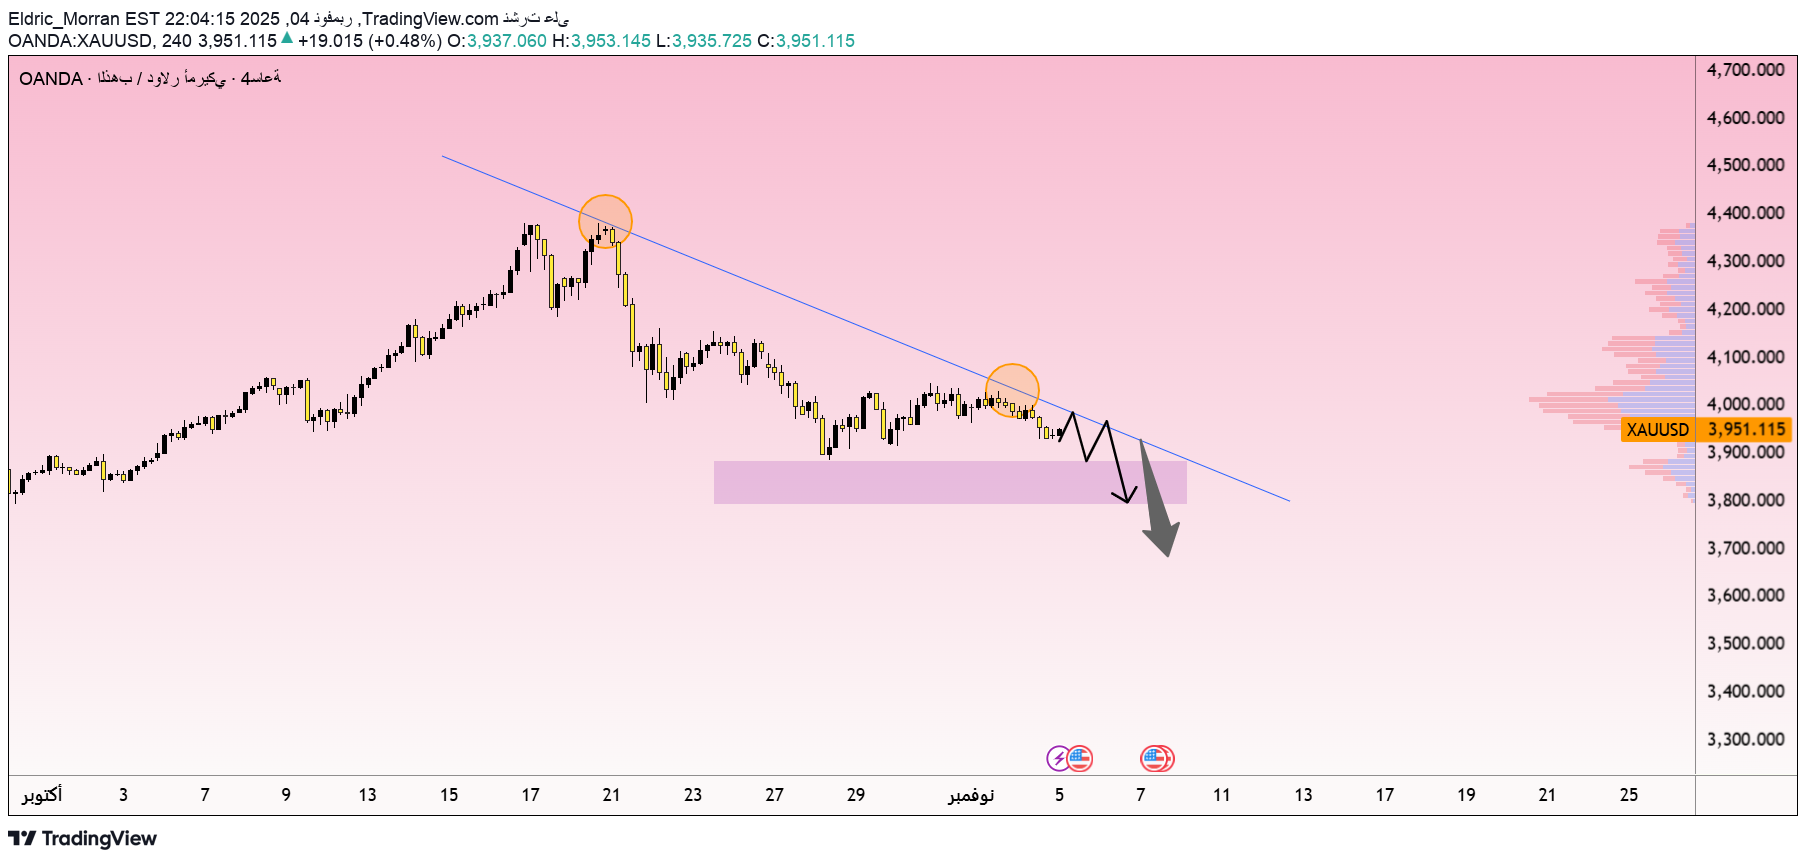
The price of gold fell more than 1% during the session on November 4, while the US dollar rose to its highest level in three months. The strength of the US currency comes from expectations that jobs data from the ADP and the ISM Services Index will show that the US economy remains strong - meaning the Federal Reserve has no reason to rush to ease monetary policy. Expectations are that the ADP report will reach +32K compared to -32K in the previous month, while the ISM Services Index will rise to 50.7. Both indicators are considered positive for the US dollar. As bond yields rise and the dollar strengthens, gold - a non-yielding asset - is under natural downward pressure. Technically, the downtrend is still evident. The downtrend line extending since mid-October is still a strong resistance, as the price is rejected every time it approaches the 3990 area. The support area around 3900 has been tested several times, and if broken, the decline could extend to the next target near 3780. Given the current trend, gold appears to lack the ability to recover sustainably. As long as the US dollar maintains its bullish momentum, XAUUSD will remain under pressure – and a deeper decline is only a matter of time.
Disclaimer
Any content and materials included in Sahmeto's website and official communication channels are a compilation of personal opinions and analyses and are not binding. They do not constitute any recommendation for buying, selling, entering or exiting the stock market and cryptocurrency market. Also, all news and analyses included in the website and channels are merely republished information from official and unofficial domestic and foreign sources, and it is obvious that users of the said content are responsible for following up and ensuring the authenticity and accuracy of the materials. Therefore, while disclaiming responsibility, it is declared that the responsibility for any decision-making, action, and potential profit and loss in the capital market and cryptocurrency market lies with the trader.