
ElaraQuinn
@t_ElaraQuinn

What symbols does the trader recommend buying?
Purchase History
پیام های تریدر
Filter
طلا در آستانه 4100 دلار: آماده جهش بزرگ بعدی با تمرکز بر دادههای CPI!
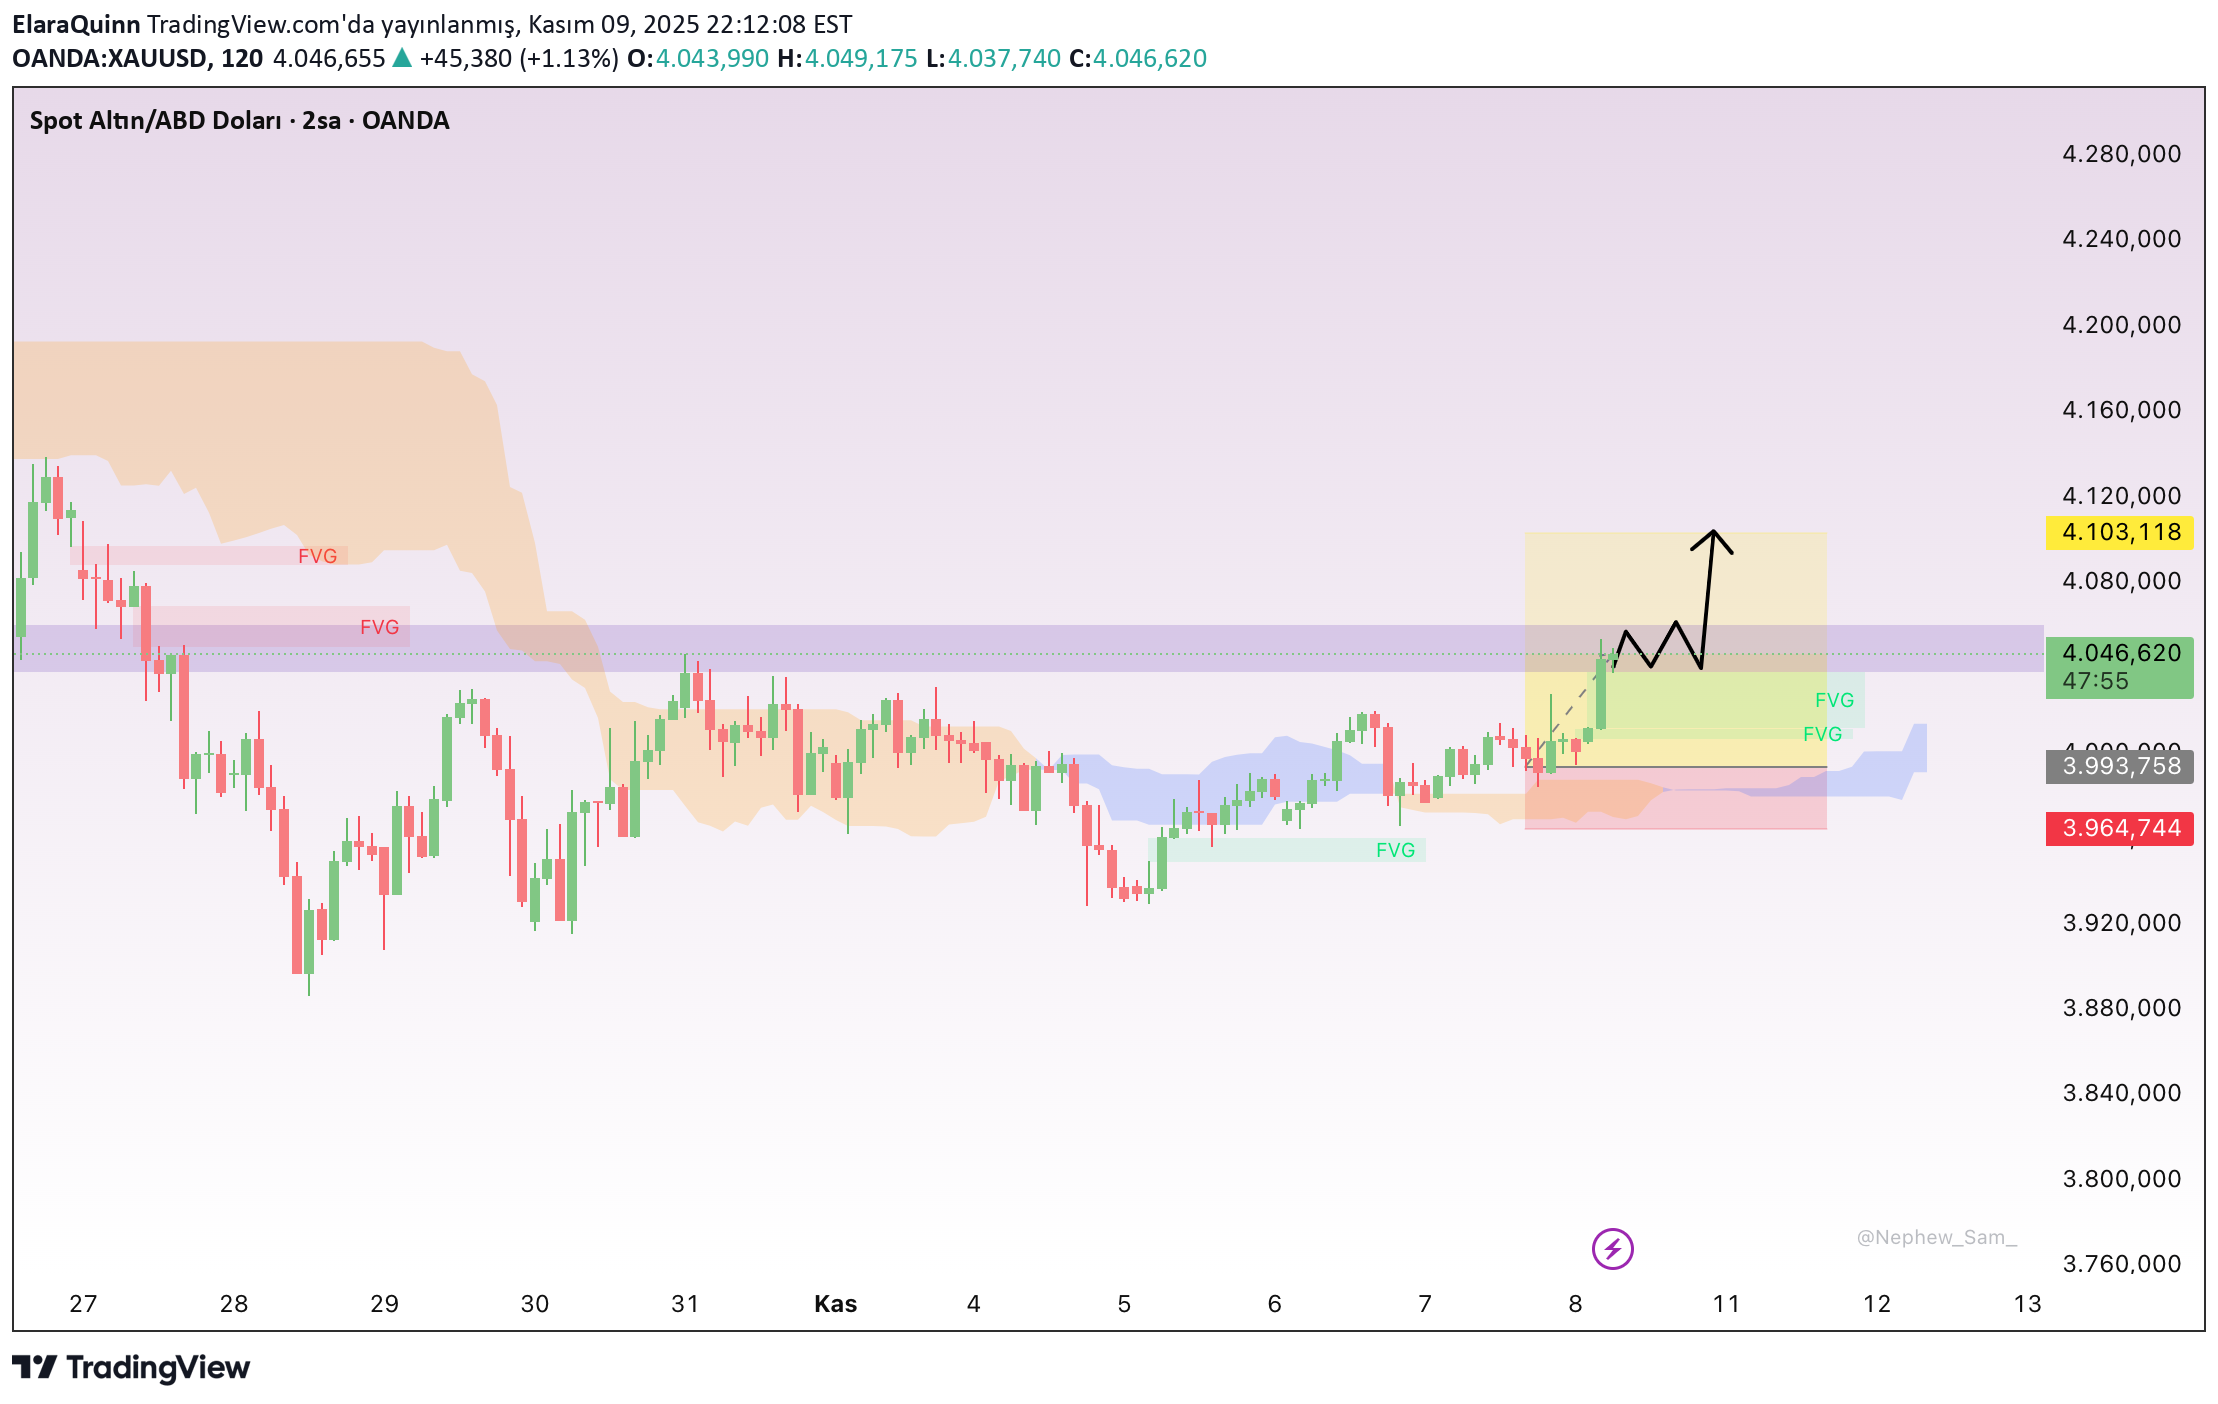
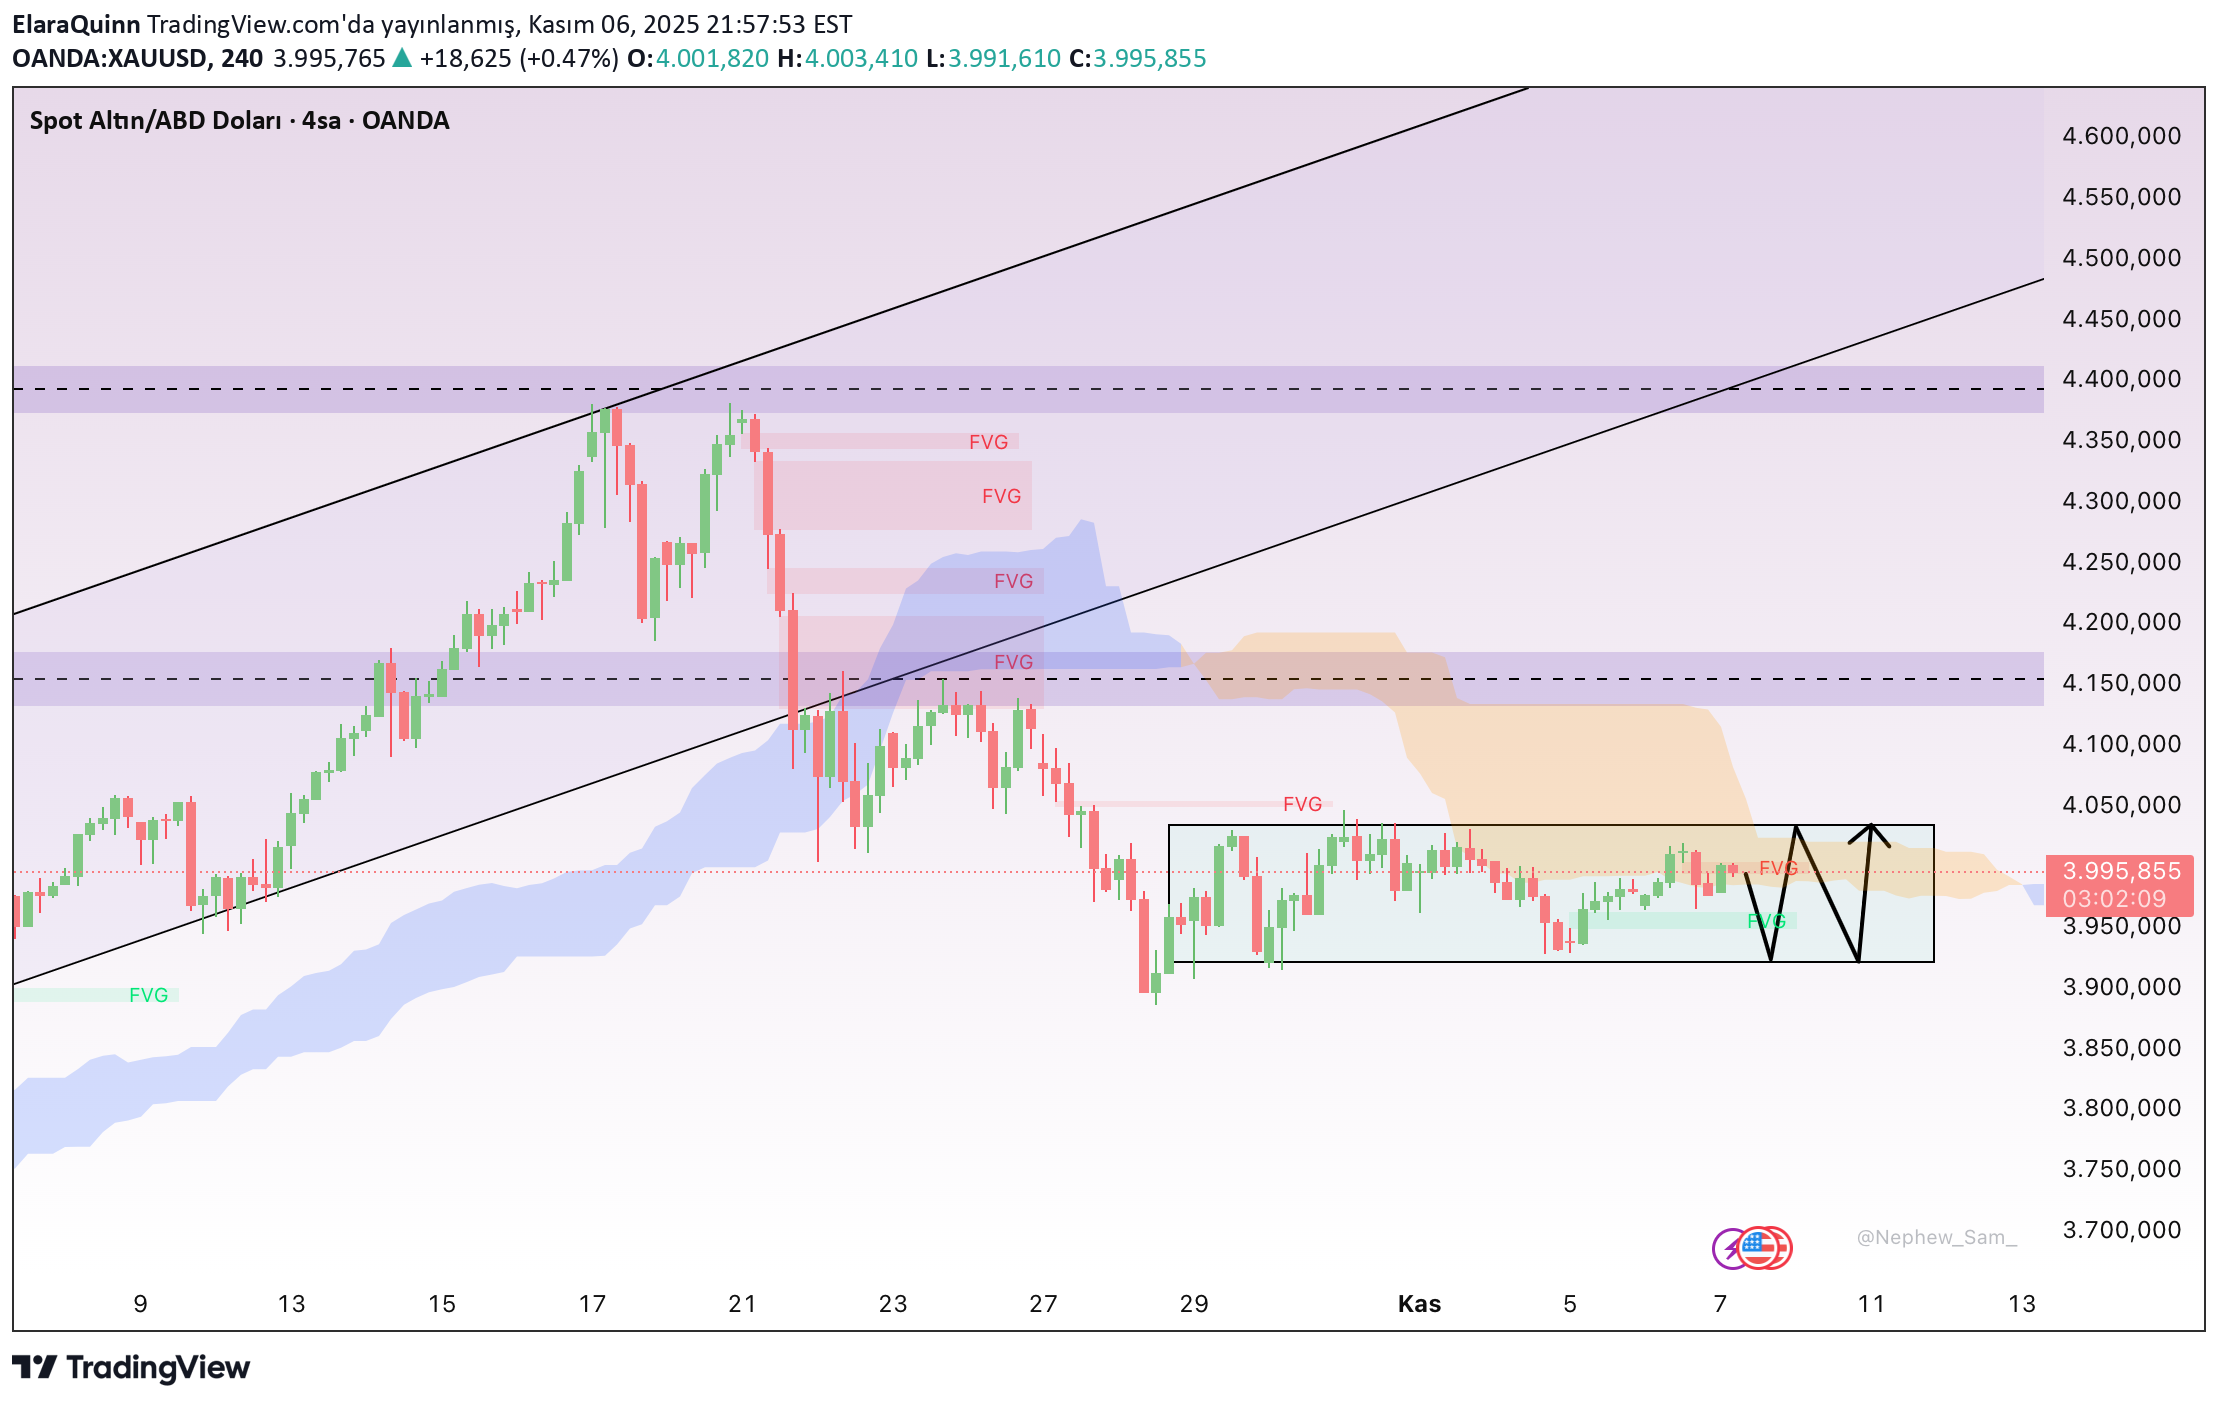
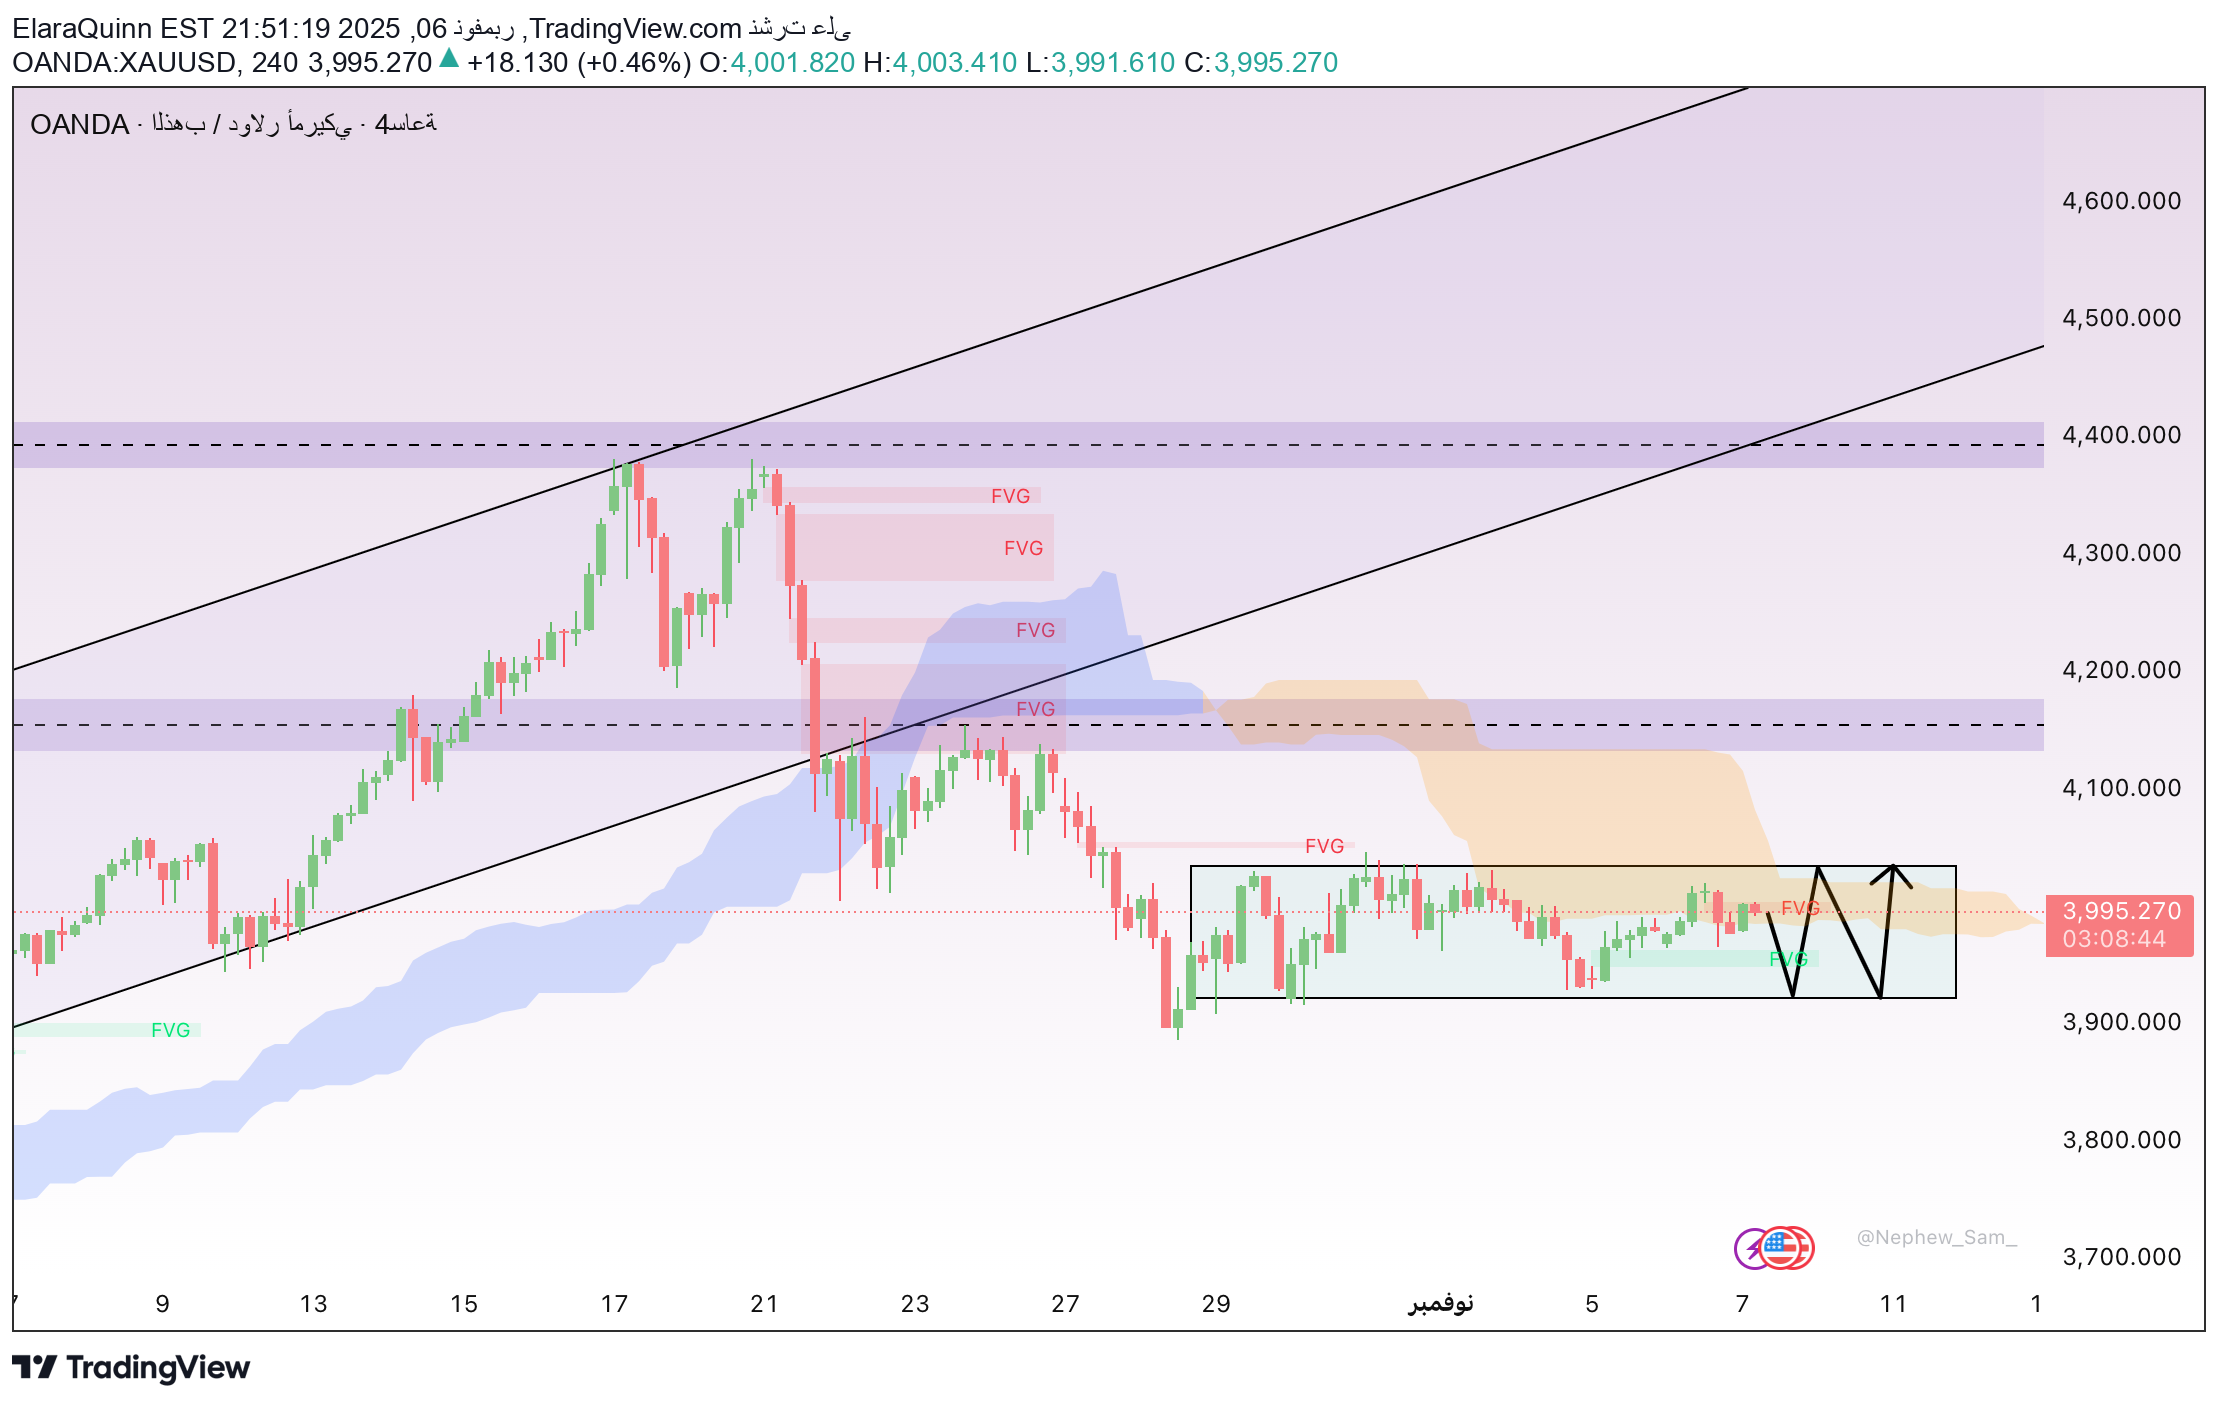
Gold (XAUUSD) is currently trading around $4,040–4,050/oz and is within the key resistance zone formed from the previous peak. Previously, gold made a strong recovery from the $3,940–3,960 levels, revealing buyer pressure following a liquidity sweep. The Fair Value Gap (FVG) $3,980–$4,020 has been filled and based on price action, supply testing occurs, usually with a slight pullback before the next bullish wave. In the short term, the price can be expected to retreat to $4,020–4,000 levels, followed by a rise to $4,085–4,100 levels. The market's focus is currently on the US Consumer Price Index (CPI). A CPI below expectations could strengthen the possibility of an early Fed rate cut, weakening the USD and providing support to gold. At the same time, geopolitical tensions and central bank purchases continue to support the medium-term upward trend. Gold is currently in a short-term consolidation period around $4,040 and with favorable macro data, it could start a new bullish wave towards $4,160–4,200 levels.
طلاء يستعد للصعود: هل نشهد قفزة قرب 4200 دولار؟
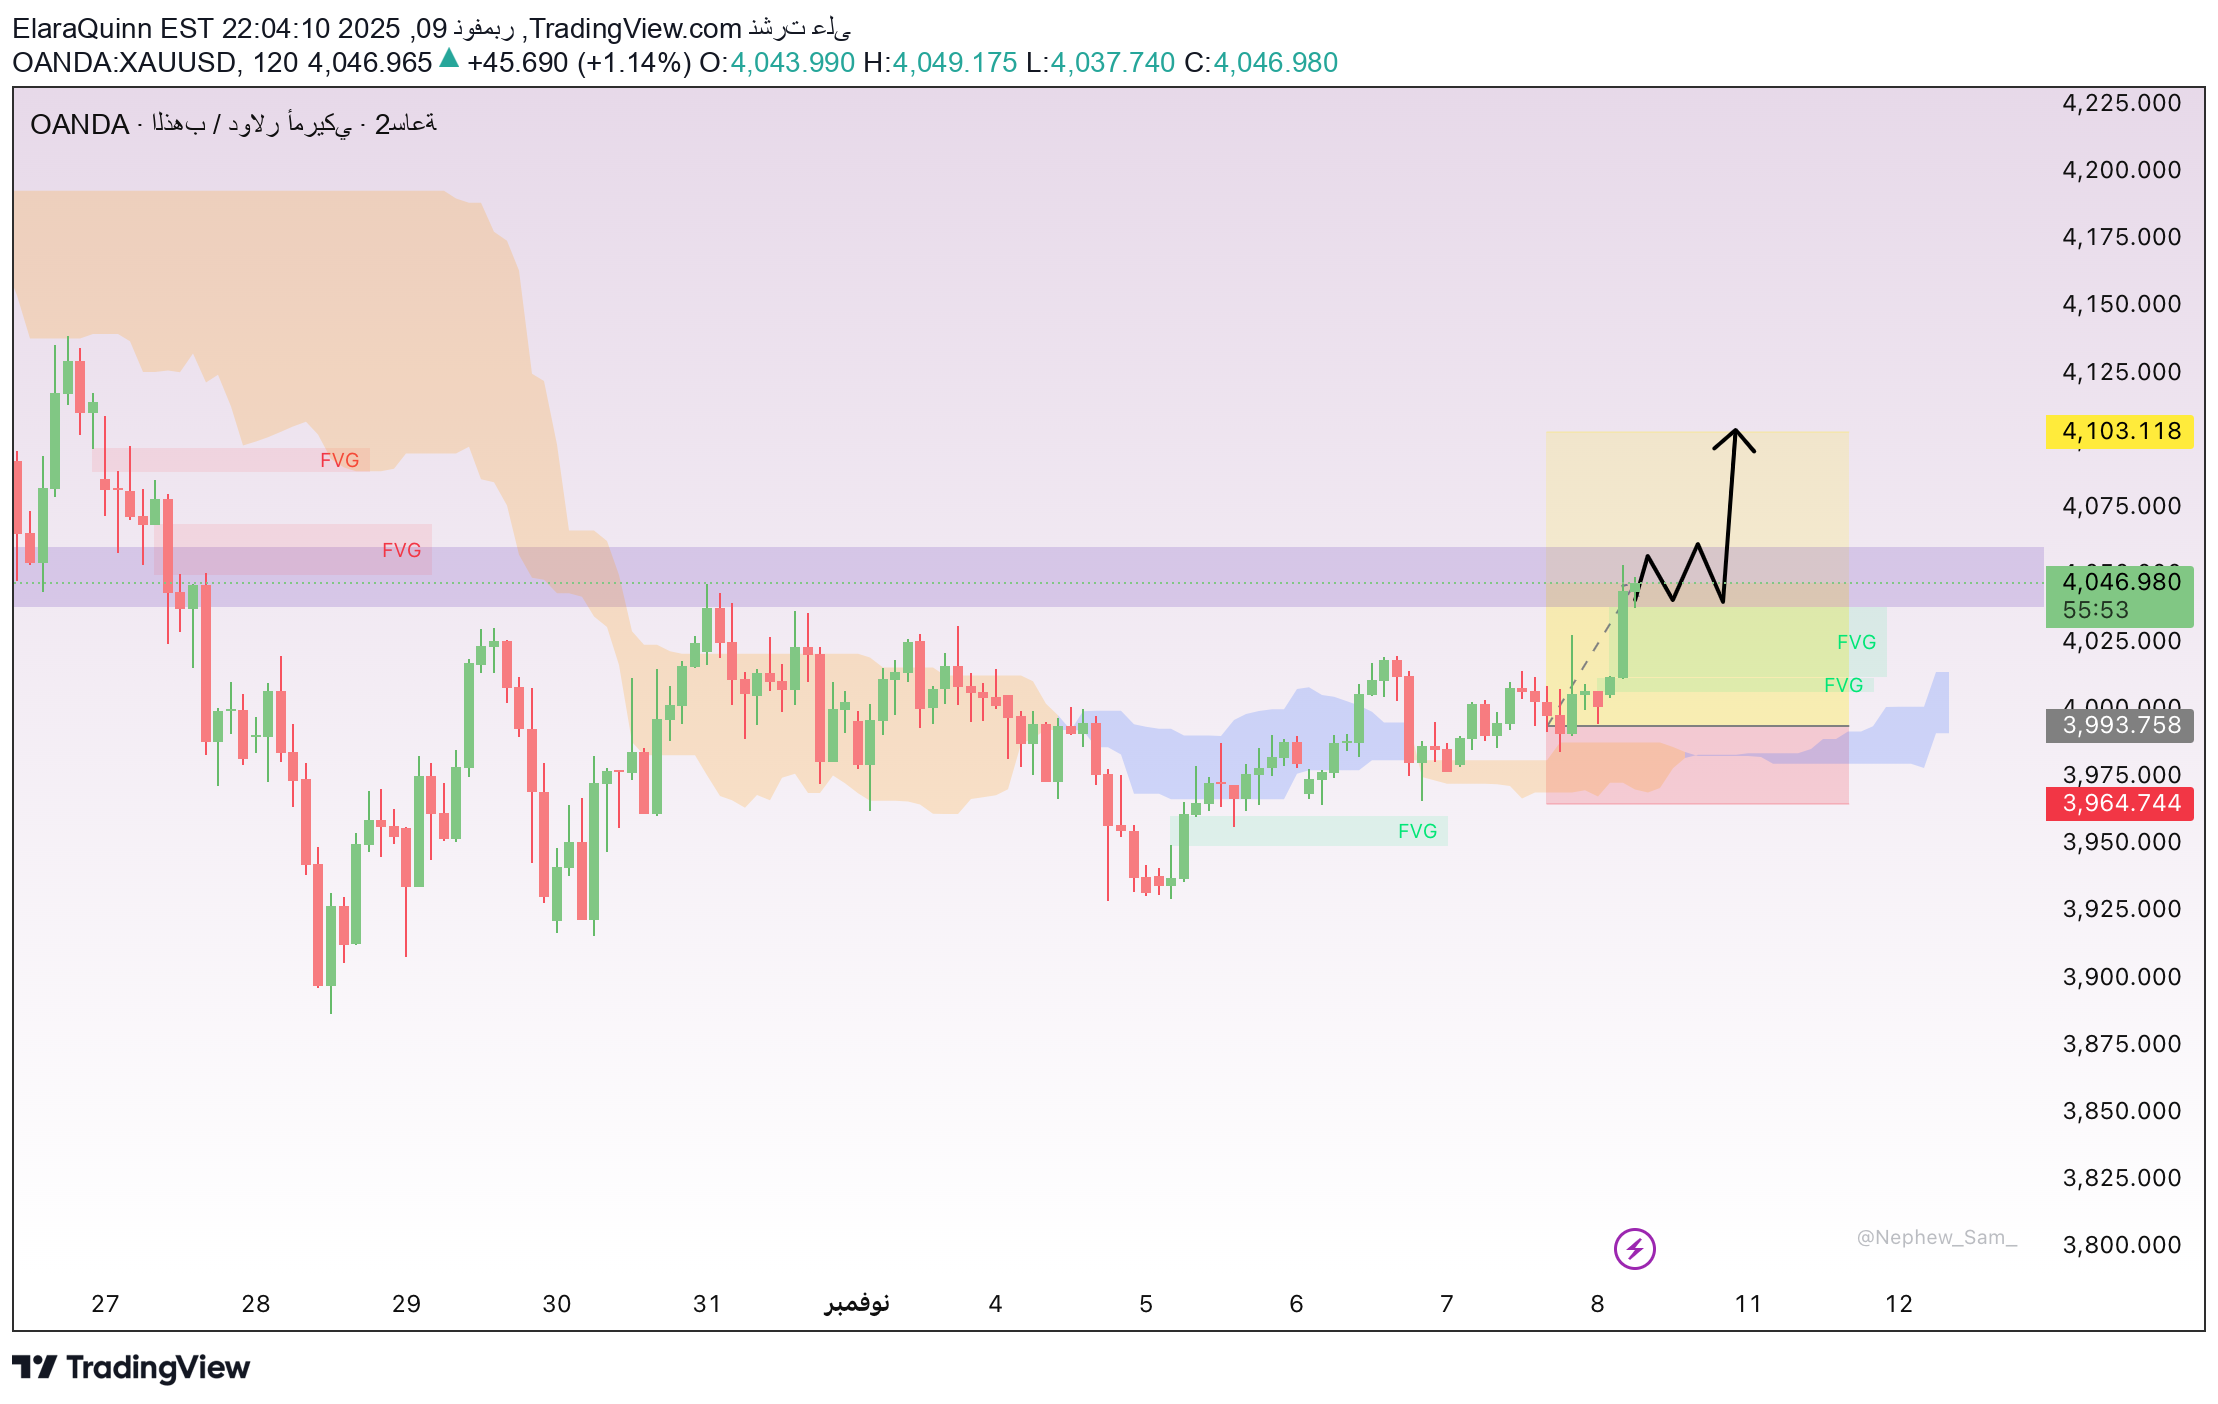
Gold (XAUUSD) is currently trading around $4,040–4,050 per ounce at an important resistance area. The market saw a strong bounce from 3,940–3,960 reflecting strong buying after liquidity was liquidated. The fair value gap $3,980–4,020 has closed, and a slight correction is expected to test supply areas before the next bullish wave. In the short term, the price may fall to $4,020-4,000 and then bounce back towards $4,085-4,100. The focus is on US Consumer Price Index (CPI) data, which may influence monetary policy expectations. A below-expected CPI reading will weaken the dollar and support gold, while geopolitical tensions and central bank buying reinforce the positive trend in the medium term. Gold is in a short-term consolidation phase near $4,040, and may see a rally towards $4,160-4,200 if economic conditions improve.
أسرار حركة الأسعار: كيف يتلاعب "المال الذكي" بوقف الخسارة (SMC)؟
The price never moves randomly. Every rise or fall is a result of the large capital, planned movements, and liquidity provided by small traders. Smart Money Concept (SMC) is not a trend forecasting tool; Rather, it is the art of reading the flow of money, and understanding the logic behind price movements and market psychological behaviors. When you place a stop-loss, you may think you are protecting your capital, but in reality, you are providing smart money with fuel to accumulate and expand positions, so your orders turn into an opportunity to move the market. Market algorithm – 3 basic steps 1. BoS – Break of Structure When the current trend loses strength, the price breaks bottoms in an uptrend or tops in a downtrend. This indicates the weakness of small traders and the emergence of liquidity necessary for the next step. Smart money exploits this breakout to collect stop-loss orders and pending orders, and prepare to accumulate. 2. ChoCh – Change of Character After BoS, the market begins to change control: the power of sellers decreases and buyers appear. This movement may not be large, but it indicates a fundamental change in the flow of money. The smart money is using this time to surreptitiously accumulate positions, preparing for an explosion that most traders will not notice. Order flows (Order Flow), volume, and hidden pending orders provide very valuable signals about where liquidity is waiting. 3. Order Block – remaining smart money order areas Order Block are price areas where the smart money has participated strongly but has not fully released its positions. The price usually returns to test this area before completing the trend. Seeing an Order Block means you read the liquidity map and know exactly where the smart money wants to expand or distribute its positions. At this point, the price responds strongly, but often small traders do not notice the opportunity or enter in the wrong direction. Market Psychology - The Power of Smart Money Smart money doesn't follow emotions, it takes advantage of audience psychology: Fear: Traders close their positions early, providing cheap liquidity. Greed: Traders enter out of FOMO, false highs are formed and distribution takes place. Hope: Traders hold positions when the price turns, giving the smart money a chance to implement its plan. Two views of the market – the public versus the smart money Average Trader: “The market is going down, should I sell or hold?” Smart Money: “The market has accumulated sufficient liquidity, stop-loss orders and pending orders have been activated. This is the best time to accumulate.” Conclusion – learn to move with the smart money Understanding the concept of smart money means understanding the algorithm behind every price movement. When you master BoS, ChoCh and Order Block, you will no longer be following the market, but moving with the flow of big money, knowing when to enter and when to wait. Test yourself: When you see a bearish candle, do you notice the smart money quietly accumulating, or are you still reacting to the crowd's emotions?
پشت پرده سقوط بازار: پول هوشمند چگونه بی سر و صدا موقعیت میسازد؟ (آموزش SMC)
Price never moves randomly. Every rise or fall is the result of large capital, planned movements and liquidity provided by small traders. Smart Money Concept (SMC) is not a trend forecasting tool; Reading money flow is the art of understanding the logic and market psychology behind price movements. You may think that you are protecting your capital when you place a stop-loss, but in fact you are providing fuel for Smart Money to accumulate and expand positions, your orders become an opportunity to move the market. Market Algorithm – 3 Basic Steps 1. BoS – Break of Structure When the current trend loses its strength, the price breaks the bottoms in a rising trend and the tops in a falling trend. This indicates that small traders are weakened and the liquidity needed for the next step becomes available. Smart Money uses this breakout to collect stop-loss and pending orders, preparing for accumulation. 2. ChoCh – Change of Character After BoS, the market changes control: selling force decreases, buyers appear. Although this movement is not large, it signals a fundamental change in the flow of money. During this period, unnoticed by most traders, Smart Money secretly accumulates positions and prepares to explode. Order Flow, volume and hidden limit orders provide invaluable signals as to where money is waiting to flow. 3. Order Block – Remaining Order Areas of Smart Money Order Blocks are price areas where Smart Money is strongly involved but does not fully release its positions. The price often retests this area before the trend continues. Seeing the Order Block means reading the liquidity map and understanding where Smart Money wants to expand or distribute positions. At this point the price reacts strongly, but small traders often do not recognize the opportunity or enter positions in the wrong direction. Market Psychology – The Power of Smart Money Smart Money doesn't follow emotions; uses community psychology: Fear: Traders exit early, providing cheap liquidity. Greed: Traders enter with FOMO, false tops form and distribution occurs. Hope: Traders hold the position when the price reverses and find a return opportunity according to the Smart Money plan. Two Views of the Market – Community vs Smart Money Normal trader: "The market is falling, should I sell or wait?" Smart Money: "The market has accumulated sufficient liquidity, stop-loss and limit orders have been triggered. This is the best time to collect." Conclusion – Learn to Act with Smart Money To understand the Smart Money Concept is to understand the algorithm behind every price movement. When you learn BoS, ChoCh and Order Block, you become someone who moves with the big money flow, not just following the market; You know when to enter and when to wait. Test yourself: When you see a bearish candle, do you notice that Smart Money is quietly collecting, or are you still reacting to community sentiment?
بیت کوین در کمین: در انتظار انفجار یا سقوط؟ (تحلیل نوسانات بیت کوین)
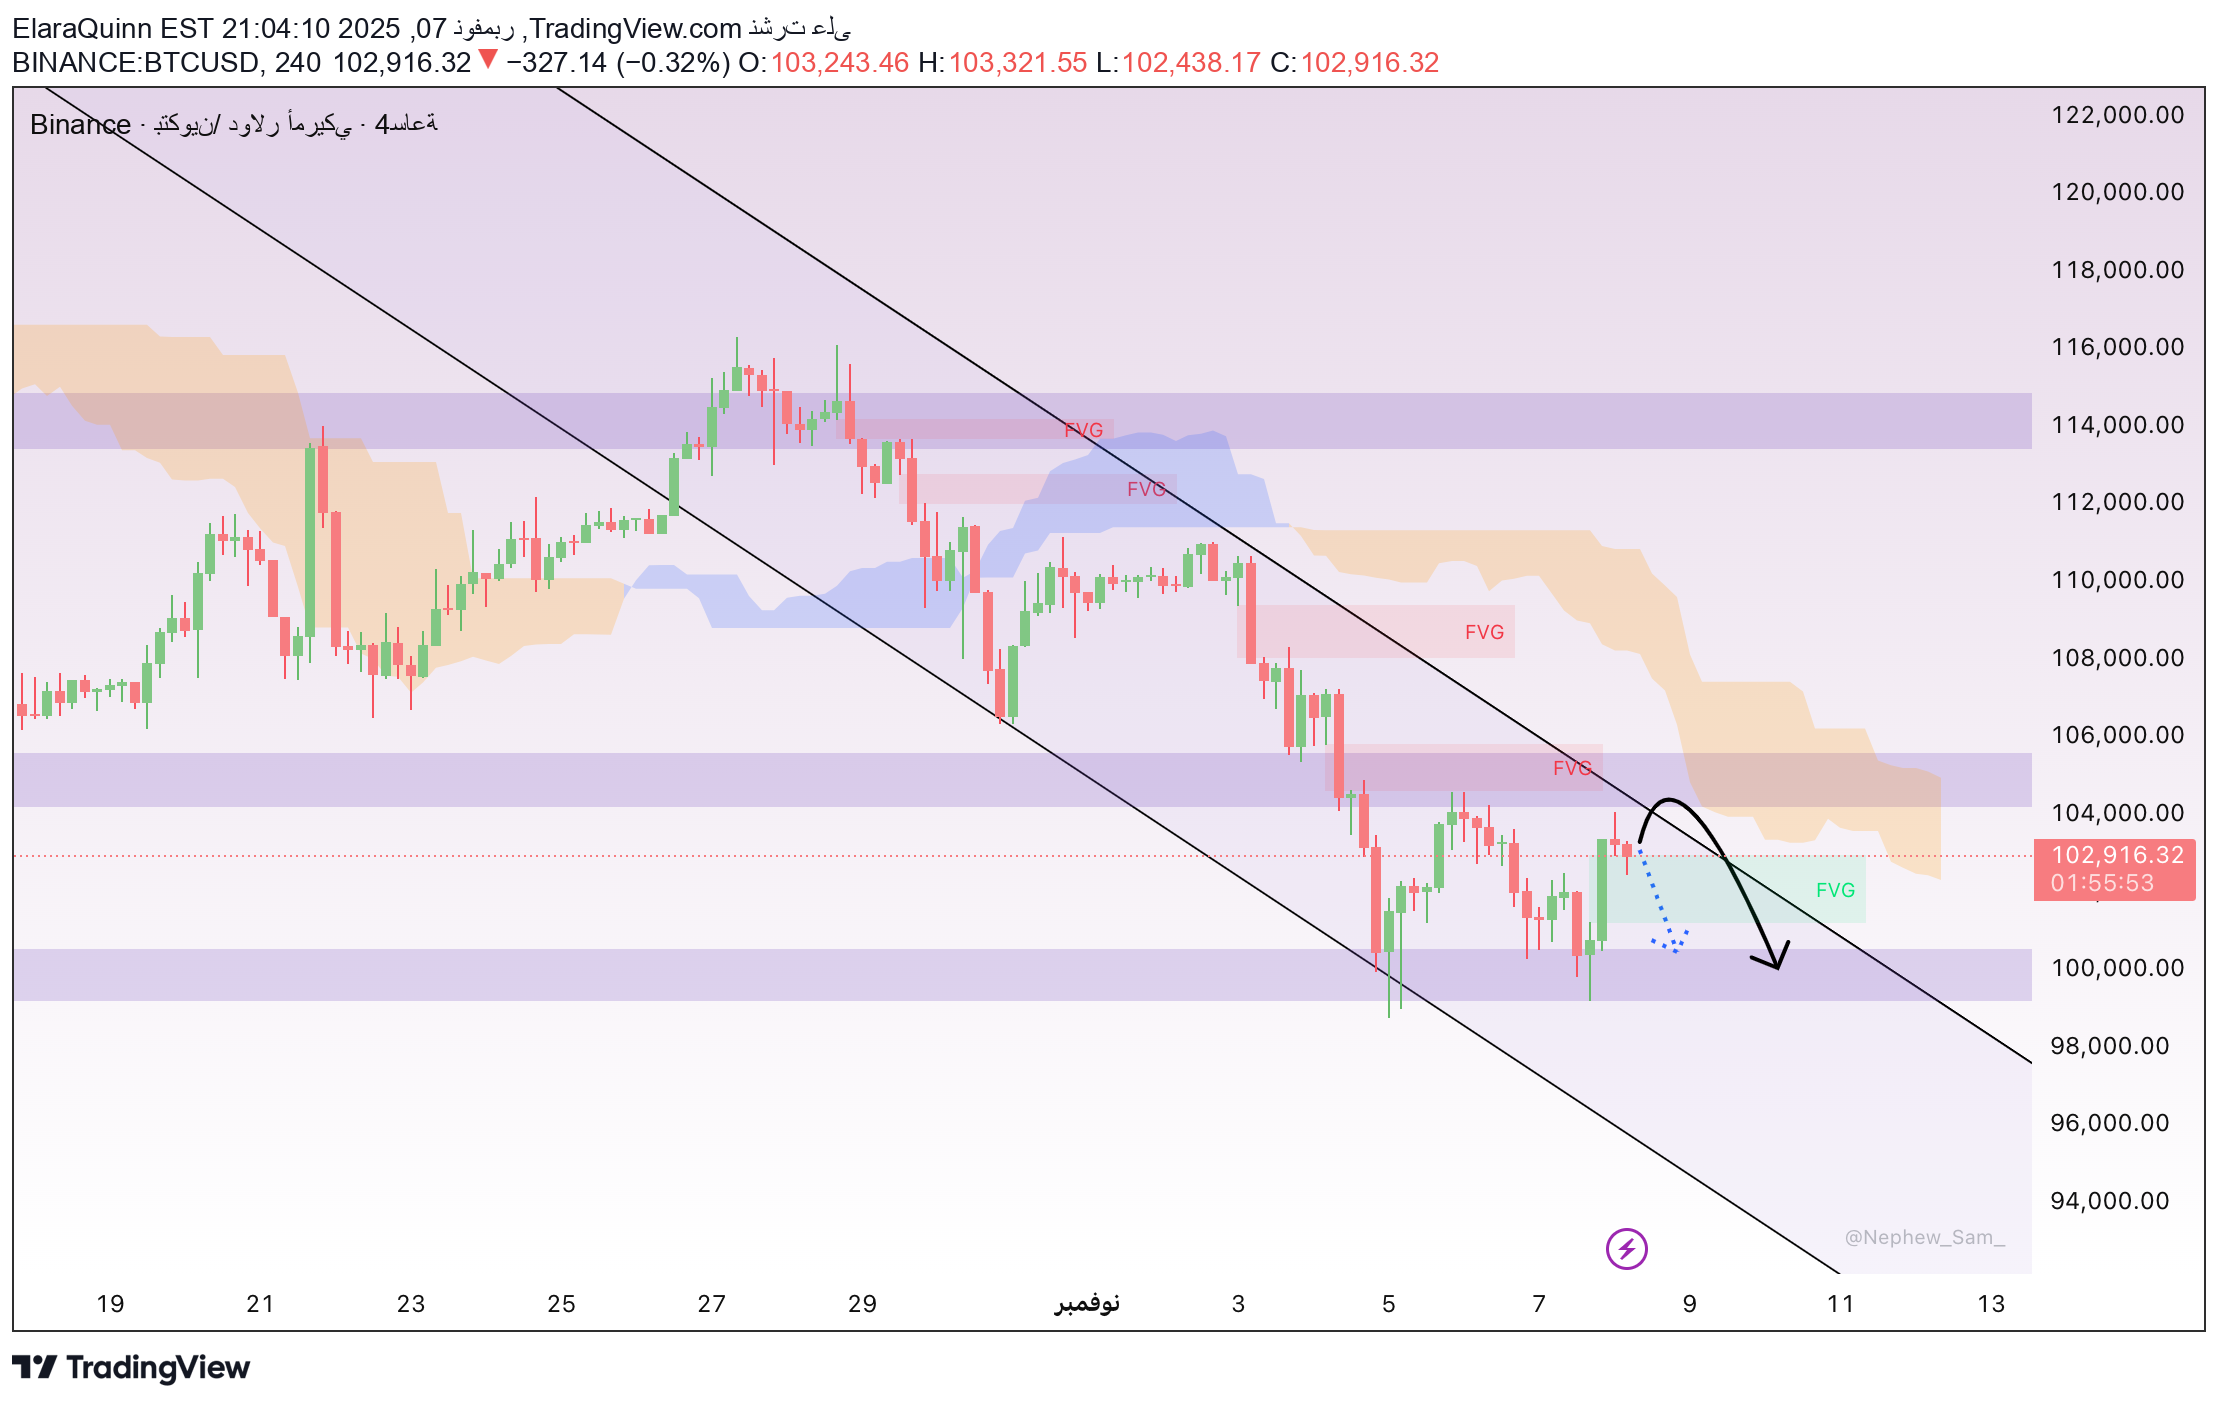
After a strong rally in October, Bitcoin is under corrective pressure as the US dollar recovers. The DXY index stabilizes around 100.5, and the 10-year US bond yield is at 4.2%, prompting investors to prefer safe-haven assets at the expense of cryptocurrencies. The decline in US stock indices such as the Dow Jones and S&P 500 reflects the general caution, especially with expectations that the Federal Reserve will not cut interest rates soon. As for the digital currency market, risk appetite is still weak, as large investors are staying away from the market, and ETF flows are still limited. Geopolitical tensions and the decline of gold have also reduced Bitcoin's role as a safe haven. On the 4-hour chart, the price is floating around $102,900 in a short-term bearish range since the $112,000 level. The most important support range between $101,500 and $102,200 represents a potential area for buyers to return, while resistance at $103,800 - $104,500 remains a major barrier. Bitcoin will likely continue to trade sideways between $101,500 and $104,000 until there is a new signal from the Fed or a significant increase in ETF inflows.
سولانا در آستانه ۱۶۰ دلار: آیا خریداران جدی شدهاند؟
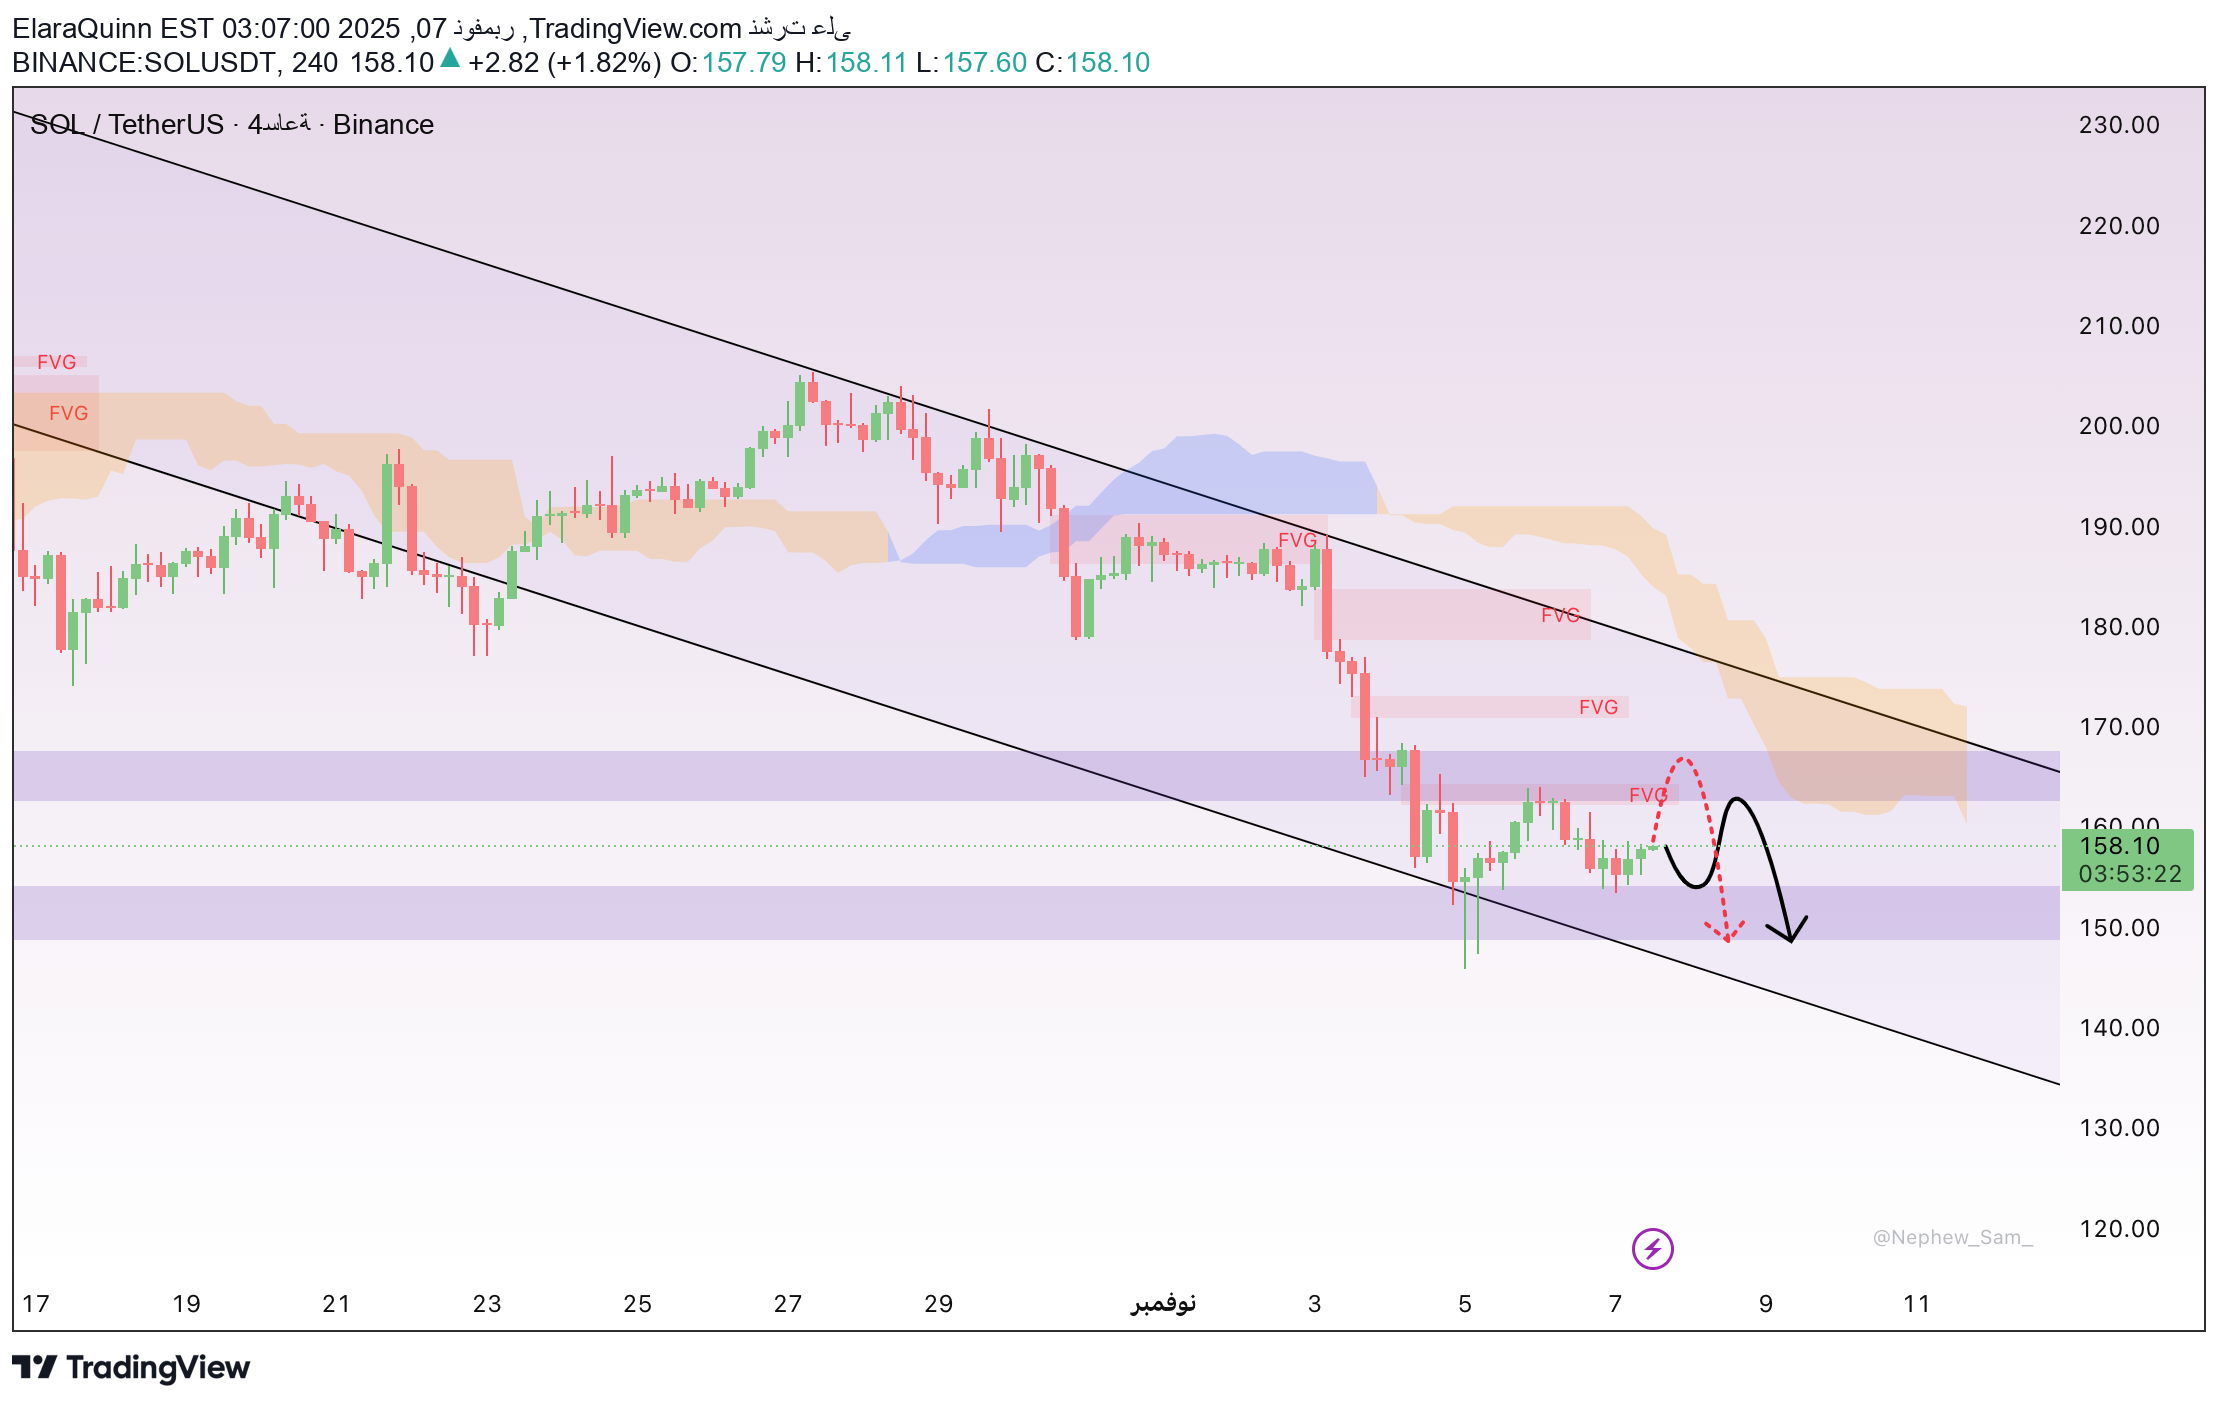
سولانا (SOL/USDT) is currently trading around $156 after a sharp decline in recent days, making this area a strong support as buyers start to emerge again. The general trend is still bearish on the four-hour time frame, but repeated bounces from $155-156 levels indicate serious attempts by buyers to protect this range. The digital currency market was generally affected by the policies of the US Federal Reserve, as the rise in the dollar and ten-year bond yields around 4.2% made investors more cautious towards high-risk assets. However, سولانا remains strong thanks to the continued flow of funds into its ecosystem in the DeFi and NFT fields, as well as interest from large financial institutions. On this basis, SOL is likely to continue its sideways movement between $155 and $160 until its next destination is determined.
طلا در دامنه نوسان باریک: منتظر جرقه بعدی بازار!
Gold is trading around $3,978 after reaching a peak of $4,020. The market is currently stuck between $3,950–$4,000 with a distinct lack of momentum. The US dollar remains strong. Although the DXY index declined slightly, 10-year bond yields are around 4.2%, which directs investors to the dollar. Therefore, despite the weakness in equities, gold demand remains limited. From a technical perspective, the price is in a tight horizontal structure. The $ 3,950–3,960 region is watched as support and $ 4,000 is watched as psychological resistance. In case of an upward break, $4,050–4,100 can be targeted; However, if it falls below 3,950, the possibility of a withdrawal to $ 3,900 increases. In the short term, gold is expected to continue its movement in this dar band; A clear direction can only emerge with new signals from the Fed or developments that will shake global markets.
طلاء يتنفس الصعداء: هل سنشهد انفجارًا سعريًا قريبًا أم تراجعًا مفاجئًا؟
Gold is currently trading near $3,978 per ounce after peaking at $4,020. The market is going through a period of consolidation between $3,950 and $4,000 without enough momentum for a clear breakout. The US dollar remains strong, the DXY index is stable at elevated levels, while 10-year US bond yields are near 4.2%, attracting capital away from gold. Despite weakness in US stocks, support for the metal remains limited. Technically, gold is moving within a narrow range, with support at 3,950–3,960 and psychological resistance at 4,000. Low trading volumes indicate traders are waiting for a clearer signal. Crossing 4,000 may push the price to 4,050–4,100, while breaking 3,950 may bring the price back to 3,900. Gold is likely to continue to move sideways in the near term until new stimulus from the Fed or surprising economic developments emerge.
ارتداد اتریوم: آیا خروج پول مانع رشد قیمت میشود؟
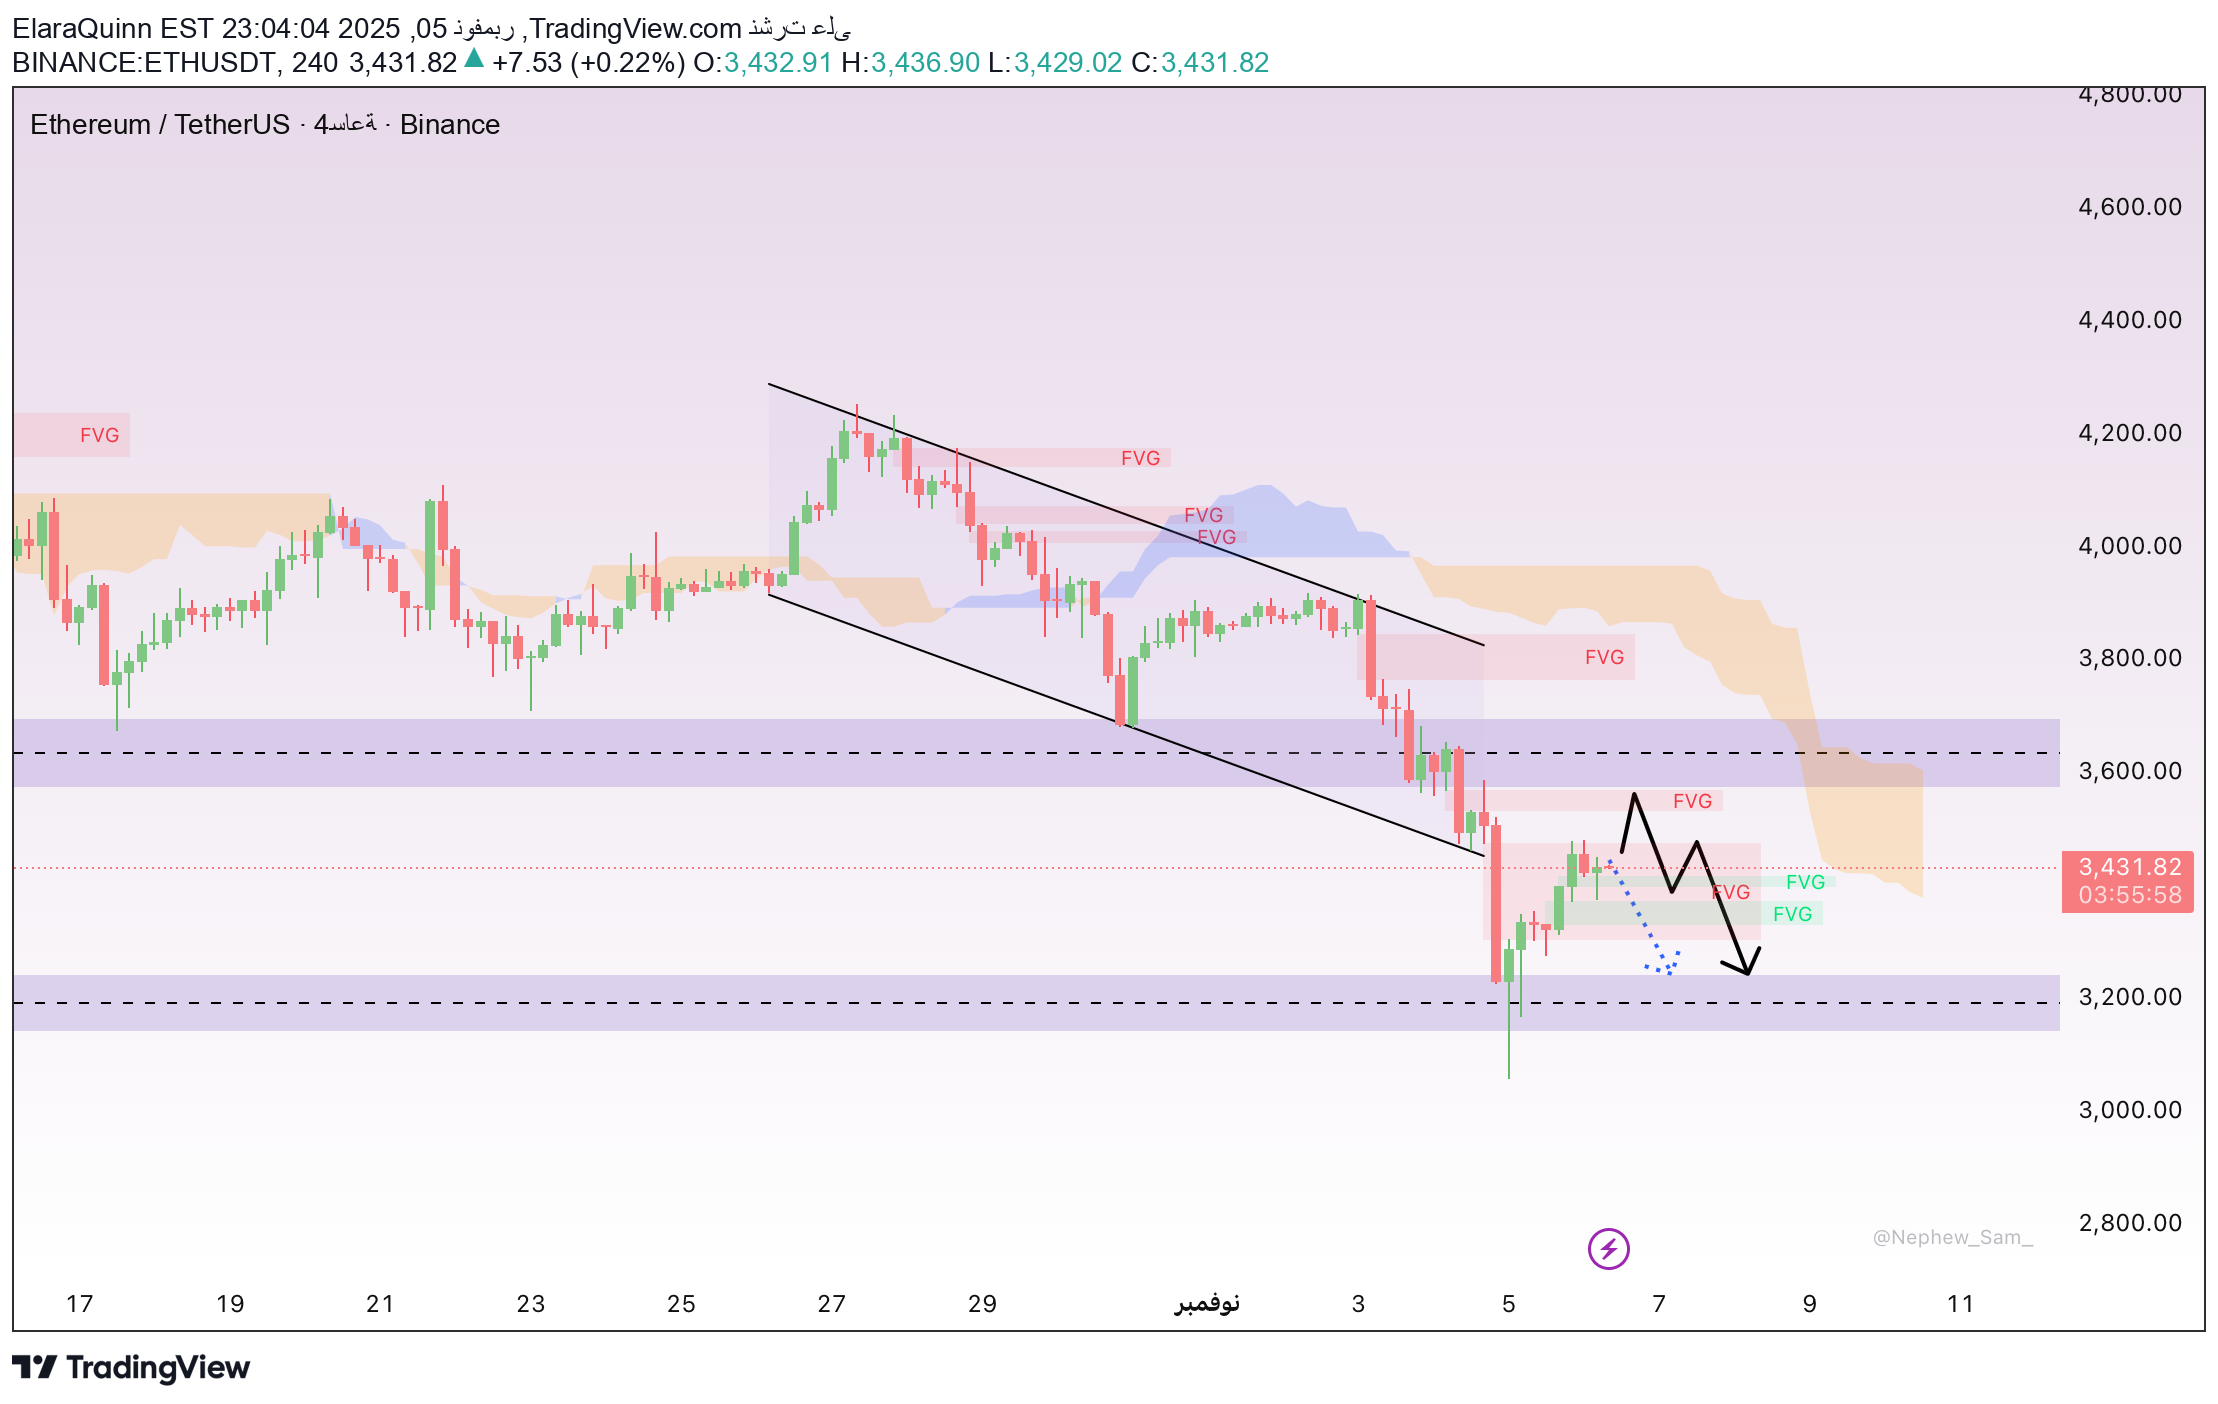
Ethereum has seen a technical bounce between waves of concerns about the Federal Reserve and declining liquidity in cryptocurrencies. The price maintained the $3,100-$3,200 range, indicating strong buying activity. Currently the price is moving within the FVG $3,420–3,500 zone, with support at 3,340–3,390 and resistance at 3,500–3,600. A test of 3,500-3,550 is expected before a return to 3,350-3,300, then a possible rise to 3,600-3,680. If it breaks 3,550 with high trading volume, the price may reach 3,700 – 3,780, while a break of 3,300 may cancel the bounce. The overall trend is still bearish, but Ether’s strength in DeFi and staking supports the 3,100 – 3,200 bottom in the short term.
تحلیل طلا: نوسان افقی؛ پیشبینی کوتاه مدت و سطوح کلیدی خرید و فروش
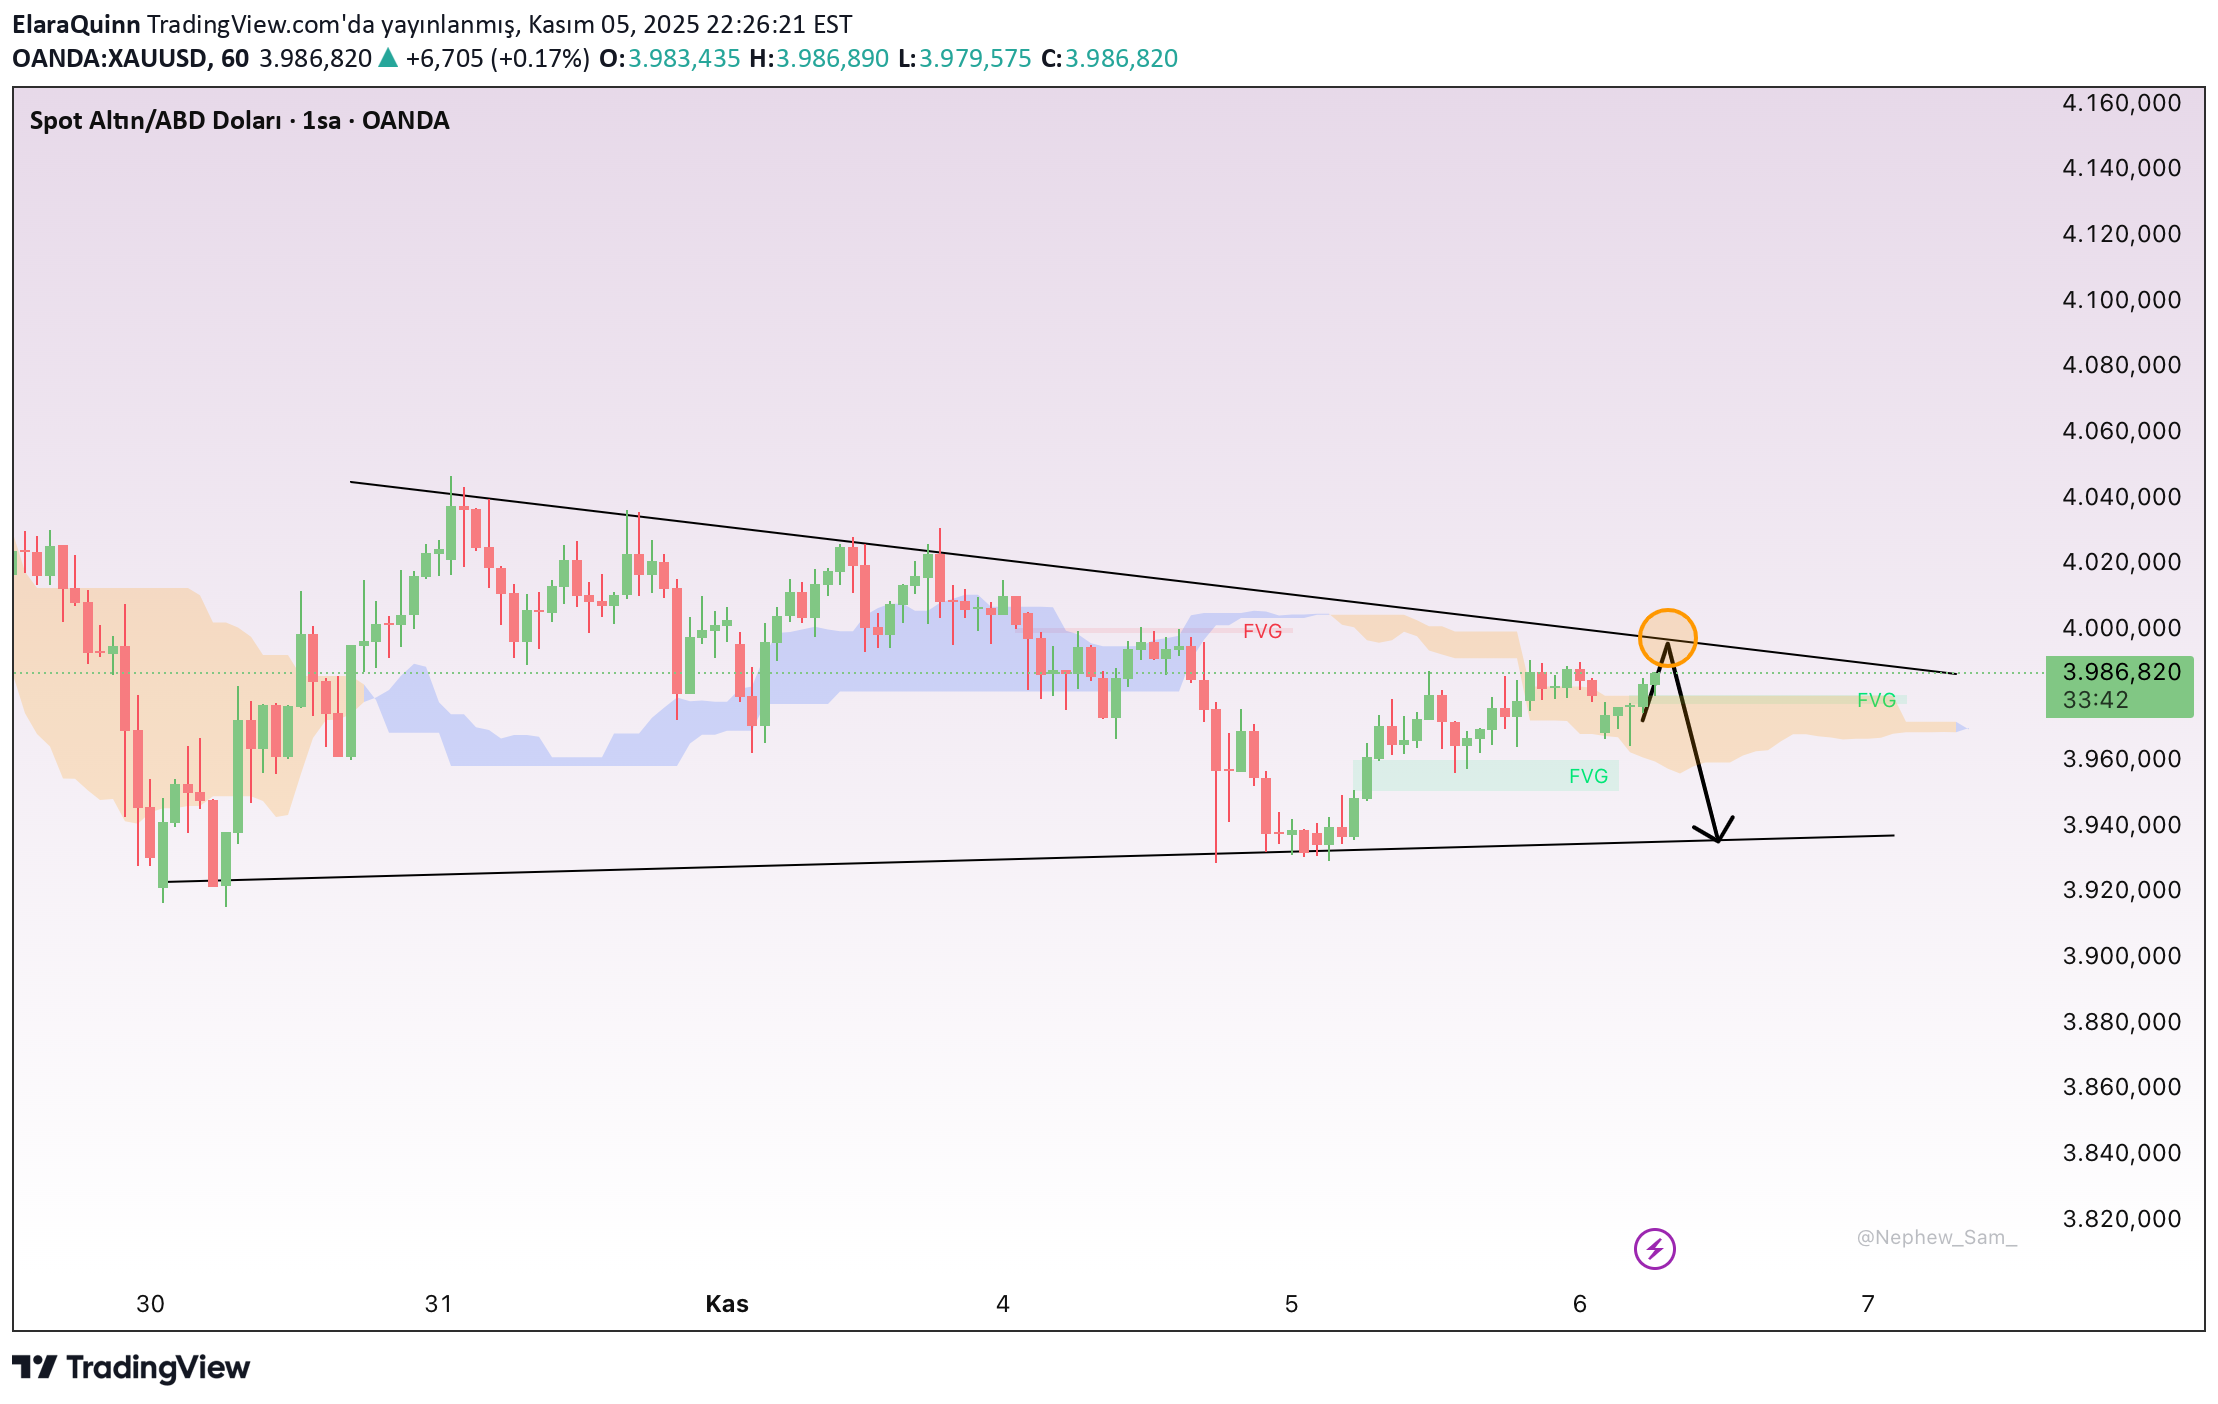
Gold is traded in the range of 3,950 – 3,985 USD and is in the accumulation process. Support levels are around 3,945 – 3,955, resistance levels are around 3,985 – 4,000. First of all, I expect the price to retreat to 3.955 – 3.945 levels, or even to 3.930 – 3.925. If strong buy signals (long wick candles and high volume) appear at these levels, I foresee the price rising to 3,985 – 4,000 and then reaching 4,020. A close above 4,020 would signal a more significant recovery.
Disclaimer
Any content and materials included in Sahmeto's website and official communication channels are a compilation of personal opinions and analyses and are not binding. They do not constitute any recommendation for buying, selling, entering or exiting the stock market and cryptocurrency market. Also, all news and analyses included in the website and channels are merely republished information from official and unofficial domestic and foreign sources, and it is obvious that users of the said content are responsible for following up and ensuring the authenticity and accuracy of the materials. Therefore, while disclaiming responsibility, it is declared that the responsibility for any decision-making, action, and potential profit and loss in the capital market and cryptocurrency market lies with the trader.