
Eightchains
@t_Eightchains

What symbols does the trader recommend buying?
Purchase History
پیام های تریدر
Filter
Eightchains
Long BTC to Around $48,000

BTC was up roughly 70% from October 5 to December 5 with the current price action observed within a horizontal trading range. I will be opening a long position on the Spring position around $40,000. If the Spring fails then I will exit the position at a small loss. I think we will observe a sign of strength (SOS) rally that will take the price to around $48,000. This is not financial advice. I am not your financial advisor. This is my opinion.The price action has moved within the trading range as expected, although the price didn’t spend very much time in the lower portion of the trading range. We observed a Spring-like event on Jan 3 and a sign of strength (SOS) bar on Jan 8. This is a live trade. I expect to close the trade around $48,223, which would yield a 19.4% profit on the trade.Entry: $40,388 Exit: $48,223 P&L: +19.4% Time to look for the next trade!
Eightchains
Short DigitalBits (XDB) TO Around $0.0061

My ceiling and floor prices for DigitalBits (XDB) are $0.0070 and $0.0058, respectively. Eight Chains printed a short signal. Our entry is $0.00677325 and our take profit targets are $0.0061 and $0.0058. I have a stop loss at $0.00704418. This is not financial advice. I am not your financial advisor. This is my opinion.Due to the XDB price action and the signals generated by Eight Chains, this situation has turned into several trades rather than a single trade. The trades are as follows: Trade 1, Short Entry: $0.006732500 Close: $0.006678540 P/L: +0.81% Trade 2, Short Entry: $0.007331560 Close: $0.006796270 P/L: +7.87% The price action appears to be overextended to the upside. I am looking for another short entry.Trade 3, Short Entry: $0.007043590 Close: $0.006588510 P/L: +6.91%Although the price action played out a little bit different than I expected (e.g., 3 trades instead of a single trade, price did not reach $0.000610000 target), this situation worked out quite well. Thoughts: 1. Adhere strictly to your trading system - one that you've developed over time, one that you know well and trust. 2. After you've entered the trade, just let the trade play out. Don't second guess yourself as "the die is cast" so to speak. 3. Near emotionless trading. Enter and exit trades via Eight Chains signals.
Eightchains
Stepping-Stone Re-Distribution Continues for Bitcoin

Since Oct 21, 2021, Bitcoin (BTC) has exhibited a stepping-stone pattern of re-distribution. I have clearly documented these events in a series of publications as the price action unfolded. In this stepping-stone pattern, the price trades within a well-defined trading range for a time until the price commits below the lower boundary of the trading range in a shakeout (SO) and/or sign of weakness (SOW) event. Next, demand comes in to stop the downward price action then the price trades within a new trading range with well-defined boundaries. In stepping-stone re-distribution, it’s almost as if the trading ranges are kind of stacked upon one another. With the recent FTX/Alameda black swan event, we have observed a SO/SOW event. In the SO/SOW, the BTC price dropped by greater than 26%. Demand clearly stepped in to stop the price from decreasing further. Most likely we have entered a new trading range although we need to wait for confirmation. In addition, we don’t know at the moment if this new trading range is accumulation or distribution. Note: The orange circles highlight climatic level volume. Wyckoff abbreviations: automatic rally (ARa), selling climax (SC), secondary test (ST), upthrust (UT), upthrust after distribution (UDAT), preliminary supply (PS), failed upthrust (FUT), shakeout (SO), sign of weakness (SOW), upthrust (UT), Phase A (Ph A), Phase B (Ph B), Phase C (Ph C), Phase D (Ph D). This is not financial advice. I am not your financial advisor. This is my opinion.Although Eight Chains 1.002 flashed a long signal on Nov 12 and on Nov 15, I will not be opening a BTC position until I get a stronger/more clear signal.Zoomed out image of stepping-stone re-distribution from Oct 21, 2021 to the present.
Eightchains
Long BTC to $25,600
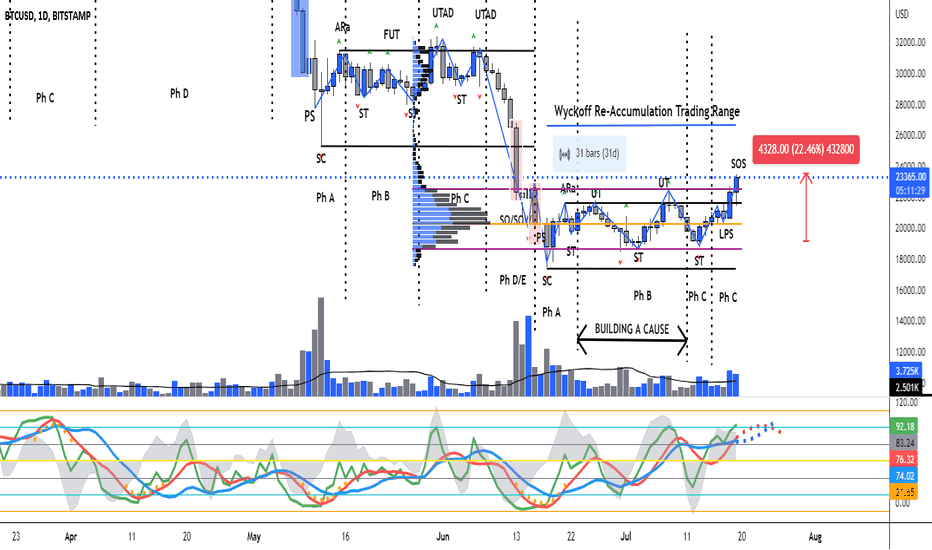
Cognitive flexibility, required to shift one’s bias from bullish to bearish, long to short, and vice versa, based on market conditions, is extremely valuable as a trader. In previous publications, I mentioned that since the BTC price has been in a down trending environment for nearly 9 months we should assume that the current trading range (31 days and counting) is re-distribution unless the market conditions tell us otherwise. The BTC price is up 22% since the secondary test (ST) on July 13. Thus, the current market conditions tell us that we should consider whether the current trading range is re-accumulation instead of re-distribution. If the current trading range is re-accumulation, then the secondary test (ST) on July 13 had a spring-like effect and the subsequent rally, which broke above the trading range upper bound, broke above the value area high (VAH, purple line) and, most likely, will close above the open of the significant sell bar (shaded pink) on June 16. This is bullish! The 2 day, 4 day, and 8 day all look bullish. With regard to a long position, target 1 is $25,600 and target 2 is $29,959. Wyckoff abbreviations: automatic rally (ARa), preliminary support (PS), selling climax (SC), secondary test (ST), failed upthrust (FUT), upthrust (UT), upthrust after distribution (UTAD), last point of support (LPS), selling climax (SC), shakeout (SO), sign of strength (SOS), sign of weakness (SOW), Phase A (Ph A), Phase B (Ph B), Phase C (Ph C), Phase D (Ph D), Phase E (Ph E). This is not financial advice. I am not your financial advisor. This is my opinion.BTC in the 1 day, 2 day, 4 day, and 8 day time frames.The same charts above but with the Bad Ass Bollinger Bands (BA BBs).Chart showing BTC, NDQ, and DXY. There is a strong positive correlation between BTC and NDQ and a strong negative correlation between BTC and DXY as well as between NDQ and DXY. At the moment, BTC and NDQ are rallying and DXY is reacting.Trade closed at $24,998
Eightchains
BTC Reaction at Re-Distribution Trading Range Upper Bound

The BTC price continues to be observed within a Wyckoff re-distribution trading range (to be confirmed or to fail) with the upper bound given by the automatic rally (ARa) daily high and the lower bound given by the selling climax (SC) daily low. The secondary test (ST) on July 3 had a Spring-like effect, catalyzing a very nice rally (+19%) that wicked above the trading range upper bound. I expect the BTC price to test the point of control (POC) around $20,472. Let’s see how the BTC price reacts at the POC (e.g., Will it fall through the POC support or reverse direction?). With regard to the Phoenix Ascending (PA) indicator (lower panel), upward momentum (Energy, grey) is diminishing. We will be observing downward momentum soon. The blue line at level 70 will provide support for the BTC price. Given the levels and likely trajectories of the blue and red lines, a steady, step-wise move down (similar to the reaction from June 26 through July 3) seems likely. Wyckoff abbreviations: automatic rally (ARa), selling climax (SC), secondary test (ST), upthrust (UT), upthrust after distribution (UDAT), preliminary supply (PS), failed upthrust (FUT), last point of supply (LPSY), shakeout (SO), sign of weakness (SOW), Phase A (Ph A), Phase B (Ph B), Phase C (Ph C), Phase D (Ph D), Phase E (Ph E). This is not financial advice. I am not your financial advisor. This is my opinion.This chart includes the Bad Ass Bollinger Bands (BA BBs) and excludes the fixed range volume profile (FRVP). There is confluence between the two indicators. With regard to a short position, the first target provided by the BA BBs is around $20,545 and the second target is around $19,780.Currently, although the momentum (Energy, grey filled area, grey dotted lines) is starting to diminish, the red, blue, and green lines are pointing decidedly downward. Thus, regardless of when/where you entered the short position, the short position should still be open. The short position should remain open until the red and blue reach their lowest values in this cycle (July 10, 10 pm CST, approximately) preferably when the green is at its lowest value and has flattened out (i.e., moving sideways). That is the time to take profit and/or open a long position. The long position should remain open until the blue and red have reached their highest values in this cycle and the green is at its highest value and has flattened out. That is the time to close the long position and/or open a short position. Although I trade based on an analysis of many time frames, I ALWAYS monitor the 3H time frame. Not financial advice.For my short position, target 1 at $20,472 has been hit. My SL has been moved past the entry price. Let's see if target 2 at $19,780 gets hit.Target #2 at $19,780 was hit. I opened the position at $21,403 with 3x leverage so this has been a nice, profitable trade. Target #3 is $18,677, which is between the lower aqua and lower orange BA BBs (approximately the midway point) and corresponds to the low of the ST on July 3. I moved my SL to $19,700 to lock in my profits. Let's see if target #3 gets hit.Trade closed at $19,386 to lock in profits.
Eightchains
BTC Bottom Around $11,000
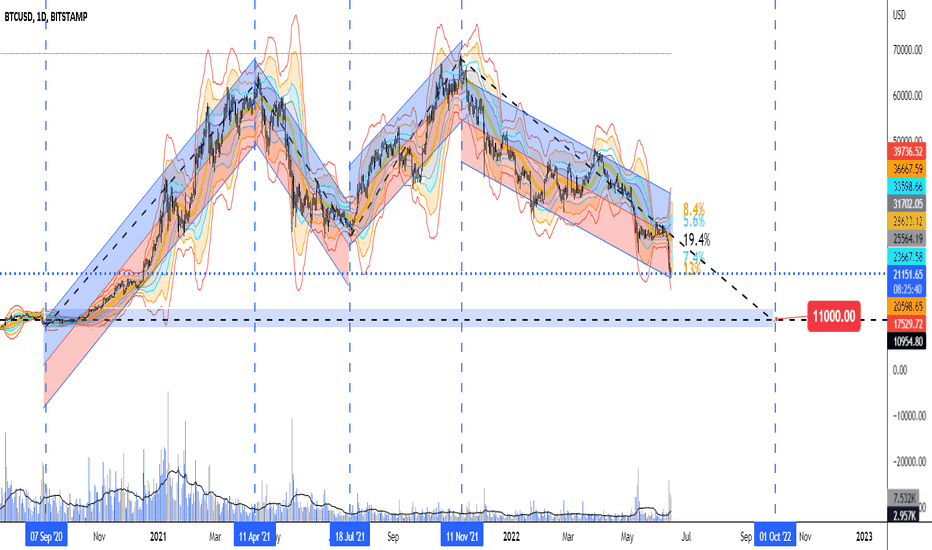
A lot of people have asked “Where is the bottom for Bitcoin?”. Of course nobody knows for sure but it is fun (and arguably important) to speculate. Here I’ve plotted the BTC price since several months prior to it’s parabolic run in fall 2020 to the present. I’ve added trend lines to smooth out the data and used linear regression channels to highlight the up trending and down trending time periods. The transitions between an up trending environment and a down trending environment are given by the blue vertical lines. The take home message is that we might see BTC bottom around $11,000 around Oct 2022. This corresponds nicely to the price observed prior to BTC’s parabolic run in fall 2000 and also corresponds quite nicely with projections made with the Phoenix Ascending indicators.
Eightchains
BTC to Test Support of a Wyckoff Re-Distribution Trading Range
The BTC price continues to be observed in Phase B of a Wyckoff re-distribution trading range. We should consider this a re-distribution trading range (to be confirmed or to fail based on market events) rather than a re-accumulation trading range as the BTC price has been in a down trending environment for the past 6 or so months. This Wyckoff re-distribution trading range (upper bound = $31,520; lower bound = $25,340) is interesting in that the price has spent the majority of the time in the upper portion of the trading range (green shading, lower boundary of the upper portion is given by the low of the preliminary support (PS) event). In most cases, the price would test the trading range support level ($25,340) several times as it moves through the range so, in this regard, the trading range is a bit atypical. That said, it appears that BTC will be testing the trading range support level ($25,340) soon as it already has broken support at the PS event and the BTC price is observed in the lower portion of the trading range (red shading, lower boundary of the lower potion is given by the selling climax low) in what might be a shakeout/sign of weakness (SO/SOW) event. This idea is consistent with the Phoenix Ascending (PA) indicator, given in the lower panel. I expect both the red and blue lines and likely the BTC price to continue on their downward trajectory. Note the low volume over the last week compared to the climatic volume observed at the PS and selling climax (SC) events. This tells me two things: (1) The BTC price is able to move downward through the trading range with relative ease. If the trading range support is to hold then demand needs to be observed. (2) As the beginning and the end of Wyckoff trading ranges are typically marked by climatic level volume, BTC will likely continue within this trading range. Significant bars, which help define important areas of support and resistance, are given by the blue shading. Wyckoff abbreviations: automatic rally (ARa), selling climax (SC), secondary test (ST), upthrust (UT), preliminary support (PS), failed upthrust (FUT), last point of supply (LPSY), shakeout (SO), sign of weakness (SOW), Phase A (Ph A), Phase B (Ph B), Phase C (Ph C), Phase D (Ph D), Phase E (Ph E). This is not financial advice. I am not your financial advisor. This is my opinion.Shown here is the BTC price in the weekly (left panel) and monthly (right panel) time frames with the Bad Ass Bollinger Bands (BA BBs, upper panel) and the PA indicator (lower panel). In the monthly time frame, I expect the red and blue lines to continue on their downward trajectory for several more months. They might reach a bottom and start turning up this fall. Interpretation of the BA BBs and PA indicators in the weekly suggest a test of the trading range support. At the moment, the indicators do not suggest a capitulation-type event in the weekly time frame.Now that the BTC price has broken the Wyckoff re-distribution trading range support, one might ask: Where might the BTC price find support? One possibility is that BTC may find support around the Dec 2017 high around $19,490. Let's watch carefully to see if the BTC price does, indeed, fall to that support level and if that support level holds.A few things of interest here: (1) Note the dramatic increase in volume on the June 13 SO/SOW bar. The level of volume is greater than that observed for the PS event but less than that observed for the SC event. (2) The SO/SOW bar is highly significant. Weak hands, who have been in massive amounts of psychological pain for months, are finally capitulating their position to strong hands. It’s as if they are saying “I just can’t take it anymore! Please, please just take this BTC off of my hands!”. Strong hands/value investors/composite operator (CO) types are happy to oblige weak hands and buy here and hold as a long-term investment. Weak hands get some much needed psychological relief. (3) Note the very large demand tail on the SC and the June 14 bar (see areas highlighted in yellow). Strong hands/value investors/composite operator (CO) types are perceiving value here (and they only buy value) and are buying heavily. What affect does the strong buying have on the price? It stops the price from moving further to the downside. (4) With regard to the PA indicator (bottom panel), given the downward trajectories for the blue, red, and green lines, one might expect the price to continue a bit more downward from here. That said, I don’t see any aggressive downward moves for BTC over the next few days. Note how the Energy (momentum indicator, grey shaded area) is dissipating. This also supports the idea that the momentum of this downward move is decreasing and may reverse over the next few days.
Eightchains
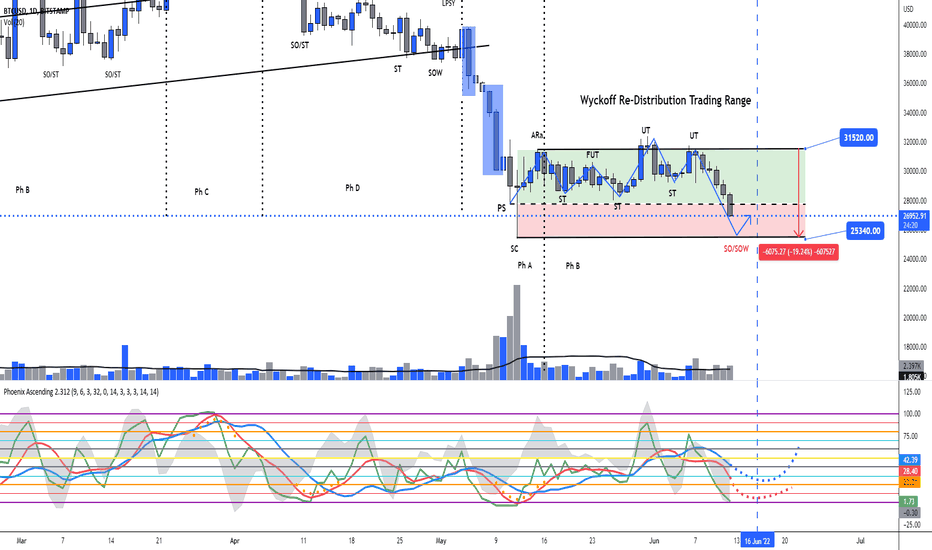
BTC in Phase B of a Wyckoff Re-Distribution Trading Range
In my previous publication, I opened a long position at what I thought at the time was a selling climax (SC). My analysis was incorrect, as what I thought was a SC was, in fact, a preliminary supply (PS) like event. The PS is known as the first concerted attempt to stop the down trend. Lesson learned. Nevertheless, the BTC price has entered another Wyckoff re-distribution trading range, which is to be confirmed or to fail based on market events. We are in Phase B as we’ve observed the SC and the automatic rally (ARa). Therefore, I’d expect the price to test the lower boundary of the trading range in the form of a secondary test (ST). This idea is consistent with the Phoenix Ascending (PA) indicator, given in the lower panel. I expect the red line to be rejected near level 50 then turn back down and for the green line to continue moving downward. The energy fall below 50 soon, indicating downward pressure on the price. Significant bars, which help define important areas of support and resistance, are given by the blue shading. Wyckoff abbreviations: automatic rally (ARa), selling climax (SC), secondary test (ST), upthrust (UT), upthrust after distribution (UDAT), preliminary supply (PS), failed upthrust (FUT), last point of supply (LPSY), shakeout (SO), sign of weakness (SOW), Phase A (Ph A), Phase B (Ph B), Phase C (Ph C), Phase D (Ph D), Phase E (Ph E). This is not financial advice. I am not your financial advisor. This is my opinion.Looking at the BTC price in conjunction with the Bad Ass Bollinger Bands (BA BBs) and PA in higher time frames seems to confirm the re-distributional nature of the current trading range.The BTC price and the BA BBs and PA indicator in the monthly time frame.Some expressed interest in a chart that contained the volume information. Here it is. Notice the massive volume spikes on May 11-12. Notice also the large supply tail and much larger demand tail on the May 12 daily candle. That tells us that weak hands were capitulating and strong hands (e.g., value investors with a long time horizon) were buying up BTC. It is the large amount of buying activity that stopped the down trend and produced the trading range.
Eightchains
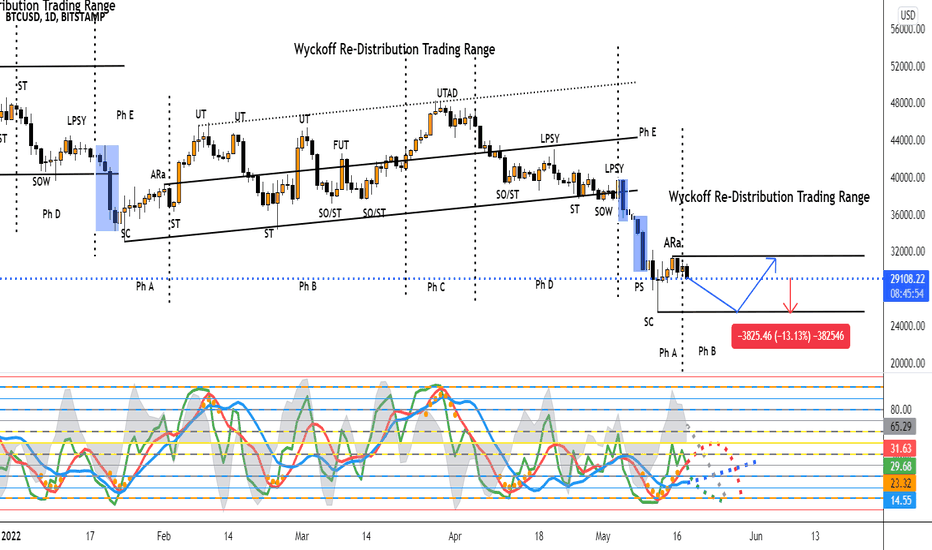
Long BTC at Selling Climax
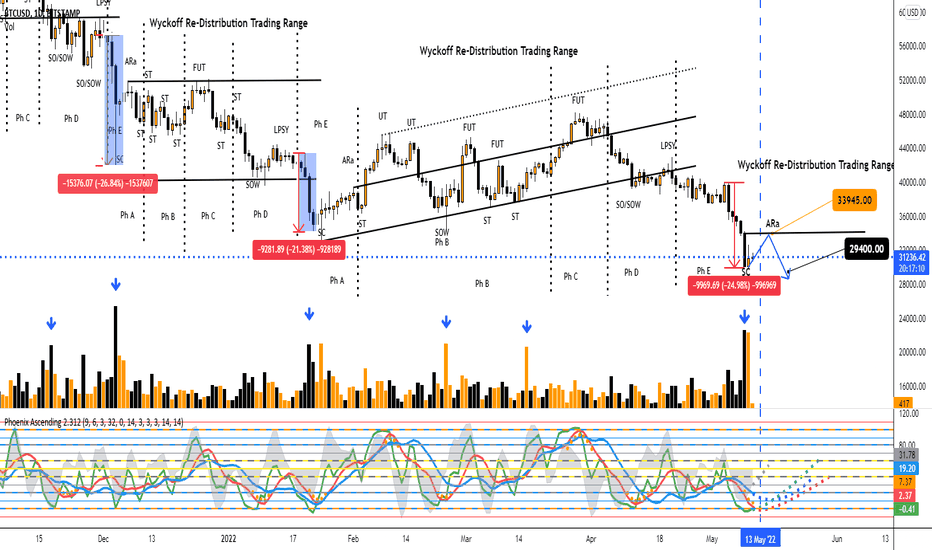
Previously, I’ve demonstrated stepping-stone descending horizontal Wyckoff re-distribution trading ranges for BTC. Interestingly, the last 3 transitions from Wyckoff re-distribution Phase E to Phase A were similar. In all 3 cases, we observed a climatic level of volume. In all 3 cases, we observed sell bars with a large spread. The percent change in price for these Phase E/Phase A transitions were -26.84%, -21.28%, and -24.98% in Dec 2021, Jan 2022, and May 2022, respectively. In all 3 cases, we observed a selling climax (SC), which serves the purpose of stopping the down trend, followed by an automatic rally (ARa). I expect that we will observe an ARa to the first area of important resistance, which is the open of the May 9 sell bar ($33,945). I have opened a long position at $30,476 and I have a take profit target of $33,945, which is an 11.38% profit. Significant bars, which help define important areas of support and resistance, are given by the blue shading. The blue arrows point to volume spikes. Wyckoff abbreviations: automatic rally (ARa), selling climax (SC), secondary test (ST), upthrust (UT), failed upthrust (FUT), last point of supply (LPSY), shakeout (SO), sign of weakness (SOW), Phase A (Ph A), Phase B (Ph B), Phase C (Ph C), Phase D (Ph D), Phase E (Ph E). This is not financial advice. I am not your financial advisor. This is my opinion.In this chart, I’ve superimposed a Fixed Range Volume Profile Indicator on the Bad Ass Bollinger Bands (BA BBs) to identify a second take profit target ($36,422). Also shown is the point of control, which is $38,545 at the moment. The Phoenix Ascending (PA) indicator is given in the bottom panel. Projected values for the PA indicator elements are given by the dotted lines.This trade is closed. My SL was hit. I was incorrect about the location of the SC. The market has spoken.
Eightchains
BTC, NDXT, and DXY at a Crossroads
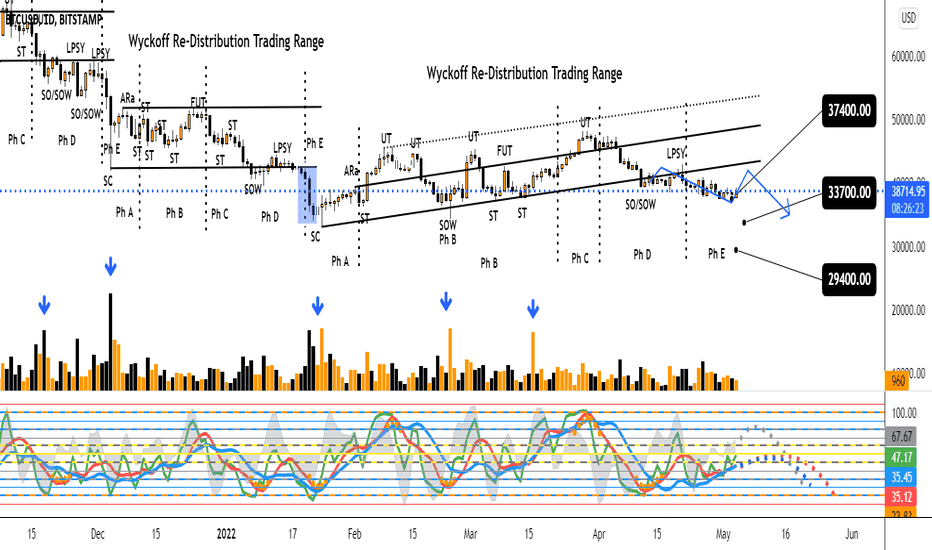
Previously, I’ve demonstrated stepping-stone descending horizontal Wyckoff re-distribution trading ranges for BTC. The fact that the BTC price action broke the trading range support to the downside for a sustained period of time supports the notion of a re-distribution trading range. I opened a short position near the trading range support ($41,313). Since then, my first target of $37,400 has been hit. Based on an analysis of the Phoenix Ascending (PA) indicators (bottom panel), I expect an upthrust toward the trading range support followed by downward price movement. Short position open: $41,313 Take profit target #1: $37,400 Profit/Loss (%): 9.44 Significant bars, which help define important areas of support and resistance, are given by the blue shading. The blue arrows point to volume spikes. Wyckoff abbreviations: automatic rally (ARa), buying climax (BC), selling climax (SC), secondary test (ST), upthrust (UT), failed upthrust (FUT), last point of supply (LPSY), shakeout (SO), sign of weakness (SO), Phase A (Ph A), Phase B (Ph B), Phase C (Ph C), Phase D (Ph D), Phase E (Ph E).I’ve demonstrated a strong positive correlation between the NASDAQ 100 Technology Sector (NDQ) price and the BTC price, which is not surprising given that many perceive BTC as a risk-on asset (i.e., like a tech stock). As you can appreciate from this chart, the NDQ was in strong up trending environment from May, 2021 through January, 2022. At that point, we observed a significant change in character (CHoCH) of the price environment. Specifically, we transitioned from an up trending environment to a downward sloping Wyckoff re-distribution trading range. Note that the notion that it is a Wyckoff re-distribution trading range is to be confirmed or refuted by future price action. The current price action is observed at a long-term support cluster. A NDQ rally toward the trading range resistance would be bullish for BTC and other risk-on assets. If the long-term support cluster were to be broken by a NDQ reaction then that would be bearish for BTC and other risk-on assets. Wyckoff abbreviations: automatic rally (ARa), change of character (CHoCH), failed upthrust (FUT), sign of weakness Ph B (SOW Ph B), upthrust after distribution (UTAD). The CHoCH reaction is given by the blue shaded rectangle.I’ve demonstrated a strong negative correlation between correlation between the degree of strength of the US Dollar, as indexed by the US Dollar Currency Index (DXY) price, and the BTC price. The DXY price is currently observed within a long-term resistance cluster. A bearish scenario for BTC and other risk-on assets is the possibility that the DXY price may break above this resistance cluster to all-time highs. A bullish scenario for BTC and other risk-on assets is the possibility that the DXY price may be rejected at this resistance cluster and fall toward the next logical support cluster. It appears we are, indeed, at a crossroads. Let’s see what happens and trade accordingly. This is not financial advice. I am not your financial advisor. This is my opinion.
Disclaimer
Any content and materials included in Sahmeto's website and official communication channels are a compilation of personal opinions and analyses and are not binding. They do not constitute any recommendation for buying, selling, entering or exiting the stock market and cryptocurrency market. Also, all news and analyses included in the website and channels are merely republished information from official and unofficial domestic and foreign sources, and it is obvious that users of the said content are responsible for following up and ensuring the authenticity and accuracy of the materials. Therefore, while disclaiming responsibility, it is declared that the responsibility for any decision-making, action, and potential profit and loss in the capital market and cryptocurrency market lies with the trader.