
EfeffecTR
@t_EfeffecTR

What symbols does the trader recommend buying?
Purchase History
پیام های تریدر
Filter
BNB: قدم بعدی در نردبان صعودی کجاست؟ تحلیل استراتژیک تا ۱۲۲۱ دلار!
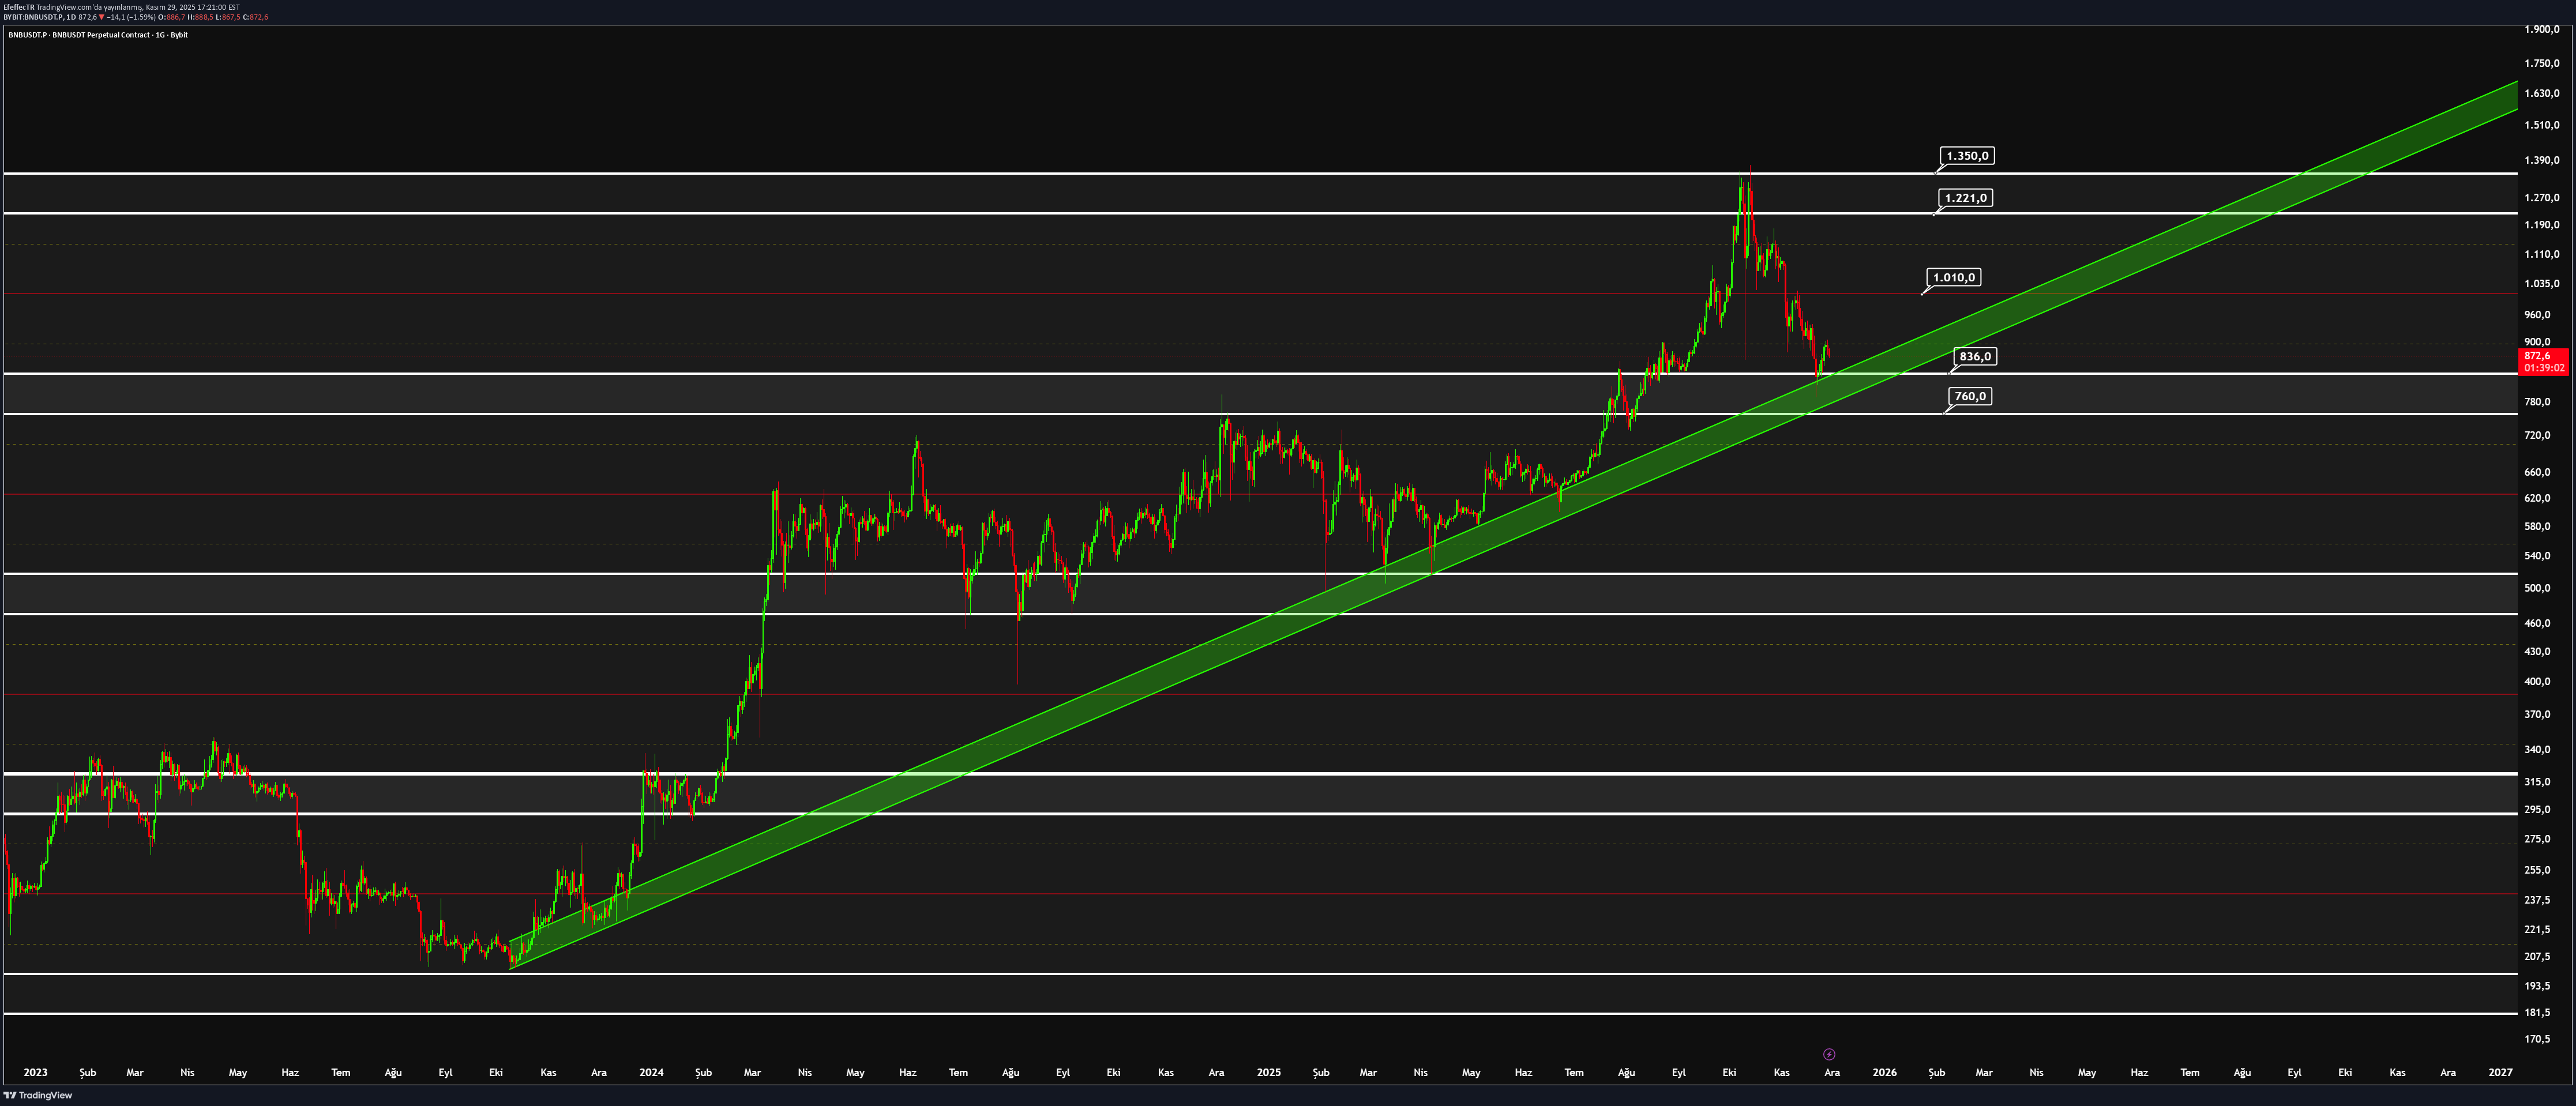
The BNB chart is a living proof of how powerful the "Market Memory" concept works in technical analysis. The chart shows that Binance has implemented the "Ladder Strategy" perfectly. Each resistance break creates the ground (support) for the next rise. The harmony of the Green Rising Trend Channel on the chart and the horizontal price blocks operates with the precision of a "Swiss Time". The price overcomes horizontal resistances by using them as a staircase and regains strength from the main trend support. Technical Game Plan: "Support is a Zone, Not a Line" In the current view, BNB is at the most strategic point where the rising trend support and the strong horizontal buyer block intersect. Critical Stops on My Watch List: 🛡️ Main Support / Trend Stronghold ($760 - $836): This is BNB's "Red Line". It is both the channel alt band and the main demand zone, which has worked as resistance in the past and has now turned into support. As long as this zone is maintained, the direction of the trend is upward. 🚧 Intermediate Control Point ($900): The first psychological barrier that must be overcome for the price to gain momentum and buyers to gain appetite. 🔑 First Main Target ($1010): It is the middle band of the ascending channel. It is usually the balance point where the first profit realizations can be seen. ⚠️ Last Turn ($1140): It is the last intermediate resistance/reaction zone before the summit. 🎯 Final Target Zone ($1221 - $1350): It is the peak of the trend and the completion target of the formation. Conclusion: As long as BNB remains above the "Defensive Line" in the $760 - $836 band, the technical structure supports the "Regular" rise towards the $1350 target.
نبرد سرنوشتساز XRP: آیا 1.40 دلار آخرین سنگر صعود است؟
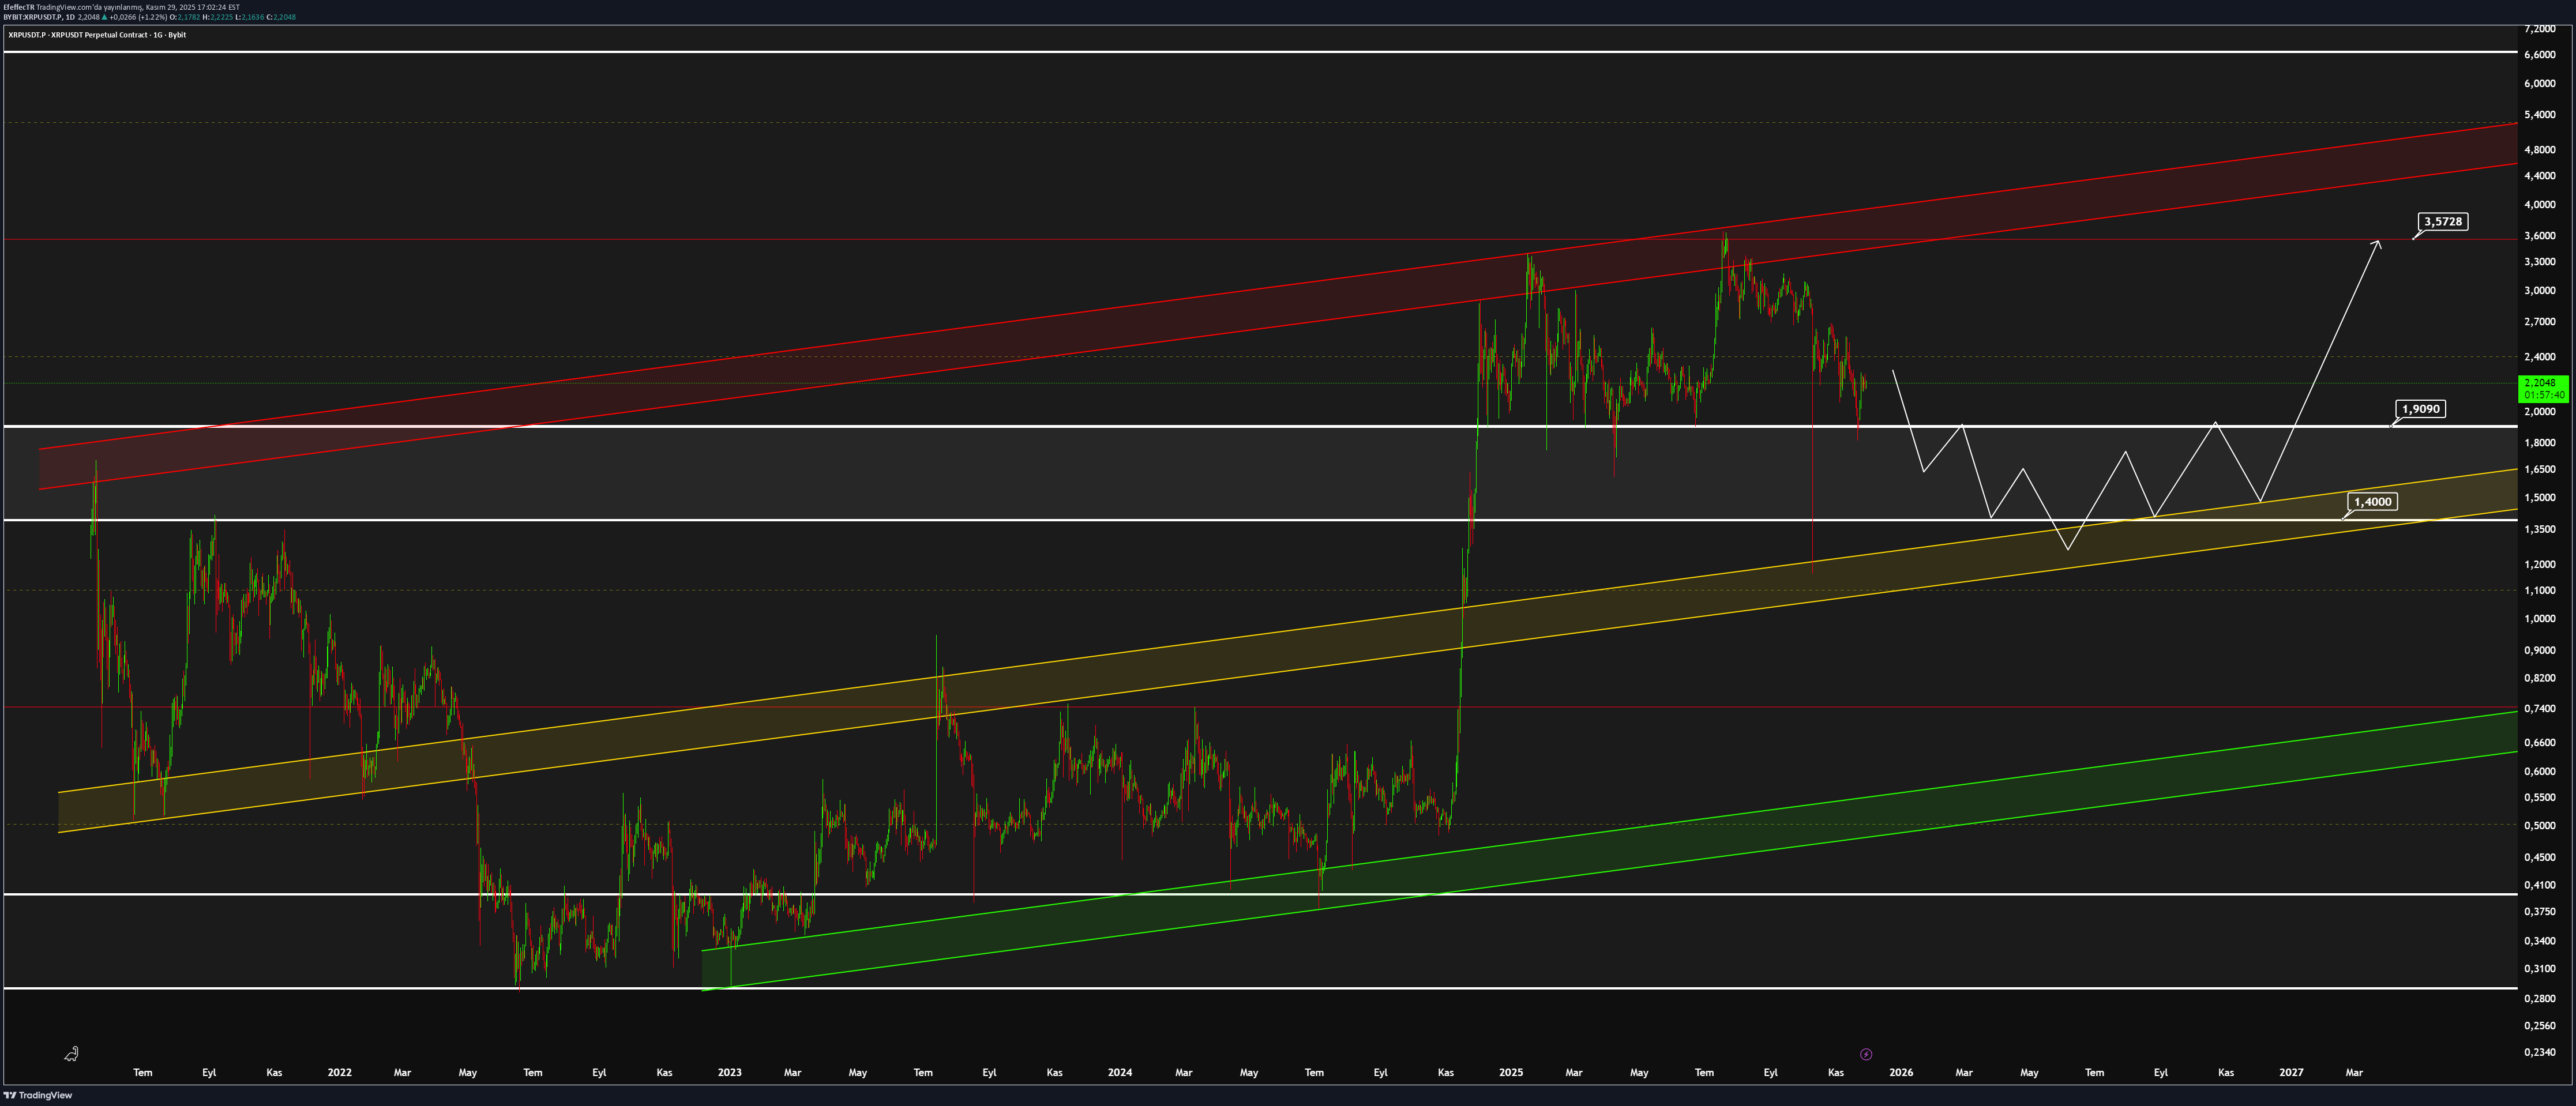
When you look at the XRP chart from a wide perspective, it can be seen that the technical structure is in a perfect "Historical Recurrence". The price has returned to the main support band, which has worked precisely many times in the past and created a serious demand explosion with each contact. Strategic Game Plan: Pursuing "Region" Not "Point" Focusing on a single price can be misleading for assets with high volatility such as XRP. Therefore, it is necessary to read the current retreat as a broad "Demand Accumulation Zone": 🛡️ 1.9090 (First Reception): It is the castle that brakes the decline and where buyers react first. ⚠️ 1.4000 (Maximum Tolerance): It is a safe margin zone for sudden wick movements in the market. Strategy: As long as the price remains within the 1.4000 - 1.9090 band, this movement should be considered as a "gathering strength" phase before the rise, not a downtrend. Trend Indicators and Target: The Yellow (Mid Band) and Red (Upper Band) channels on the chart are the compass of the trend. With institutional response from the current region: 🎯 Main Target: The channel middle band is $3.5728. Conclusion: Technical data shows that XRP is at the most attractive point of the cycle in terms of risk/reward ratio.
آدا (ADA): آیا این کف، نقطه عطف صعودی است؟ تحلیل سطوح حیاتی
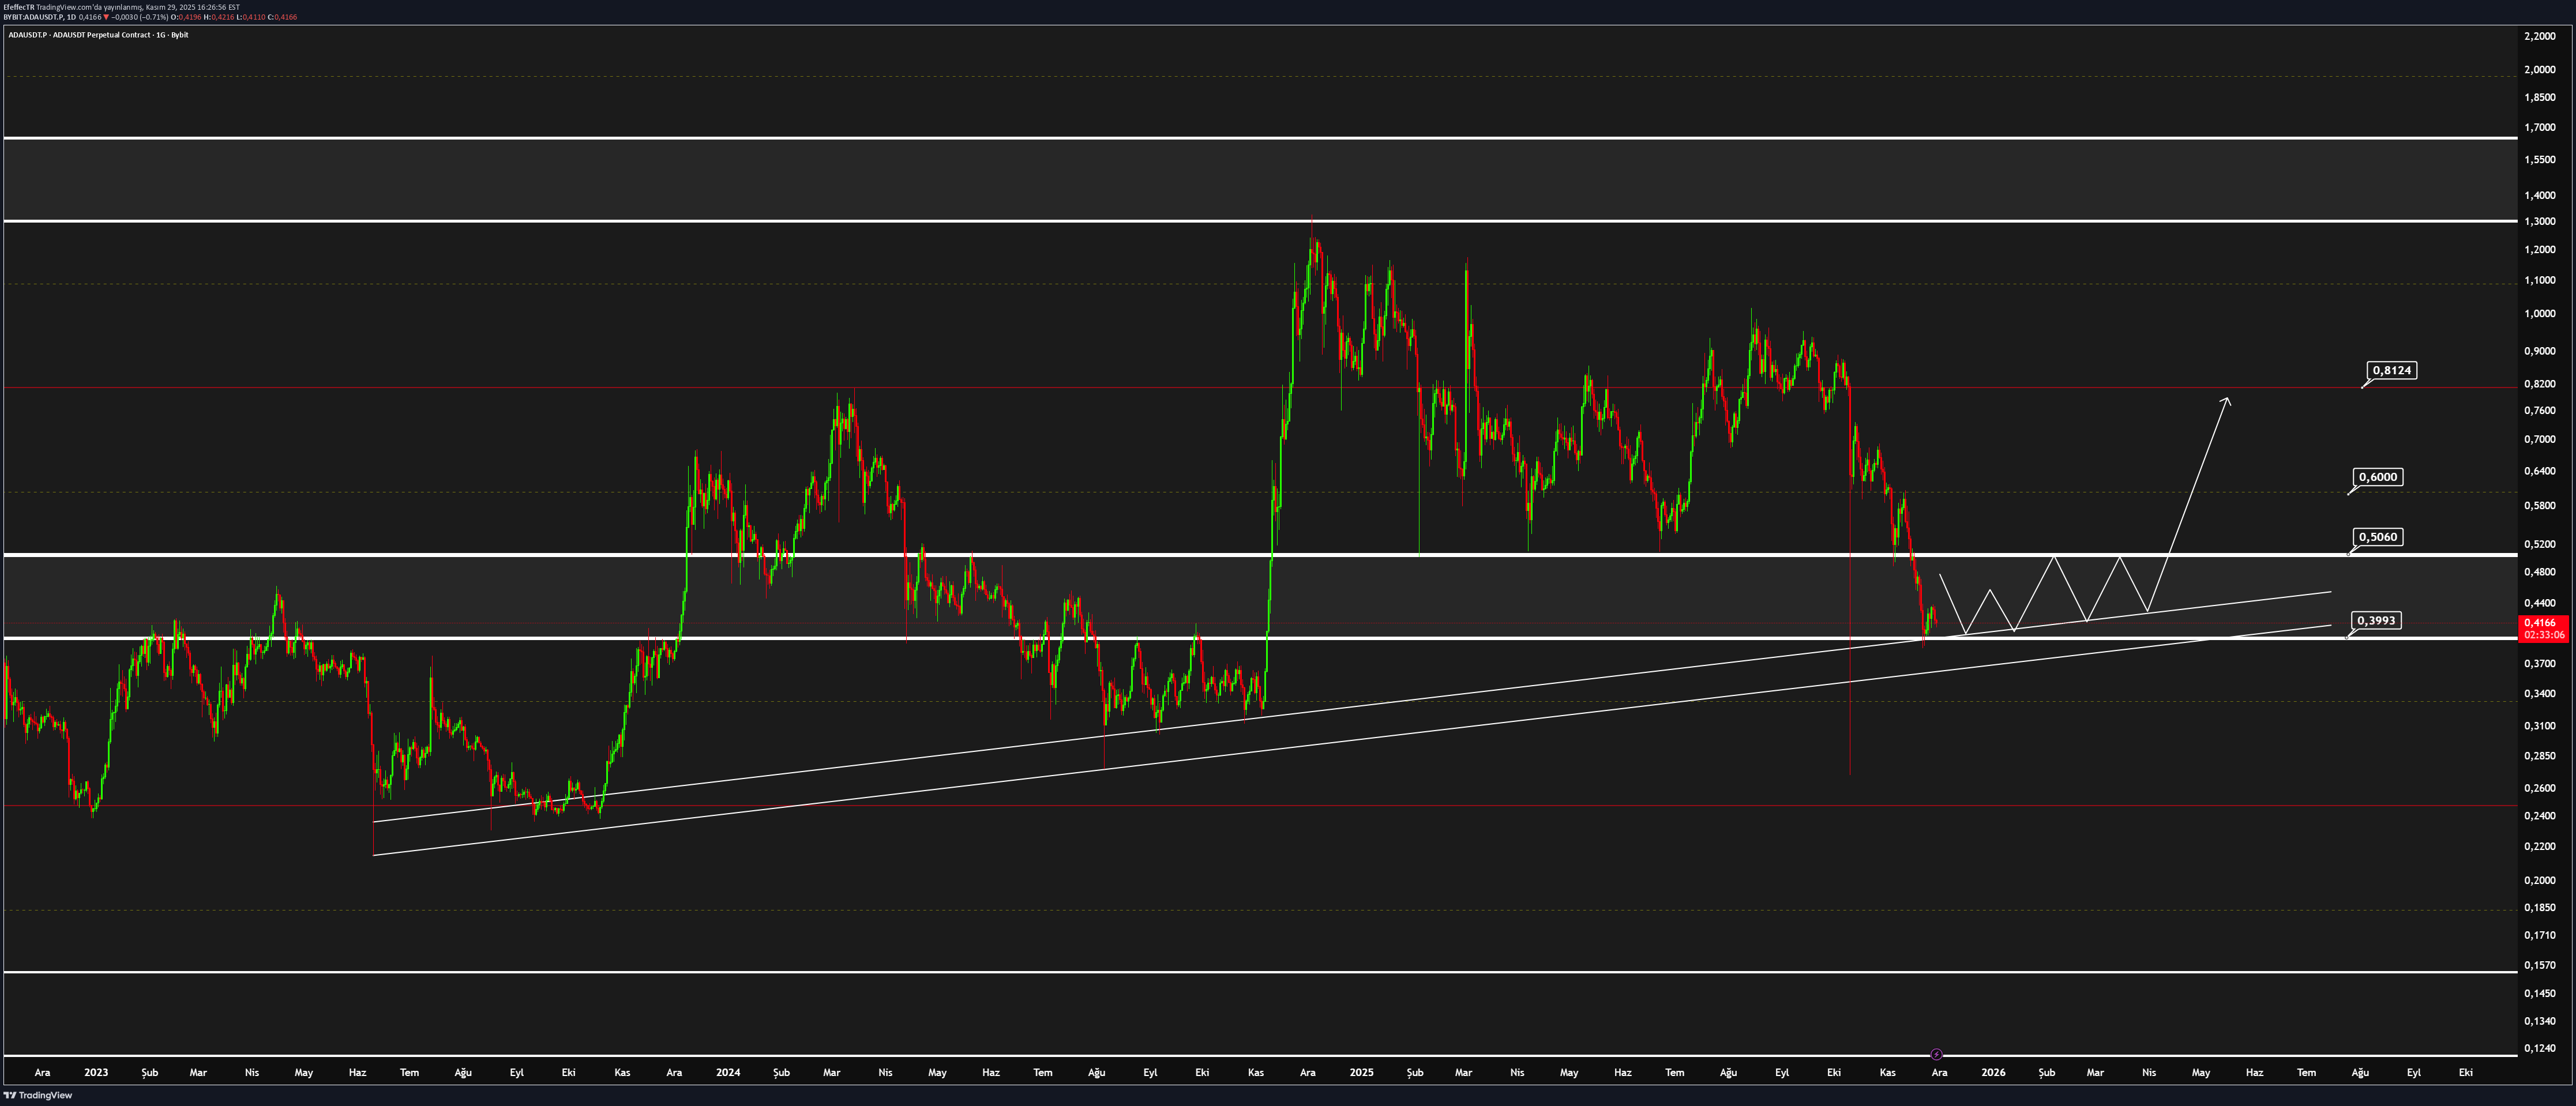
In the long-term perspective, ADA maintains its stable channel movement without disrupting its technical structure. The current position on the chart indicates a decisive moment that will determine the fate of the trend, rather than a simple test of support. The price is currently at the intersection of both the Channel Alt Band and the Main Uptrend line. This makes the region technically a very strong "Demand Region". Current Outlook and Strategy: The technical structure has the potential to start a new upward wave with the reaction the price will receive from this region. However, for this scenario to work, the bulls must overcome certain resistances in volume. Critical Levels on My Watchlist: 🛡️ 0.3993 (Trend Insurance): This level is the main support point. As long as it stays on, the positive outlook is maintained. Day closings below indicate that the channel structure is disrupted and a deepening decline. 📈 0.5060 (First Breath): A move above this level to confirm the exit from the channel alt band indicates that reaction reception is getting stronger. 🔑 0.6000 (Key Threshold): This is the "Key Level" region that must be gained in order for the rise to become a new trend rather than just a reaction. 🎯 0.8125 (Target): If the trend continues by staying true to the channel, the main target is the channel middle band. Conclusion: ADA is in a strategic area in terms of risk/reward ratio. As long as it holds above the 0.3993 support, intra-channel dynamics support the upside.
ETH Teknik Analizi
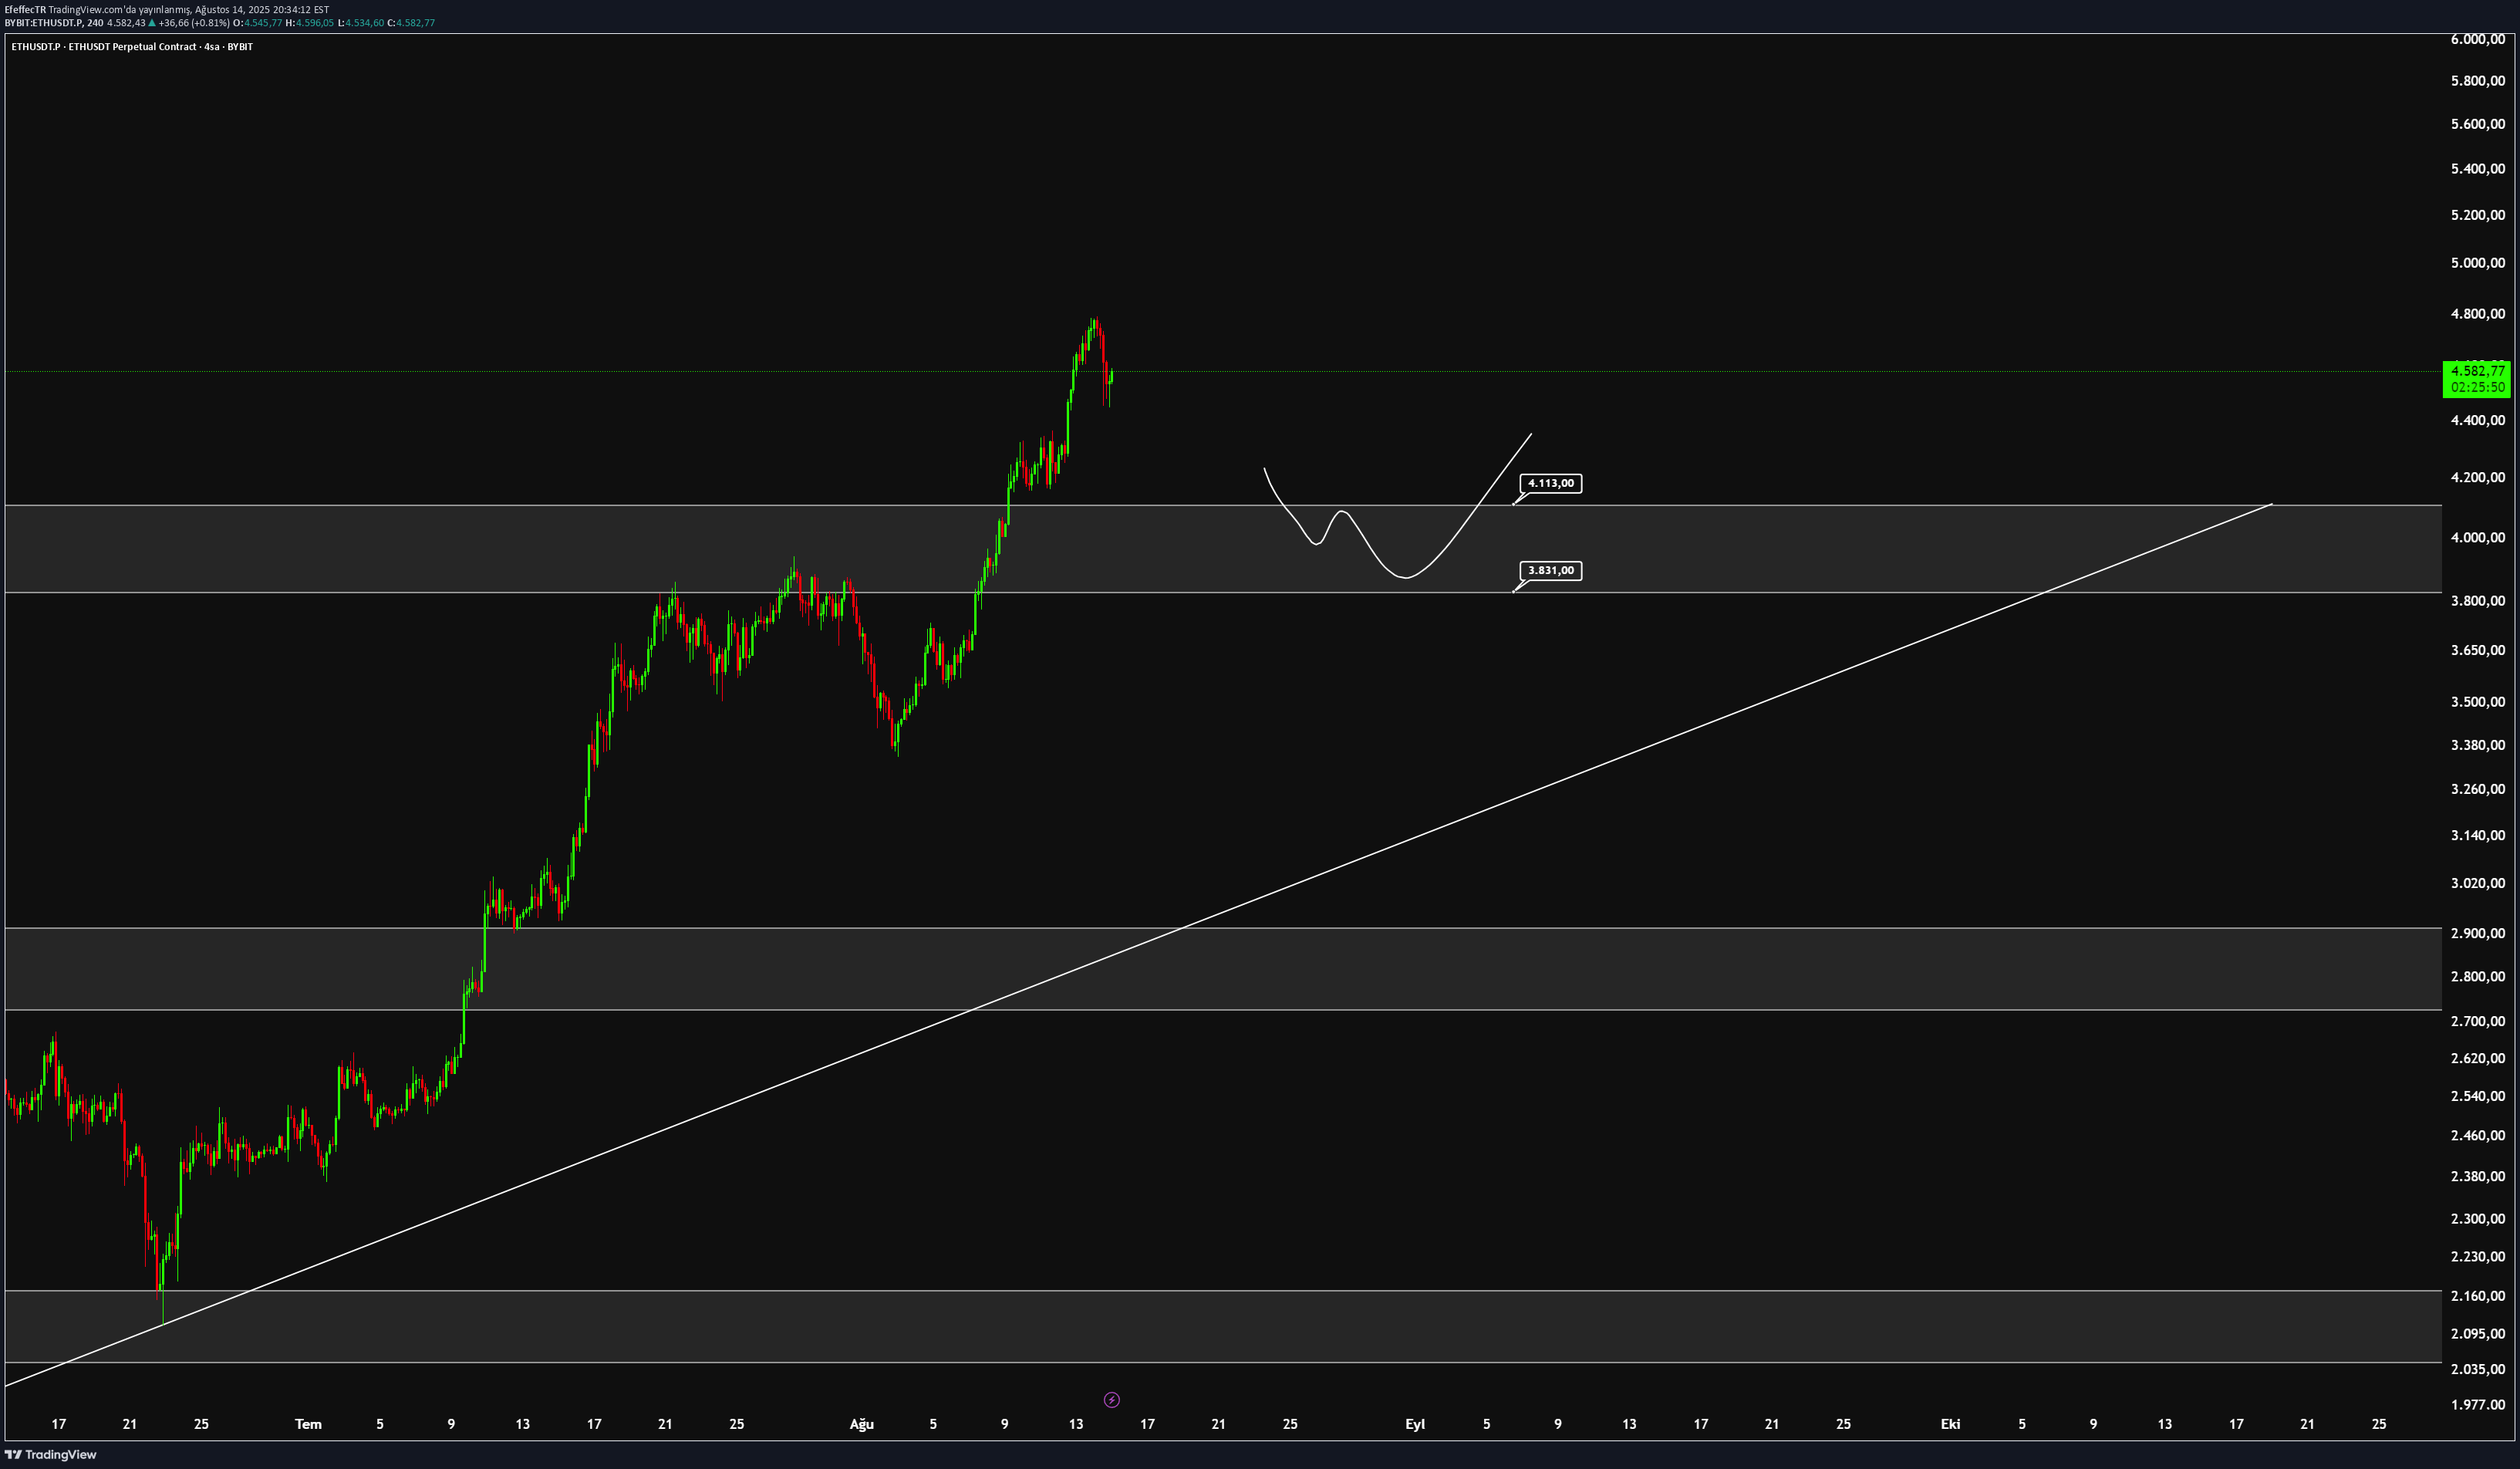
Although Ethereum approached up to the ATH level with its recent harsh rise, it experienced a short -term withdrawal without making a new ATH. Instead of tracking short -term corrections due to the existing volatil structure, 4113 - 3831 band, the more major support zone, should be kept in the foreground. As long as permanence is provided on this region, the upward trend will be technically preserved. However, closing below this level can trigger a deeper correction process. 📌 It is not an investment advice.
JUP Teknik Analizi
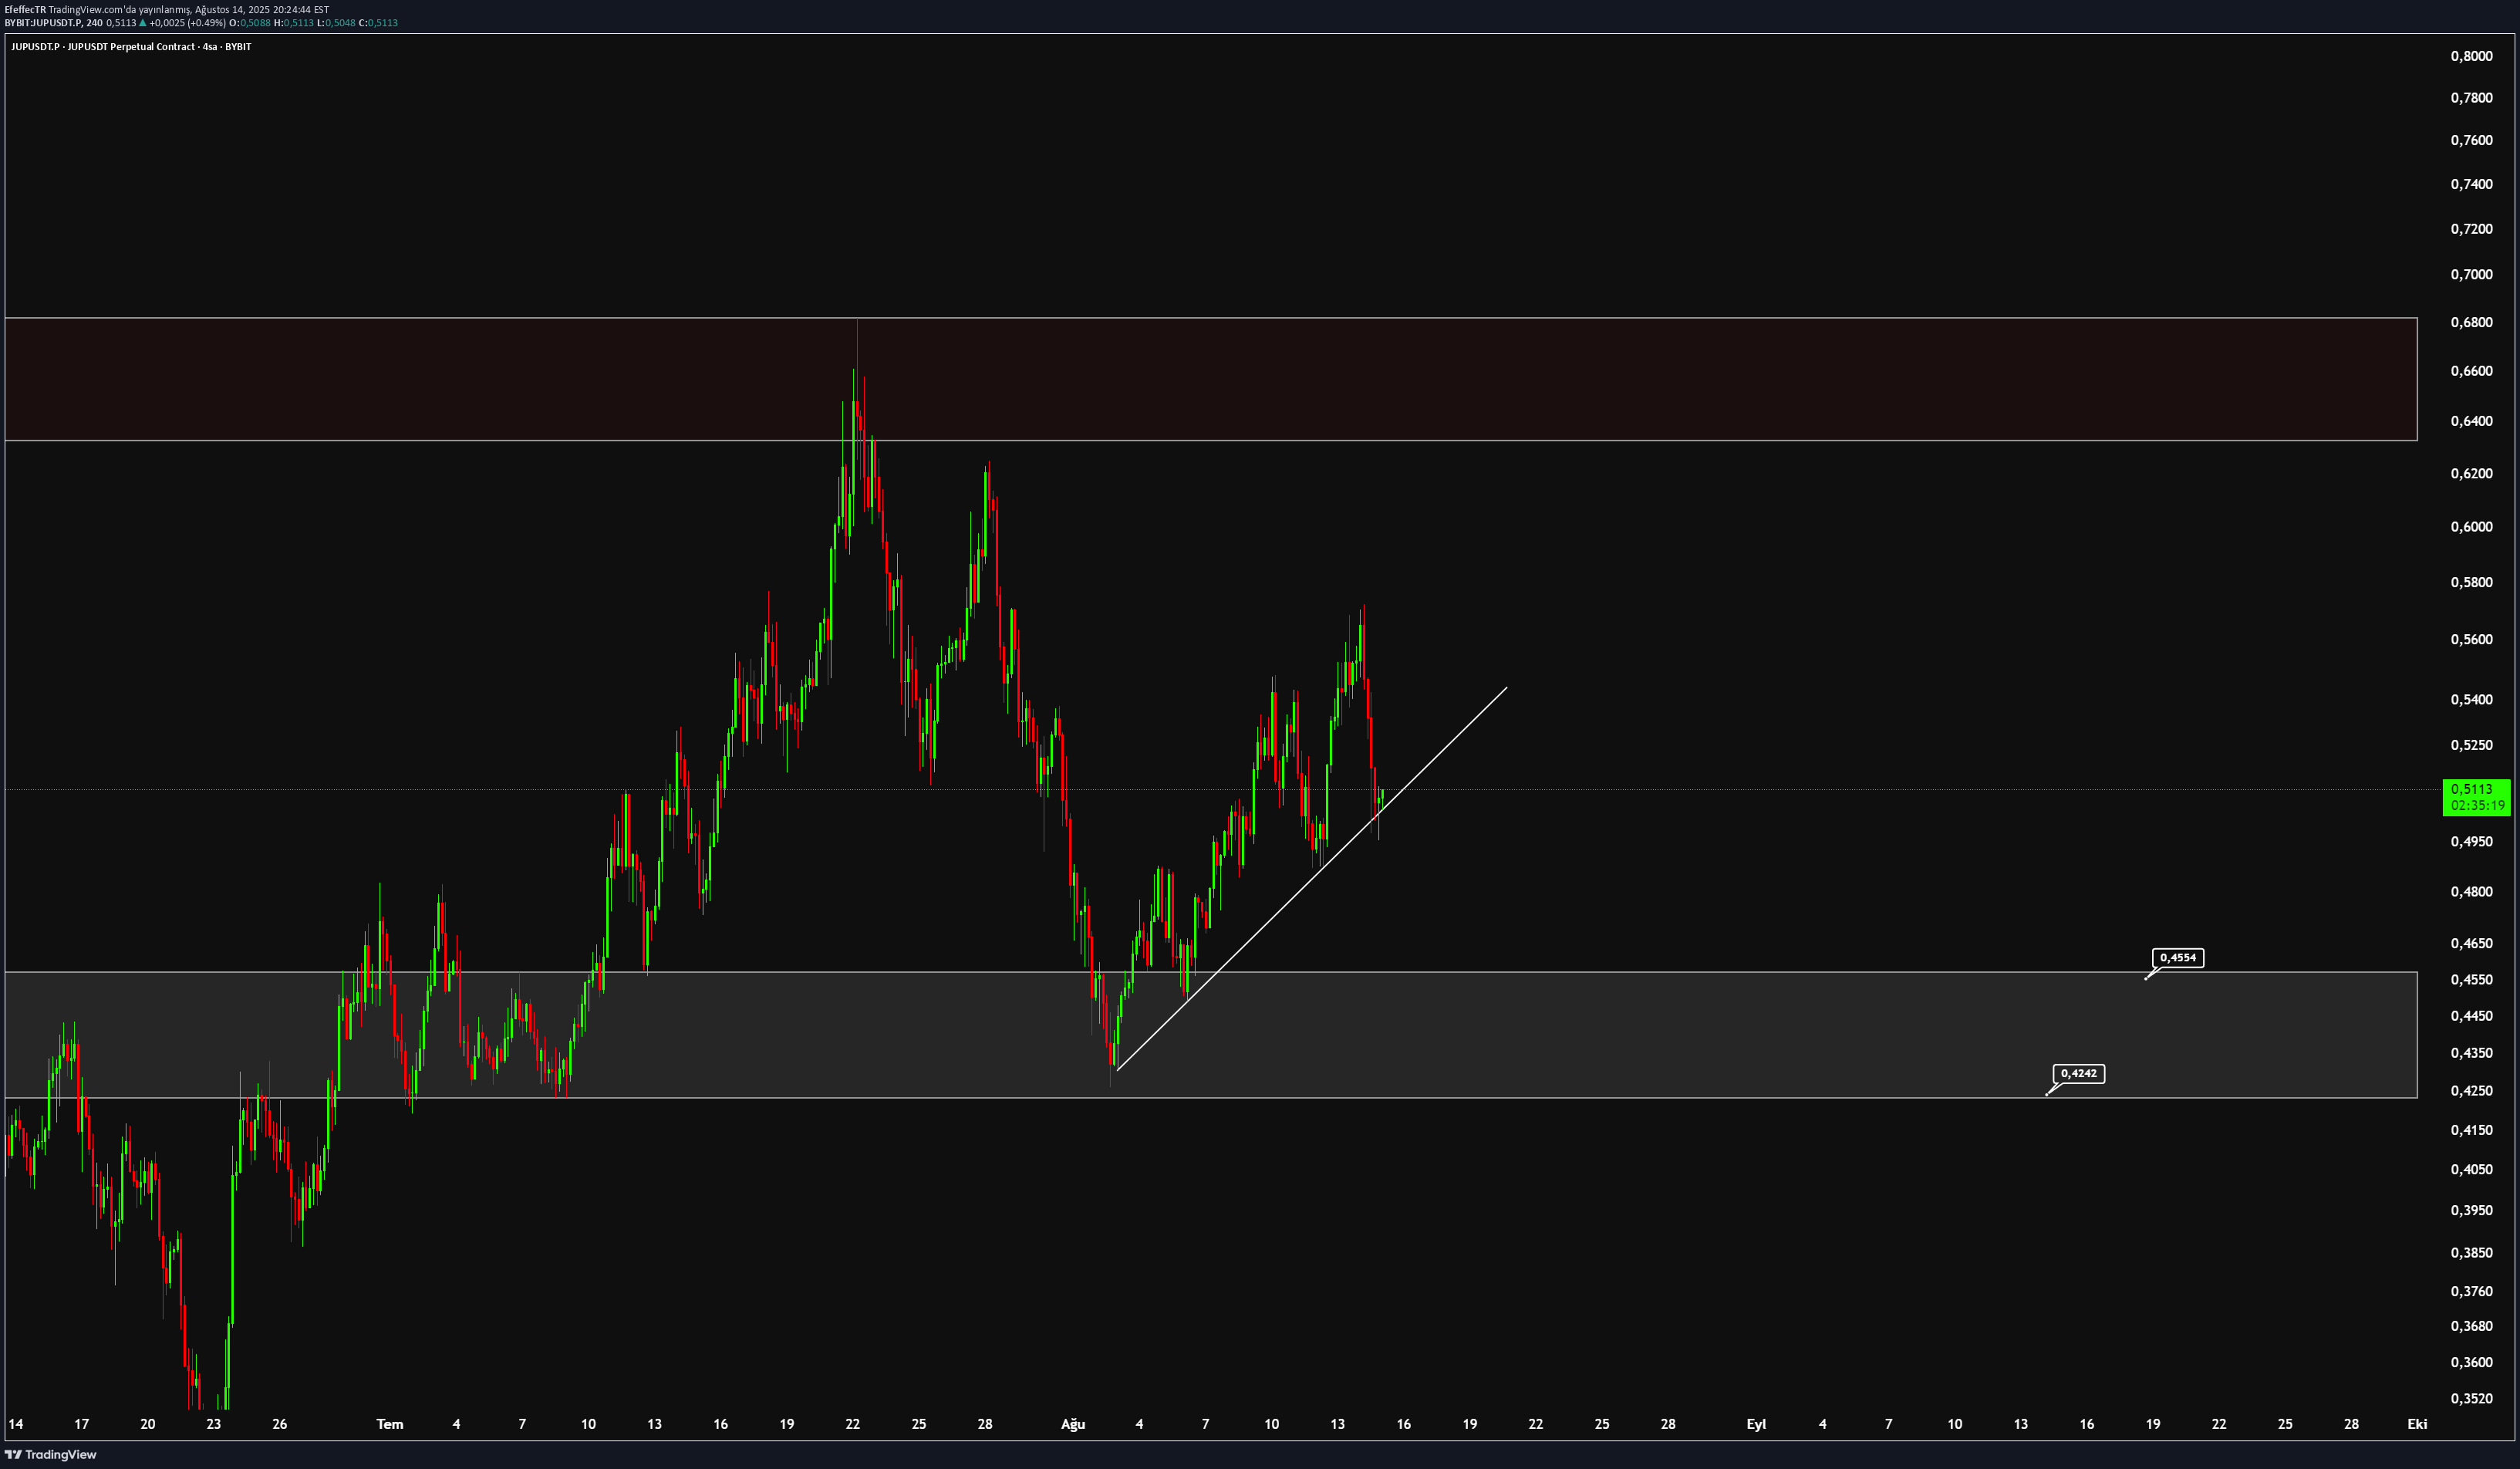
In the latest price movements, the rising trend starting from the demand zone in the 0.4242 - 0.4554 band continues to move the price up. The protection of this trend is critical for the continuation of the rise. If the rising trend cannot be maintained, the price can be re -re -retreat to the main request zone of 0.4242 - 0.4554. This region is the main support position that buyers can re -activate. 📌 It is not an investment advice.
XRP Teknik Analizi
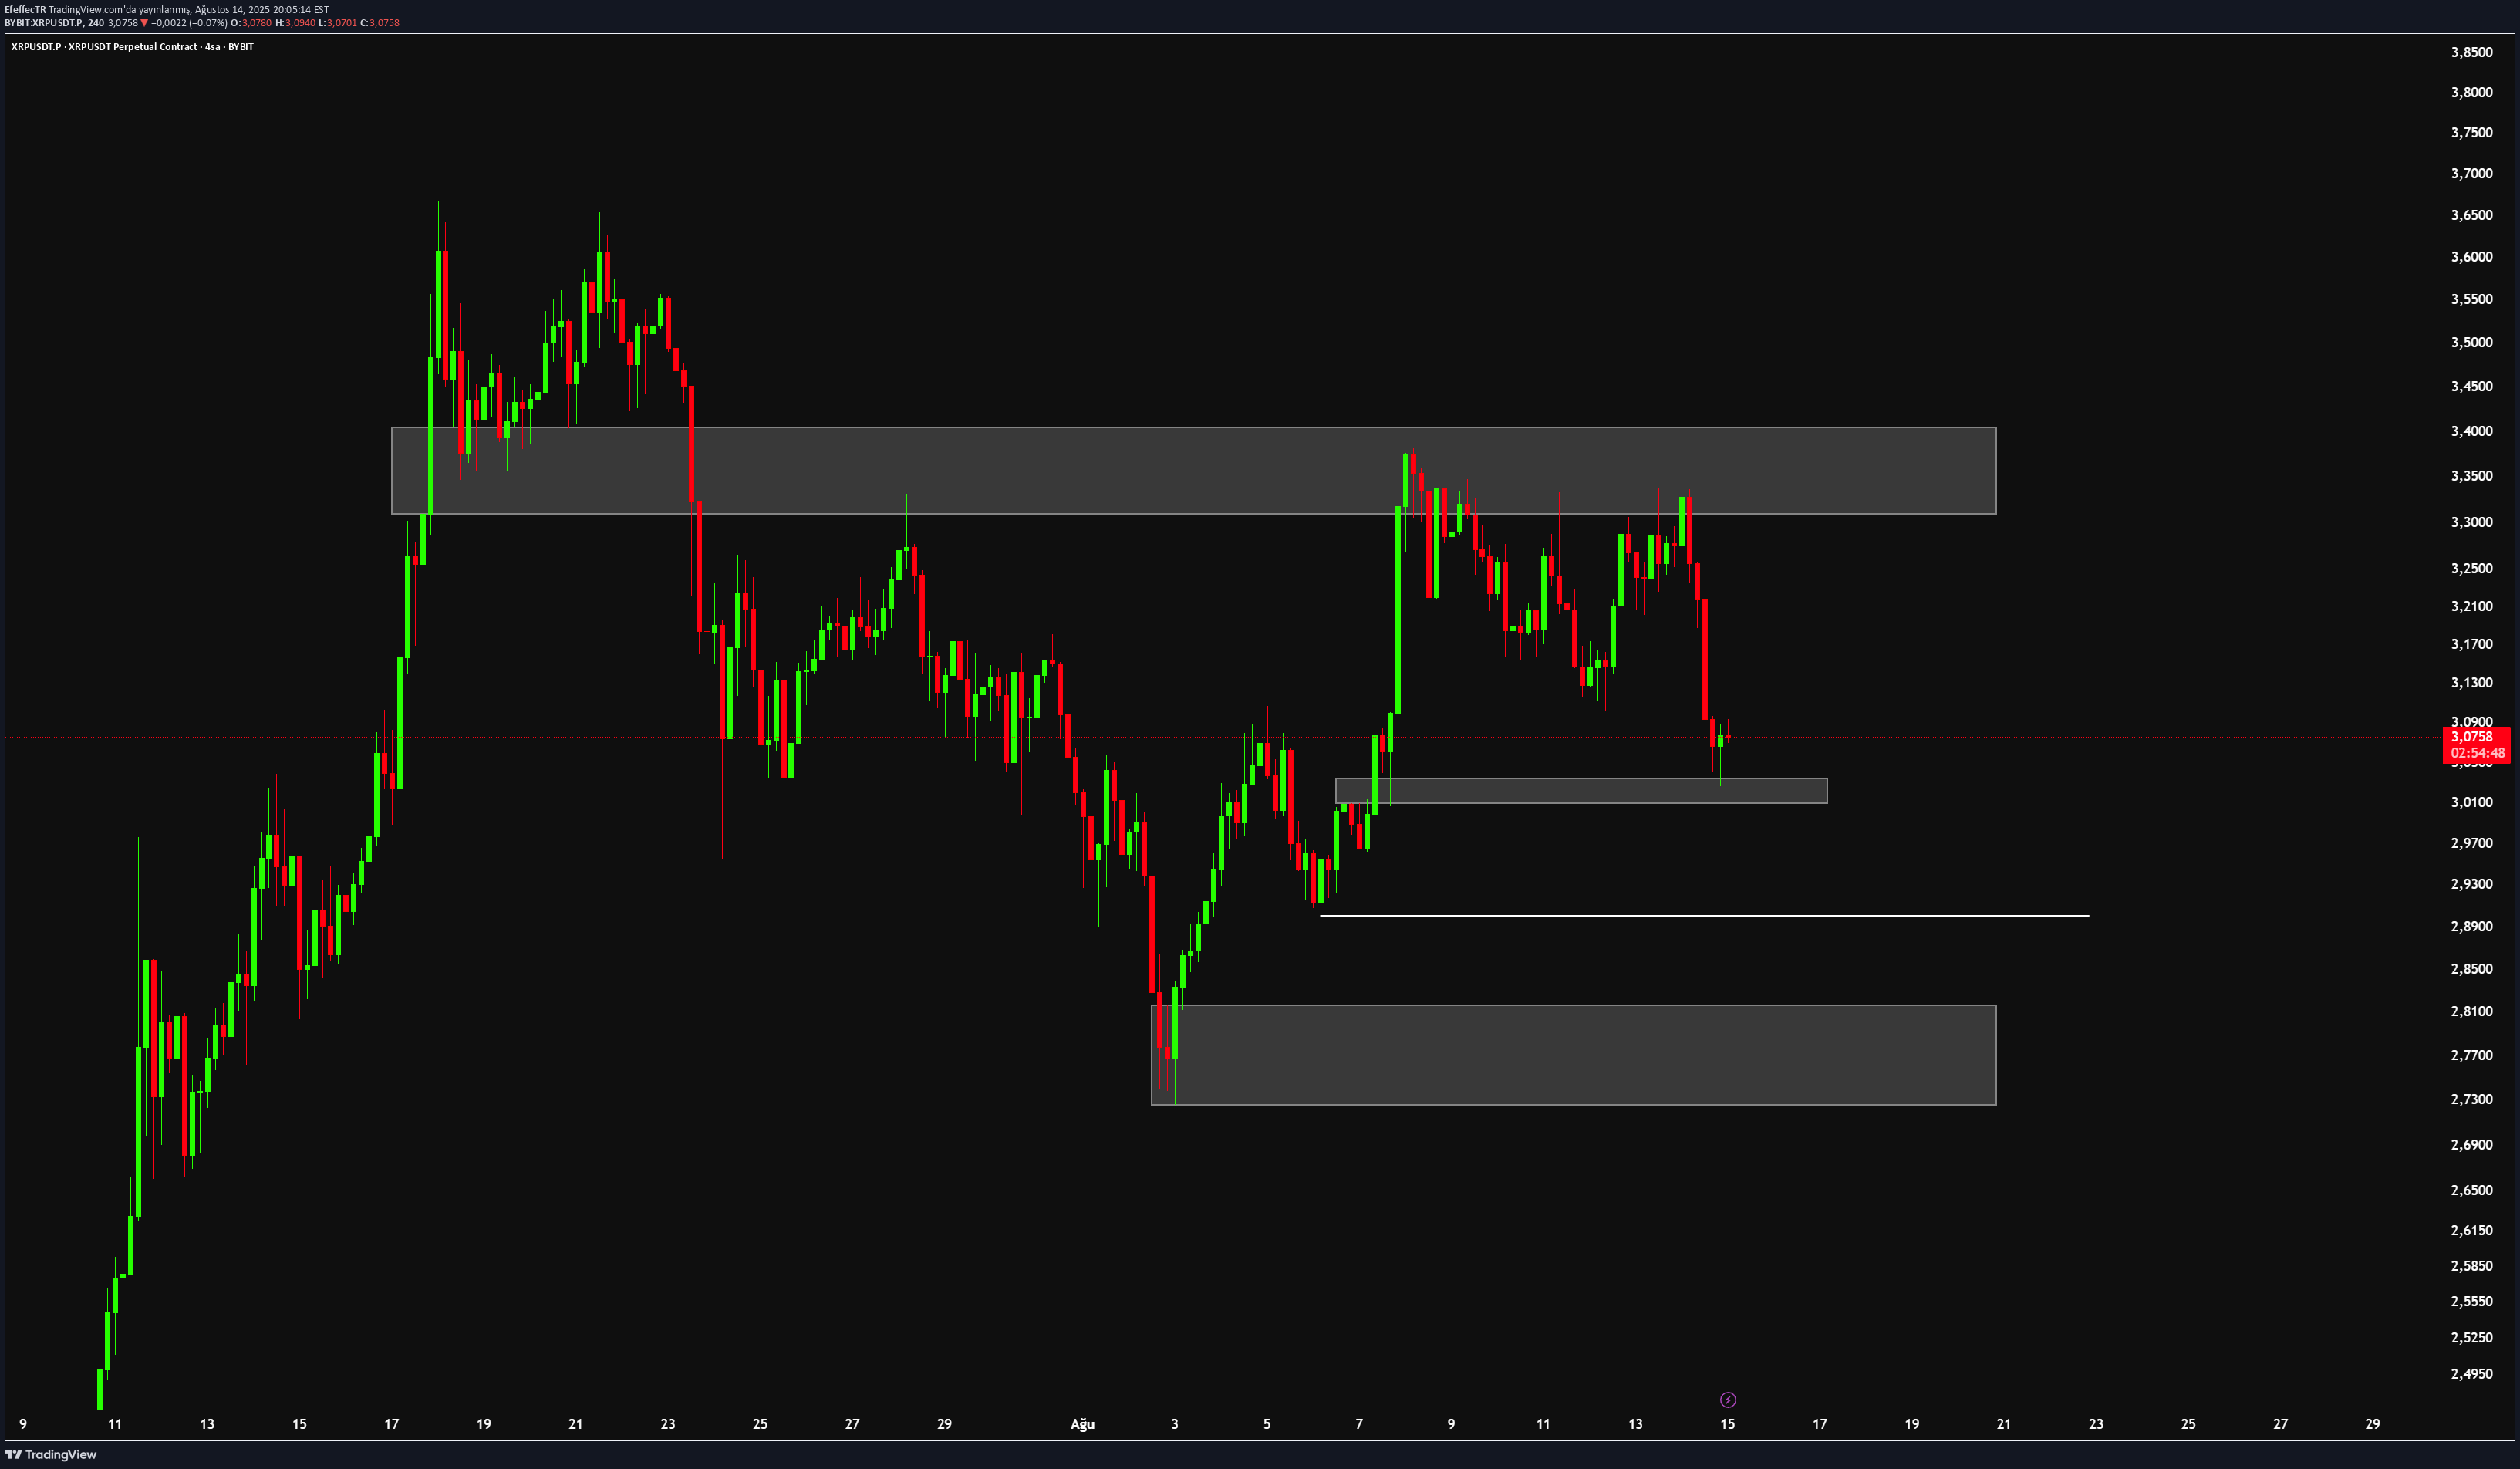
Although the price cannot create a new summit, it still holds above the previous bottom level. 3.01 - 3.04 band stands out as an important region where buyers are activated in the short term. The continuation of permanence on these levels increases the potential to start a movement towards 3.30 in the short term. In a wide term view, permanence over 3.40 level will prepare the ground for strengthening the positive trend and increasing the acceleration of the upward acceleration. On the other hand, with the loss of the first support levels, withdrawal to 2.90 - 2.81 - 2.72, respectively, can be met technically normal. However, the daily/weekly closures that will take place below 2.75 will strengthen the negative appearance for XRP. 📌 It is not an investment advice.
LTC Teknik Analizi
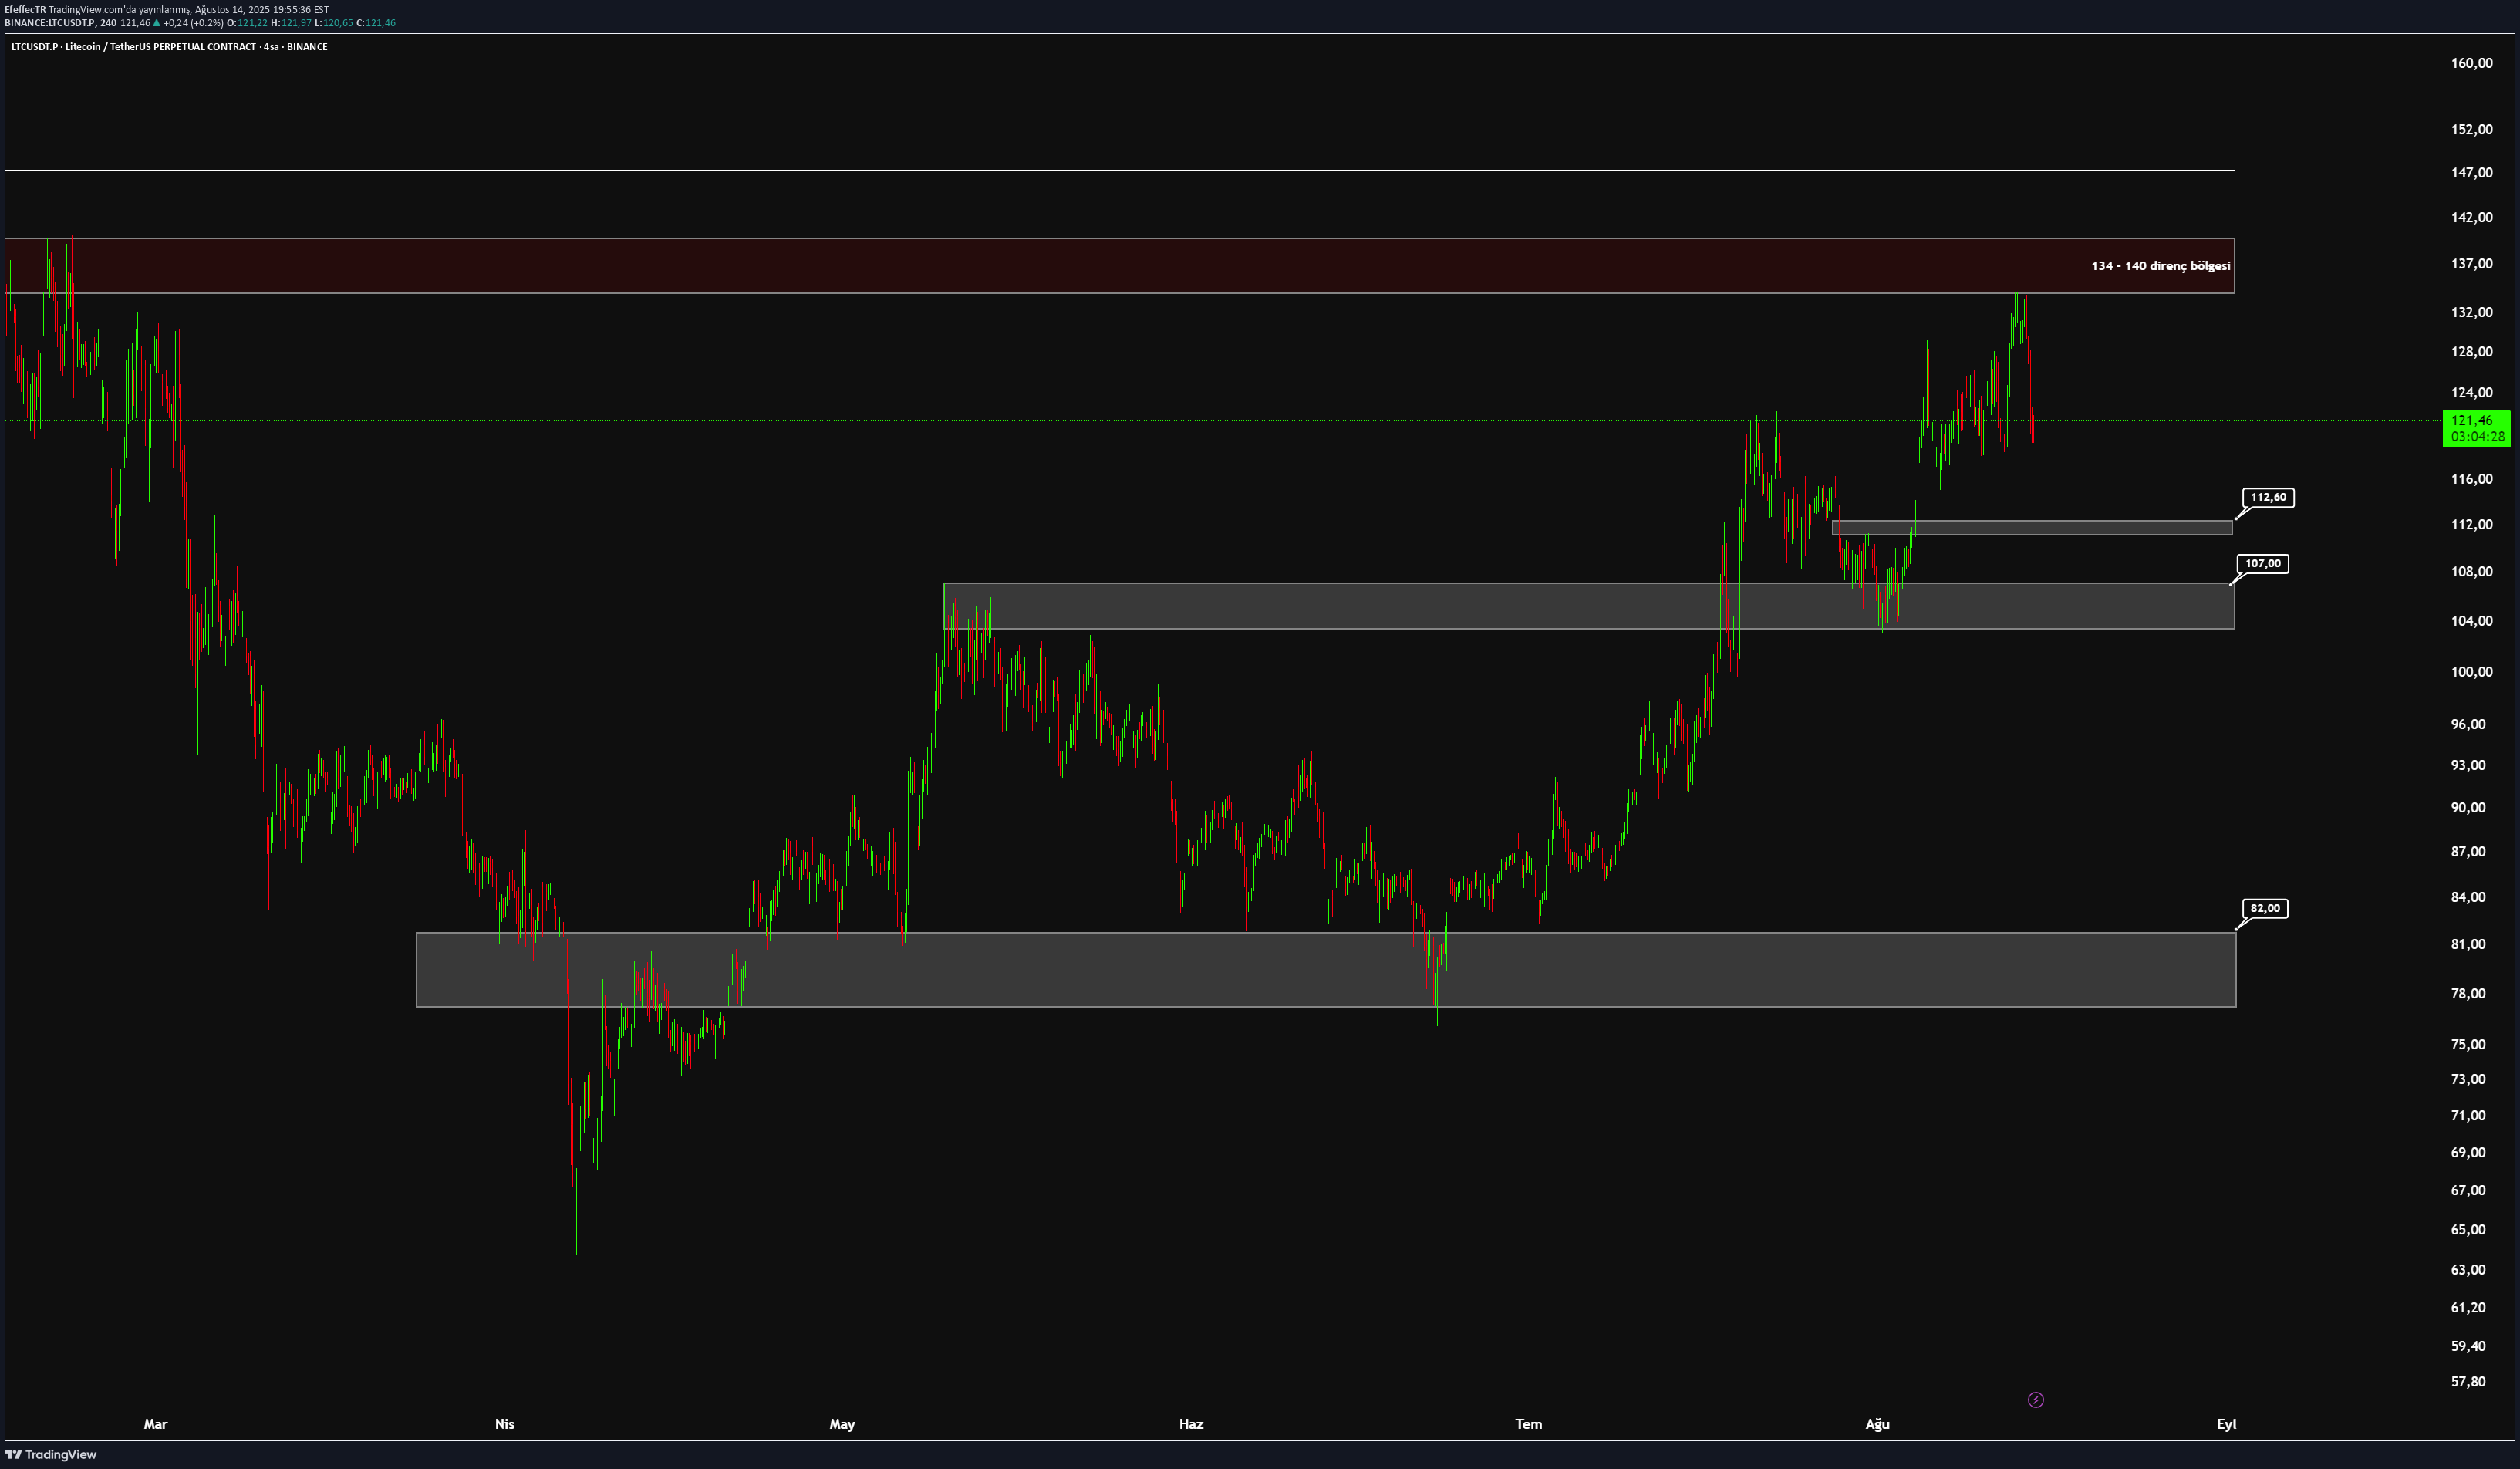
The price withdrew from the strong resistance zone in the 134 - 140 band. In the short term, the range of 111 - 113 in possible corrections is the first intermediate support position and can be evaluated among the levels in which recipients can re -activate. The main support in the medium term is in the 103 - 107 band. In case of persistence under this region, the technical appearance will return to negative and the possibility of deepening sales pressure will increase. 📌 It is not an investment advice.
BTC GENEL SENARYO

در حال حاضر در حال آزمایش روند نزولی هستیم. ۴ روزه که داریم این کار رو میکنیم. قبل از این، کانال حمایتی ۷۵ هزار رو تست کردیم. علاوه بر این، ۷۵۵۰۰ هم سطح ۰.۵ فیبوناچی هست. با شکست احتمالی روند نزولی، تحلیل خودم رو برای هدف ۱۳۰ هزار در میان مدت و ۲۳۰ هزار در میان تا بلند مدت به روز میکنم. اگر نتونیم بشکنیم، مجدداً اهداف پلکانی ۸۰ هزار، ۷۵ هزار، ۷۰ هزار، ۶۰ هزار و ۵۵ هزار رو به ترتیب پیگیری کرد.
Disclaimer
Any content and materials included in Sahmeto's website and official communication channels are a compilation of personal opinions and analyses and are not binding. They do not constitute any recommendation for buying, selling, entering or exiting the stock market and cryptocurrency market. Also, all news and analyses included in the website and channels are merely republished information from official and unofficial domestic and foreign sources, and it is obvious that users of the said content are responsible for following up and ensuring the authenticity and accuracy of the materials. Therefore, while disclaiming responsibility, it is declared that the responsibility for any decision-making, action, and potential profit and loss in the capital market and cryptocurrency market lies with the trader.