
Eagleputt
@t_Eagleputt

What symbols does the trader recommend buying?
Purchase History
پیام های تریدر
Filter
Signal Type
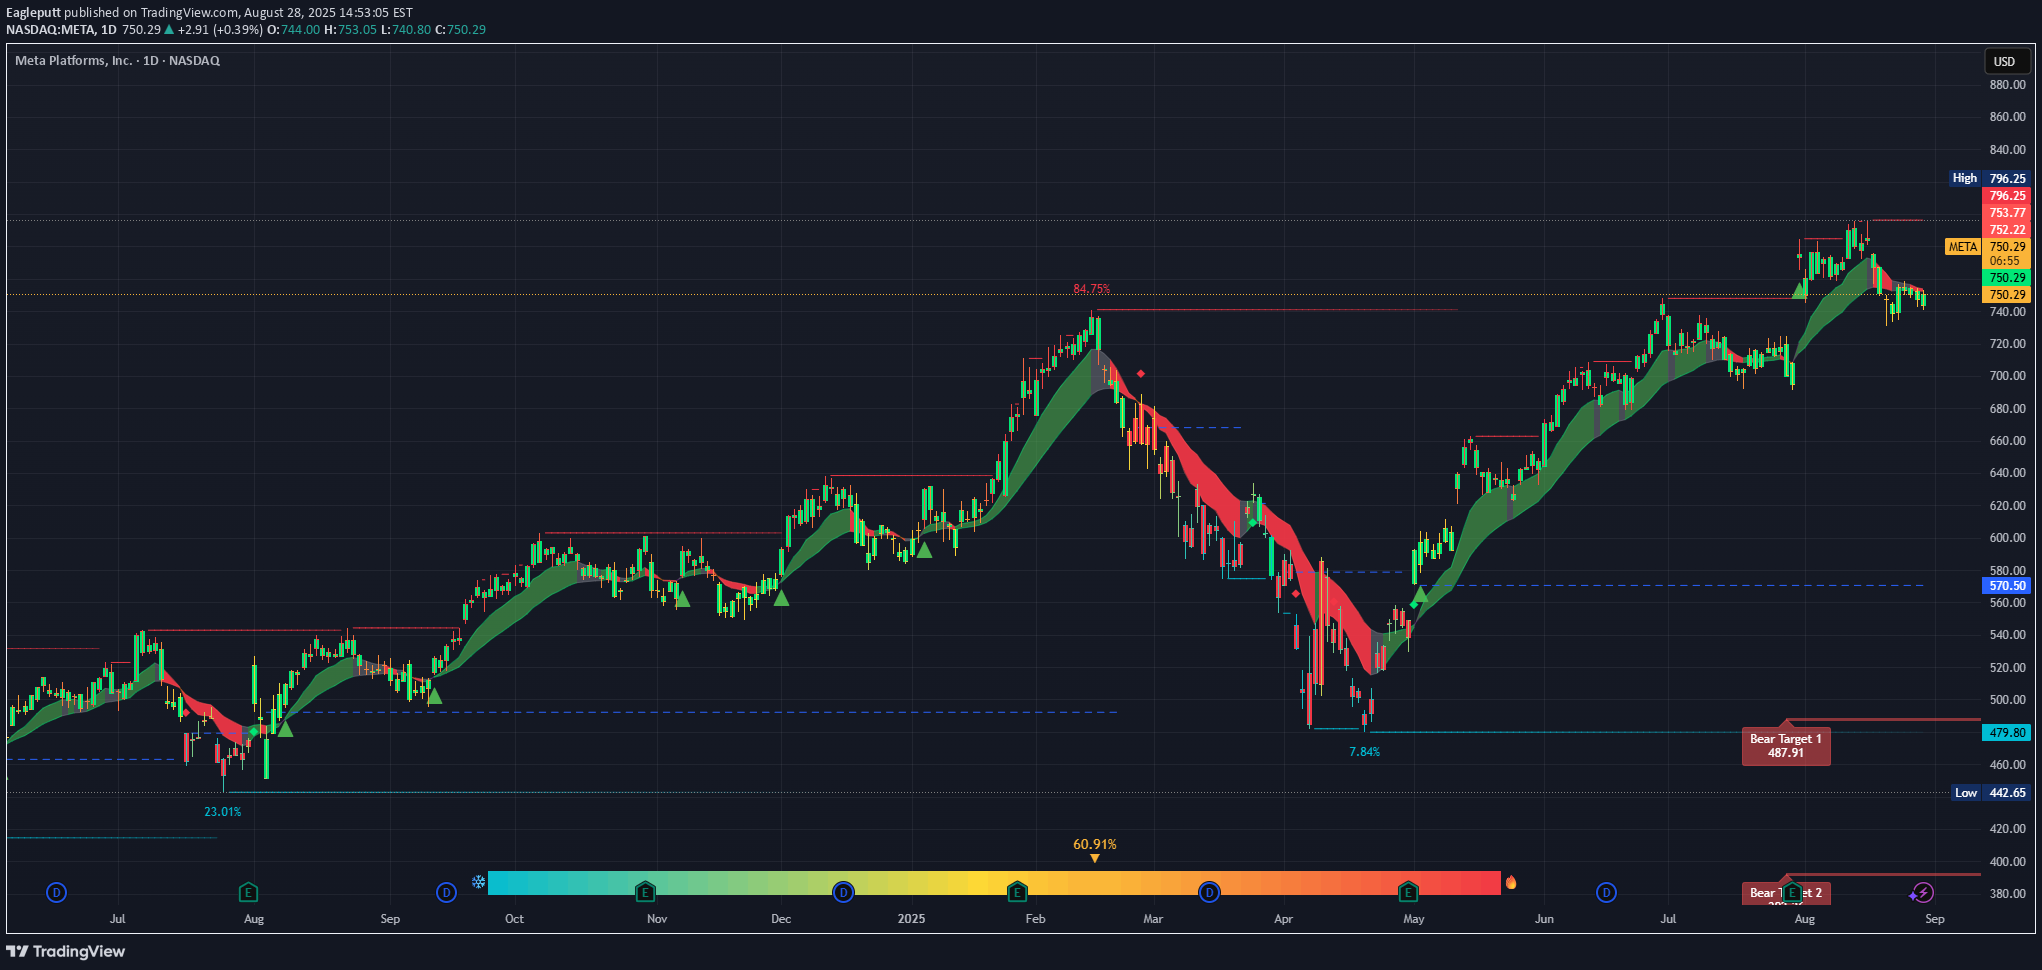
The Good Trend: The longer-term trend is still up. You’ve had a strong run from the April low around ~$570 to the July high near ~$796. That’s nearly a 40% move. Support Zone: The $740–$750 range looks like near-term support. Today’s close at $750.30 is sitting right on it. If this level holds, it’s constructive. Momentum: Even with the recent pullback, the green trend ribbon shows the stock has mostly stayed in bullish structure since May. The Risks Resistance overhead: META hit a wall at $796.25 (previous high) and pulled back sharply. Until price reclaims that area, it’s a ceiling. Distribution signs: The topping candles in July–August show selling pressure near the highs. If $740 fails, the next support is closer to $700–$710. Bearish targets: Your chart shows a “Bear Target 1” at $487.91. That’s extreme, but it signals risk if the broader market turns. Cost vs. Benefit Upside: If $750 holds, META could retest $780–$796 (a potential ~6% upside). Downside: If $740 breaks, META could revisit $700 (a ~7% downside), and if sentiment really cracks, $570 isn’t out of the question. Brutally Honest Take Right now META looks neutral to cautiously bullish—the longer trend is intact, but short-term momentum is shaky. This isn’t a “high-probability breakout” spot; it’s a wait-for-confirmation level. If you’re trading, the risk/reward is about even here.

The Good Recovery off lows: That sharp reversal from ~$165 back above $230 shows strong buyer support. The +36% bounce (highlighted on chart) is impressive. Trend alignment: Shorter EMAs are stacked above longer ones again, suggesting bullish momentum is back. Volume: Decent participation on the rebound, not a weak drift higher. The Bad Heavy resistance overhead: $235–$240 is a supply zone. Price has stalled there multiple times, and you can see past rejection points at 235, 260. This area must be cleared for continuation. Lower high risk: Unless AAPL breaks above $260, it could be setting up a “lower high” compared to past peaks (Feb & July 2024). Valuation risk: Apple isn’t cheap right now. Macro risk (Fed cuts, consumer spending slowdown, China supply chain issues) could make it more vulnerable than Nvidia/semis. The Ugly Previous deep drawdowns: AAPL saw nearly a -36% correction not long ago. That’s a reminder this is not a low-risk hold anymore. One earnings miss or weak iPhone cycle could re-trigger that. Crowded trade: Everyone owns Apple. Hedge funds, ETFs, retail. If big money rotates out, selling pressure is brutal. Cost vs. Benefit Benefit: If Apple breaks $240 convincingly, next stop is likely $260 (prior high). That’s ~12% upside. Cost: If it fails here and rolls over, you could be looking at a drop back to $215 (near 50-day/200-day confluence) or even $200 (~15% downside).
Disclaimer
Any content and materials included in Sahmeto's website and official communication channels are a compilation of personal opinions and analyses and are not binding. They do not constitute any recommendation for buying, selling, entering or exiting the stock market and cryptocurrency market. Also, all news and analyses included in the website and channels are merely republished information from official and unofficial domestic and foreign sources, and it is obvious that users of the said content are responsible for following up and ensuring the authenticity and accuracy of the materials. Therefore, while disclaiming responsibility, it is declared that the responsibility for any decision-making, action, and potential profit and loss in the capital market and cryptocurrency market lies with the trader.