Technical analysis by Eagleputt about Symbol METAX on 8/28/2025

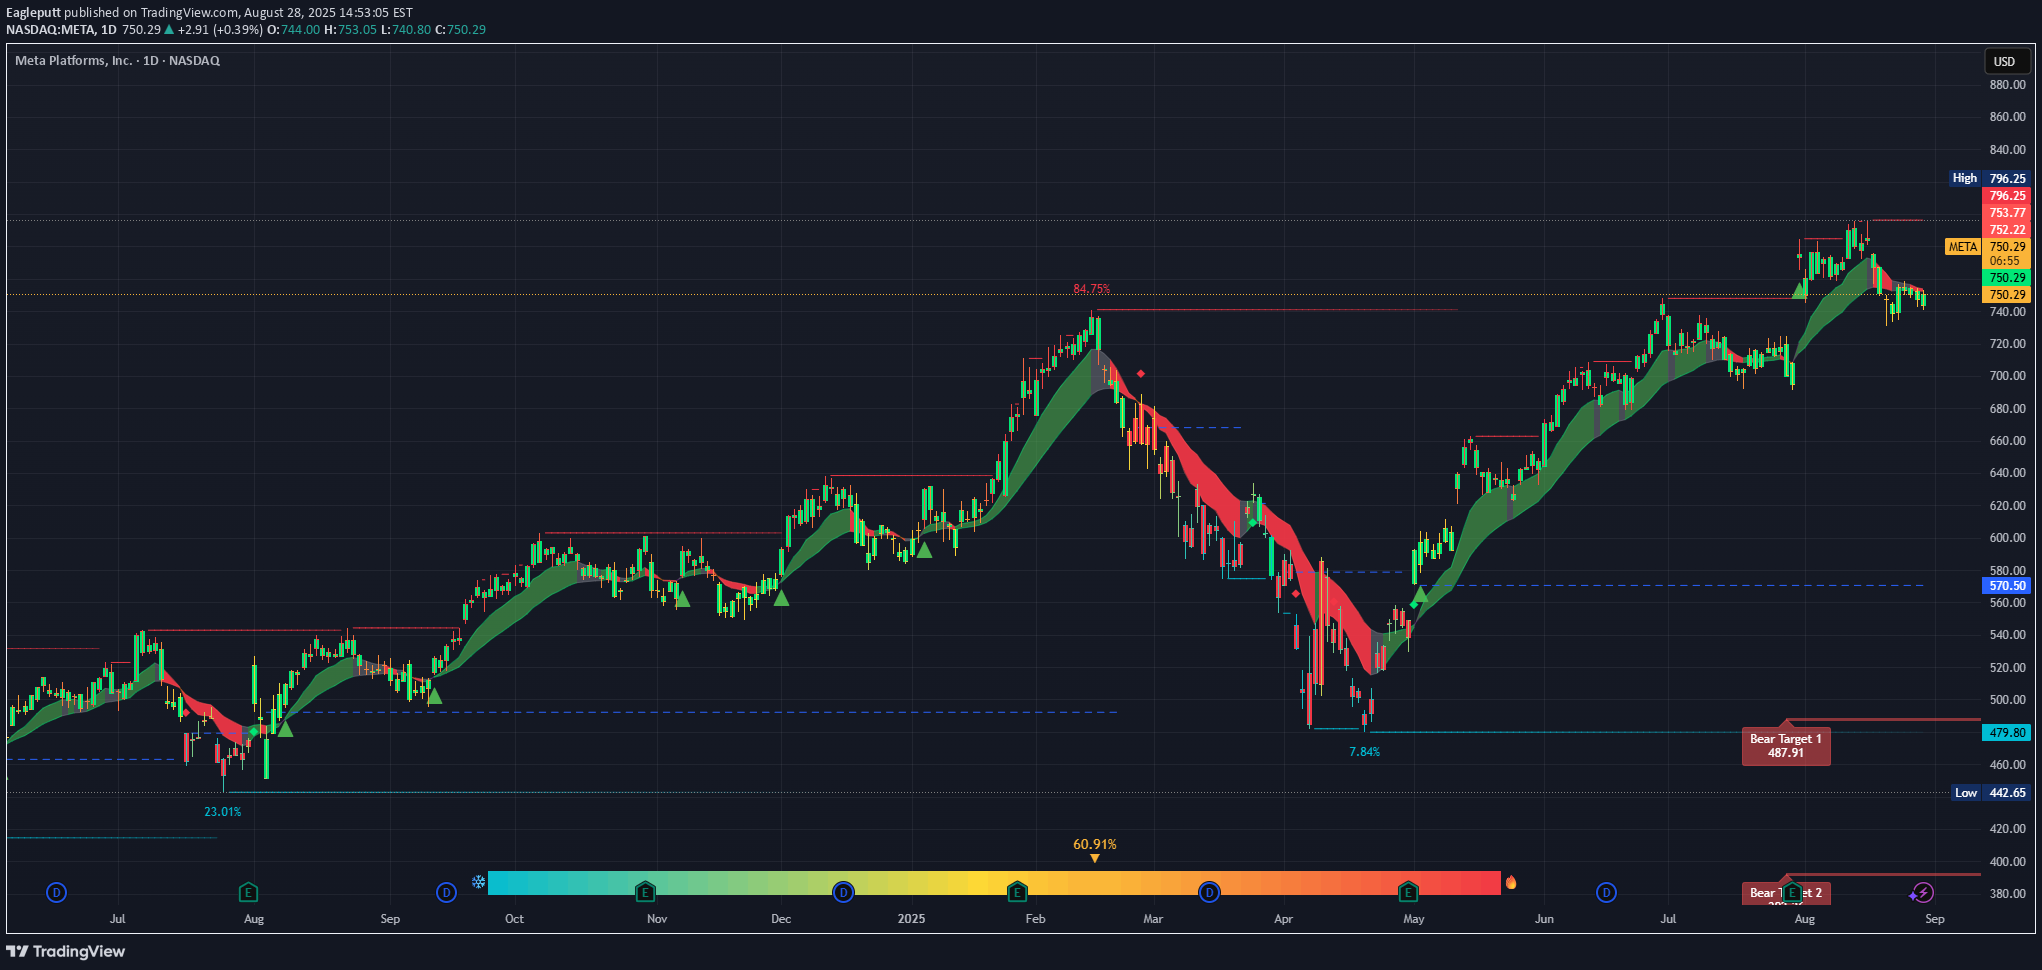
The Good Trend: The longer-term trend is still up. You’ve had a strong run from the April low around ~$570 to the July high near ~$796. That’s nearly a 40% move. Support Zone: The $740–$750 range looks like near-term support. Today’s close at $750.30 is sitting right on it. If this level holds, it’s constructive. Momentum: Even with the recent pullback, the green trend ribbon shows the stock has mostly stayed in bullish structure since May. The Risks Resistance overhead: META hit a wall at $796.25 (previous high) and pulled back sharply. Until price reclaims that area, it’s a ceiling. Distribution signs: The topping candles in July–August show selling pressure near the highs. If $740 fails, the next support is closer to $700–$710. Bearish targets: Your chart shows a “Bear Target 1” at $487.91. That’s extreme, but it signals risk if the broader market turns. Cost vs. Benefit Upside: If $750 holds, META could retest $780–$796 (a potential ~6% upside). Downside: If $740 breaks, META could revisit $700 (a ~7% downside), and if sentiment really cracks, $570 isn’t out of the question. Brutally Honest Take Right now META looks neutral to cautiously bullish—the longer trend is intact, but short-term momentum is shaky. This isn’t a “high-probability breakout” spot; it’s a wait-for-confirmation level. If you’re trading, the risk/reward is about even here.
