
EIP-EverythingIsPlanned
@t_EIP-EverythingIsPlanned

What symbols does the trader recommend buying?
Purchase History
پیام های تریدر
Filter
EIP-EverythingIsPlanned
Bitcoin B-Wave Trap? Major C-Wave Down Correction Incoming!

Bitcoin’s recent bounce has all the signs of a classic B-wave in an ABC corrective structure. After the impulsive A-wave down from the highs, this current rally appears more like a corrective relief move rather than the start of a new bullish impulse. Volume remains weak and the structure looks choppy — not the kind of strength you’d expect from a sustainable uptrend. I believe we are now completing the B-wave, luring in late bulls before the real drop — the C-wave — begins. This next leg down could be sharp and painful, targeting key support zones and possibly wiping out the complacency that’s built up in the market. 🧠 Watch for signs of exhaustion in this rally. 📉 Potential C-wave targets: 98k 97k ⏳ Timing and structure suggest we’re close to the turning point. Stay cautious. This could be the calm before the real storm. ---
EIP-EverythingIsPlanned
march rally coming for bitcoin BTCUSD BTC!

Bitcoin's price action is also influenced by broader financial cycles and patterns that are more subtle. Here's a look at those: General Financial Cycles: Market Sentiment Cycles: Like all financial markets, Bitcoin experiences cycles of fear and greed. These psychological waves drive price fluctuations, with periods of euphoria leading to overbought conditions and subsequent corrections. These cycles are often amplified in the cryptocurrency market due to its 24/7 nature and the prevalence of social media. Economic Cycles: Bitcoin's performance can be influenced by macroeconomic trends, such as inflation, interest rates, and global economic growth. In times of economic uncertainty, some investors may turn to Bitcoin as a hedge against traditional assets. Conversely, during periods of strong economic growth, capital may flow into more traditional investments. Adoption Cycles: Bitcoin's adoption by individuals and institutions follows a pattern of gradual growth, punctuated by periods of rapid acceleration. As adoption increases, liquidity improves, and the market becomes more mature, which can influence price volatility and long-term trends. "Secret" or Less Obvious Bitcoin Cycles: On-Chain Data Cycles: Analysis of Bitcoin's blockchain data reveals patterns in investor behavior, such as accumulation and distribution phases. Metrics like: Hodl waves: which track the age of bitcoin held in wallets. Entity adjusted dormancy: which shows when older coins are being moved. These can give indications of underlying cycle activity. Liquidity Cycles: The flow of liquidity into and out of the Bitcoin market can create its own cycles. Periods of high liquidity can fuel price increases, while periods of low liquidity can exacerbate price declines. The availability of stablecoins, and the actions of large market makers, effect these cycles. Technological Adoption Cycles: The development and adoption of layer 2 solutions, and other technological improvements to the bitcoin network, can create their own cyclical impacts on the bitcoin price. These cycles are less predictable, but can have profound long term effects. It's important to understand that these cycles are interconnected and can overlap, making it challenging to isolate their individual effects. Additionally, the cryptocurrency market is still relatively young, and its cycles may evolve over time.
EIP-EverythingIsPlanned
Bitcoin BTCUSD Bitcoin futures to correct to 89k 88k crypto

### Bitcoin Technical Analysis: Anticipating a Correction from 98K to 88K #### **Current Market Context** Bitcoin has shown a remarkable rally, reaching $98,000, driven by strong momentum, increased institutional participation, and retail euphoria. However, technical indicators suggest a potential correction to $88,000 before the next leg upward. Here's why: --- #### **1. Overbought Conditions** - **RSI (Relative Strength Index):** On the daily chart, Bitcoin's RSI has surged above 85, indicating extreme overbought conditions. Historically, such levels have preceded short-term corrections as the market cools down. - **Stochastic Oscillator:** The stochastic also shows a bearish divergence, where price makes higher highs, but the indicator forms lower highs. --- #### **2. Key Resistance at 98K ** - **Fibonacci Extension Levels:** Using the previous swing low at $75K and the recent high at 98K , the 2.618 Fibonacci extension aligns with the current resistance zone, signaling a potential reversal area. - **Psychological Level:** $100K is a major psychological barrier. Traders often front-run such levels, leading to selling pressure just below it. --- #### **3. Volume Profile** - **Decreasing Volume:** The rally to 98K has been on declining volume, indicating weakening buying interest. A healthy uptrend typically requires increasing volume to sustain higher prices. - **Volume Gap Below $90K:** There is a visible volume gap in the range of 88K –$90K, which could act as a magnet for price as it seeks strong support. --- #### **4. Moving Averages and Support Levels** - **Exponential Moving Averages (EMA):** The 21-day EMA is currently at 87K , aligning with the projected correction target. A reversion to this EMA is consistent with Bitcoin's behavior in prior bull markets. - **Support Zone:** The 88K region coincides with a strong support level from prior consolidation, making it a logical area for a pullback. --- #### **5. Elliott Wave Analysis** - **Wave 4 Correction:** If we are in an Elliott Wave impulse structure, the current move to 98K could mark the end of Wave 3. A Wave 4 corrective phase to 88K is plausible before the continuation into Wave 5, targeting new highs above $100K. --- #### **6. Bearish Candlestick Patterns** - On shorter time frames (4-hour and daily), Bitcoin has formed a bearish divergence and a potential "shooting star" or "doji" near 98K , both indicative of a reversal. --- #### **Conclusion** A correction to 88K would provide a healthy reset for Bitcoin's bull run, allowing new buyers to enter and setting the stage for a sustainable breakout above $100K. Traders should monitor key levels and indicators like RSI, volume, and moving averages for confirmation of the correction. **Key Levels to Watch:** - Resistance: 98K , $100K - Support: 88K , $85K **Strategy:** Consider taking partial profits at current levels and re-entering near 88K with stop-losses placed slightly below $85K.
EIP-EverythingIsPlanned
Bitcoin BTCUSD will go up to reach this target

Bitcoin is on the verge of a remarkable surge, as my algorithm signals a bullish trend with a defined target. Based on advanced analytics and market patterns, the data suggests Bitcoin will rise to achieve new highs, fueled by a combination of technical and fundamental factors. Key indicators like moving averages and momentum oscillators align with a breakout scenario. My algorithm identifies increasing buying pressure, reduced selling volume, and significant support levels holding firm, all of which point toward upward movement. Moreover, the macroeconomic environment, with ongoing institutional interest and increasing adoption, adds further fuel to Bitcoin’s upward trajectory. Historically, Bitcoin has displayed a pattern of strong recoveries following consolidation phases, and the current market structure mirrors previous setups before significant rallies. Additionally, the psychological impact of breaking resistance zones often draws fresh inflows, amplifying the momentum. However, as with any market analysis, caution is essential. The crypto market is inherently volatile, and external factors like regulatory developments or global economic shifts can influence price movements. With my algorithm's insights and current trends, I project Bitcoin will achieve its target, offering an exciting opportunity for traders and investors alike. Stay vigilant, monitor key levels, and prepare to capitalize on this potential rally.
EIP-EverythingIsPlanned
Gold to 2107 XAUUSD

Technical analysis is a method used by traders and investors to evaluate securities and forecast future price movements based on historical price and volume data. However, it's essential to understand that technical analysis is just one approach among many, and no method can predict future prices with certainty. That said, if we were to perform a technical analysis of gold (XAU/USD) with an assumption that it could reach $2,100, here are some general steps and considerations we might take: Historical Price Data Analysis: Start by analyzing historical price charts of gold. Look for patterns, trends, and key levels where the price has historically found support or resistance. Trend Analysis: Determine the current trend of gold. Is it in an uptrend, downtrend, or ranging? The direction of the trend can provide insights into potential future price movements. Support and Resistance Levels: Identify significant support and resistance levels on the chart. These levels can act as barriers where the price may reverse or consolidate. If gold is moving towards $2,100, it would need to break through these levels convincingly. Technical Indicators: Use technical indicators such as Moving Averages (e.g., 50-day, 200-day), Relative Strength Index (RSI), Moving Average Convergence Divergence (MACD), etc., to gauge momentum, overbought/oversold conditions, and potential trend reversals. Volume Analysis: Analyze trading volumes alongside price movements. A significant increase in volume during a price move can confirm the strength of the trend. Chart Patterns: Look for chart patterns like triangles, flags, head and shoulders, etc. These patterns can offer clues about potential price targets. Fibonacci Retracement: Apply Fibonacci retracement levels to identify potential support and resistance levels based on historical price swings. External Factors: Consider external factors that can influence gold prices, such as geopolitical events, economic data, central bank policies, inflation expectations, and market sentiment. If, after conducting a thorough technical analysis, you believe that gold has the potential to reach $2,100 based on your findings, it's crucial to monitor the market closely and adjust your analysis as new data becomes available. Remember, while technical analysis can provide valuable insights and assist in making informed trading decisions, it's essential to use it in conjunction with other forms of analysis and risk management strategies. Trading and investing always involve risks, and it's crucial to only trade or invest money that you can afford to lose.
EIP-EverythingIsPlanned
SPY SPX NASDAQ S&P500 ES are not going to dump
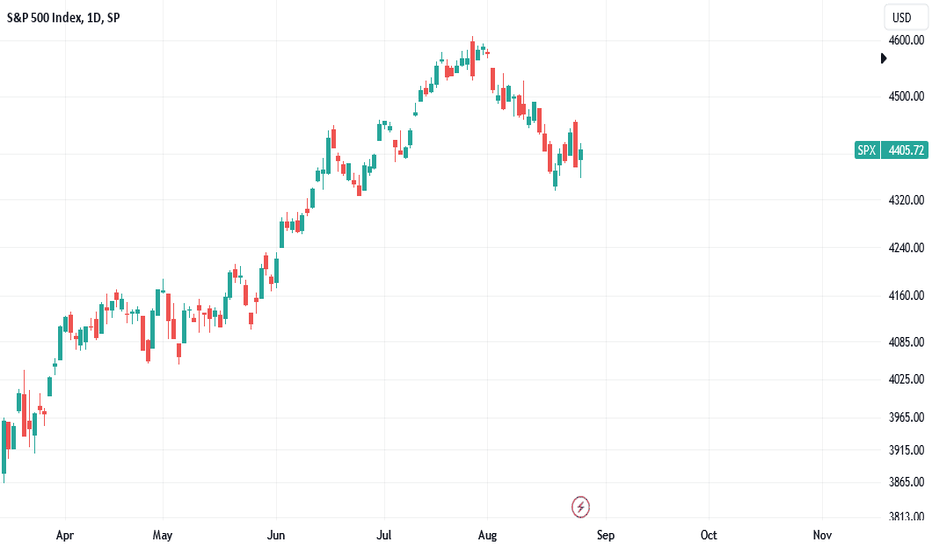
A "head and shoulders" pattern is a technical analysis chart pattern that can indicate a potential reversal in a stock's price trend. It consists of three peaks: a higher peak (the head) between two lower peaks (the shoulders). The pattern suggests a potential shift from an upward trend to a downward trend. However, the effectiveness of technical patterns like head and shoulders can vary, and they don't always accurately predict market movements. Market behavior is influenced by a multitude of factors including economic indicators, company performance, geopolitical events, investor sentiment, and more. "Complex correction" typically refers to a more intricate and prolonged market correction, which is a decline in stock prices from recent highs. Corrections are a natural part of market cycles and can be caused by various factors like overvaluation, economic downturns, or other negative events. It's important to note that making accurate predictions about market movements is extremely challenging, even for experts. If you're considering investing or making financial decisions, it's advisable to do thorough research, consider a diversified approach, and consult with financial professionals who can provide tailored advice based on your individual circumstances and risk tolerance.
EIP-EverythingIsPlanned
Gold XAUUSD big long setup

Gold has experienced a notable decline in recent times, prompting concerns that it may be oversold on both daily and weekly time frames. Oversold conditions suggest that an asset has experienced a significant downward movement and may be due for a rebound. In the case of gold, its price has been under pressure, leading many traders and investors to believe that a reversal may be on the horizon. Examining gold's performance on the daily time frame reveals a prolonged downward trend. The price has been consistently falling, with occasional brief recoveries. This extended decline has led technical indicators, such as the Relative Strength Index (RSI), to reach oversold levels. The RSI is a popular momentum oscillator that measures the speed and change of price movements. When it drops below a certain threshold, typically around 30, it suggests that an asset may be oversold and due for a potential upward correction. In the case of gold, the oversold RSI on the daily time frame indicates a possible reversal in the near future. Similarly, when looking at the weekly time frame, the oversold conditions become more apparent. Gold's decline over an extended period has led to an RSI reading that is significantly below the oversold threshold. This indicates that the downward pressure on gold's price has reached an extreme level on a longer-term basis. Such oversold conditions on the weekly time frame often precede a potential reversal and a subsequent upward movement. Considering these oversold signals on both daily and weekly time frames, many analysts and traders anticipate that gold will soon reach a target of $2,100 USD. This target represents a potential recovery from the current downward trend. However, it's important to note that financial markets are inherently unpredictable, and price movements can deviate from expectations. Therefore, caution should be exercised when making investment decisions based on short-term price predictions. In addition to the potential rebound in gold, market sentiment suggests that the U.S. Dollar Index (DXY) is expected to fall in the near future. The DXY is a measure of the value of the U.S. dollar relative to a basket of major currencies. A decline in the DXY indicates a weakening of the dollar compared to other currencies. Several factors contribute to the projected fall of the DXY. One key factor is the Federal Reserve's monetary policy stance. If the Fed adopts a dovish approach, meaning they prioritize supporting economic growth over tightening monetary policy, it can lead to a weaker dollar. Additionally, factors such as geopolitical tensions, global economic trends, and market sentiment can all influence the value of the U.S. dollar. However, it is important to acknowledge that currency markets are complex and subject to various influences. Predicting the future movements of currencies, including the DXY, is inherently uncertain. Therefore, while market expectations may indicate a potential decline in the DXY, it is essential to closely monitor economic developments and remain vigilant when making investment decisions. In conclusion, gold's oversold conditions on both daily and weekly time frames suggest a possible reversal in the near future, with a projected target of $2,100 USD. Similarly, market sentiment indicates a potential fall in the DXY. Nonetheless, it is crucial to exercise caution and recognize that financial markets can be unpredictable. Monitoring market developments and conducting thorough analysis are prudent approaches when making investment decisions.
EIP-EverythingIsPlanned
Gold is forming running flat for one more down

downside to continue Gold is forming running flat for one more down We should get atleast equal leg down
EIP-EverythingIsPlanned
Bitcoin about to fall to sub 13k

Everything is planned; bitcoin is about to make a big dump to sub 13k The stage is set This also means nasdaq and S&P500 are about to take a dump also
EIP-EverythingIsPlanned
Gold XAUUSD about to dump

something very bad is about to happen to gold I am witnessing a lot of confluence; there is hidden bearish divergence in gold on daily plus I think dxy is going to make one more up with EURUSD to one more downtrade is active
Disclaimer
Any content and materials included in Sahmeto's website and official communication channels are a compilation of personal opinions and analyses and are not binding. They do not constitute any recommendation for buying, selling, entering or exiting the stock market and cryptocurrency market. Also, all news and analyses included in the website and channels are merely republished information from official and unofficial domestic and foreign sources, and it is obvious that users of the said content are responsible for following up and ensuring the authenticity and accuracy of the materials. Therefore, while disclaiming responsibility, it is declared that the responsibility for any decision-making, action, and potential profit and loss in the capital market and cryptocurrency market lies with the trader.