Duyvinhtrader
@t_Duyvinhtrader
What symbols does the trader recommend buying?
Purchase History
پیام های تریدر
Filter
Signal Type
Duyvinhtrader
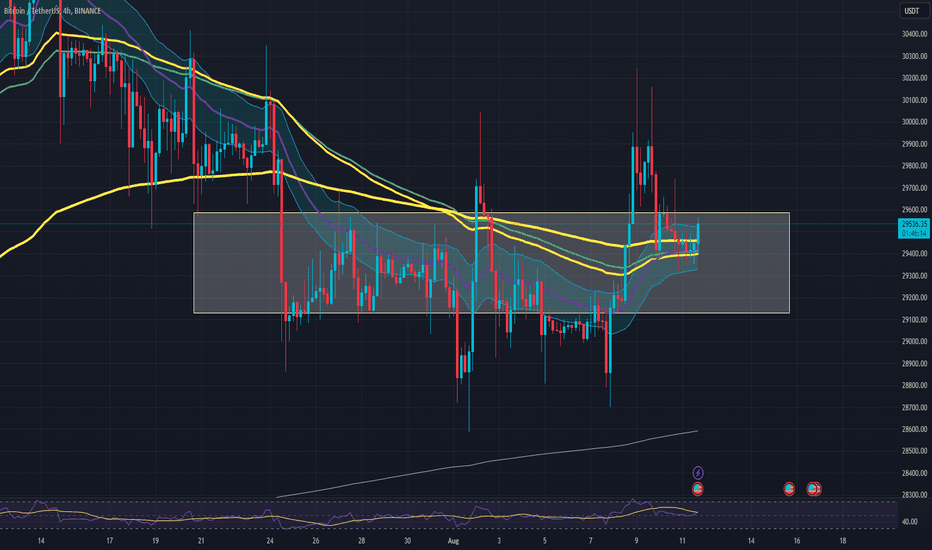
We continue to observe the developments of #Bitcoin #BTCUSDT at the key level of around 30,000, where it maintains its significant role in the market. Duyvinhtrader invites the Crypto Trader community to delve into a detailed analysis of Bitcoin for today, providing an in-depth view of the market situation.Results from Previous Trading Ideas:Based on real-time results, it is evident that the idea of waiting to buy during consolidation below 30,000 was unsuccessful due to the lack of consolidation at the current price level. The idea of waiting to buy if the price surpasses the 30,000 threshold also remains unactivated, as the price did not reach this zone.Bitcoin Analysis in D1 Timeframe:In the D1 timeframe for the #BTCUSDT pair, the chart indicates the appearance of a price action pattern known as a Bearish pinbar. This signifies a presence of selling pressure restraining price increase, thereby providing an advantage for the selling side as the price closes below half the range. The inside bar pattern on the D1 timeframe is related to the creation of price compression and accumulation.Recent price behavior at the 30,000 level highlights once again the robust resistance that this level offers. The fact that the price touched and then retraced with an upper wick on the D1 chart signifies that the 30,000 mark has prevented further price increases. This pattern echoes the D1 chart before, demonstrating the successive failures of attempts to surpass the 30,000 level.The price of #BTCUSDT on the D1 chart is currently maintaining a sideways consolidation range. A breakout from this range will set the stage for stronger price volatility in the future.Bitcoin Analysis in H4 Timeframe:In the H4 timeframe, there have been two instances where the price touched the 30,000 level and was swiftly pushed down. The presence of Bearish pinbars with extended upper wicks at the tops 1 and 3 signifies the robust resistance posed by the 30,000 level.The completion of the 1-2-3 pattern on the H4 #BTCUSDT chart provides a basis for a potential downward trend.The short-term trading strategy continues to revolve around the 30,000 level. Our primary focus remains on selling around this level. The consideration for buying should only arise if the price successfully breaches the 30,000 level and undergoes a subsequent weak retest.Overall Bitcoin Analysis Today:The bearish pinbar from D1 of yesterday continues to depict the 30,000 level as a robust barrier. The inside bar pattern signifies price compression.The potential for a downward trend in #BTCUSDT on the H4 timeframe is highlighted through the completion of the 1-2-3 pattern.
Duyvinhtrader
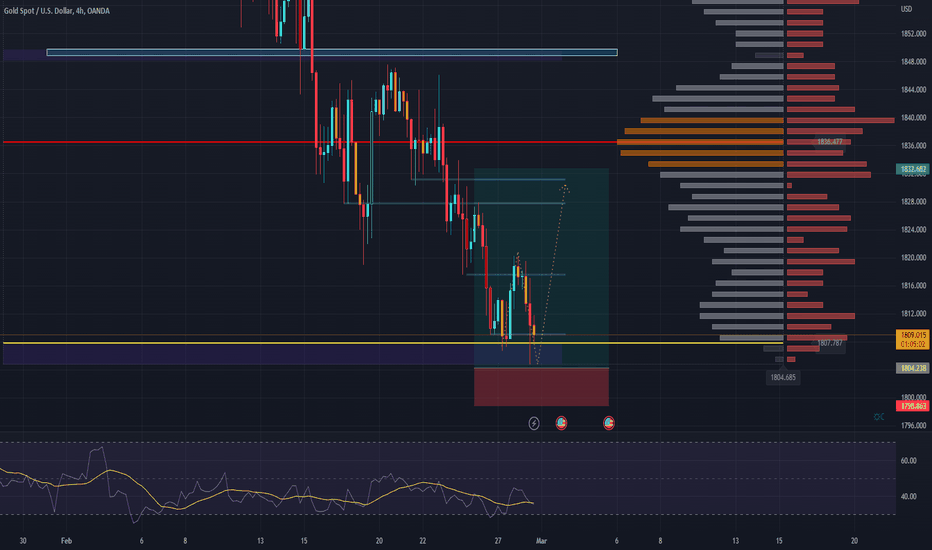
Gold price is having a difficult time building on Monday's modest recovery games. The benchmark 10-year US Treasury bond yield clings to small gaily gains above 3.9%, limiting XAU/USD's upside as focus shifts to US Consumer Confidence data.Financial markets have been a two-tale story for the early part of 2023, in which Gold price has reflected in its price action like no other asset. XAU/USD rode an uptrend during all of January with the market optimism about inflation slowing down and constant Federal Reserve dovish talk, only to see a drastic turnaround back to the old dynamics in February after a hot US Nonfarm Payrolls (NFP) report. The US economy adding more than 500K jobs in the month of January shifted the market expectations for the Fed easing its monetary policy, and the US Dollar has come back to the market King throne.Gold price opened the year at $1,823.76 and reached a year-to-date high of $1,960 on February 2, right in between the first Federal Reserve meeting of the year and the surprising release of the US jobs report for January. Since then, the ongoing downtrend has been relentless, reaching levels below the yearly open, around $1,800. Trading recommendation:Buy soup at the price range 1796 1797Stop Loss: 1794Take profit 1: 1806Take profit 2:1810Take profit 3: 1820Canh sell at the price range 1825 1824Stop loss 1827Take profit 1: 1810Take profit 2: 1807Take profit 3: 1800Note: Always set TP and SL in all trading casesIf you have any questions or support, please leave a comment
Duyvinhtrader
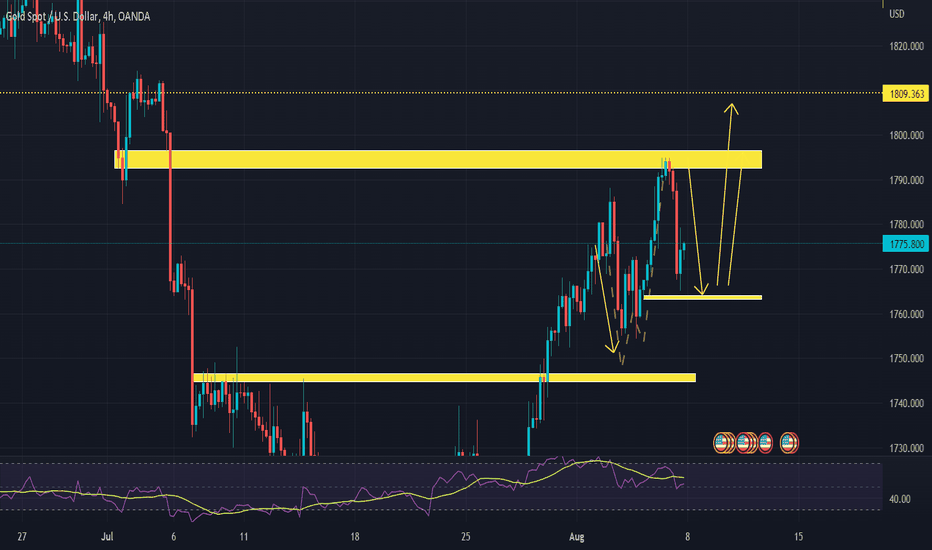
After a mild end to July, the US dollar, as measured by the index DXY, rallied in the first week of August, gaining about 0.7% to 106.55, with most of the gains coming Friday the day before the weekend after America. The working data surprised all sides of the activity, eliminating any hope of a Fed pivot later this year.Facing the foreground, US employers added 528,000 workers in July, more than double estimates and the fastest job growth rate since February, signaling that hiring remains strong and worries that the economic narrative might be overblown.With the labor market still blowing up all cylinders, no signs of layoffs on the surface, and wage pressures not fitting, the U.S. central bank is likely to stay on course, increasing spending. borrowing costs aggressively in the coming months to bring the temperature down. This status must be fixed to your left the US Treasuries as investors price in the path to more upside and higher interest rates for a longer time.Trading recommendation:BUY AUSTRALIA around the price range 1770 - 1766Stop Loss: 1755Take Profit 1: 1780Take Profit 2: 1785Take Profit 3: 1790SELL US Dollars around the price range 1793 - 1796Stop Loss: 1803Take Profit 1: 1780Take Profit 2: 1775Take Profit 3: 1765Note: Please fill in TP and SL specifically in the transaction, and it will make you safer
Duyvinhtrader
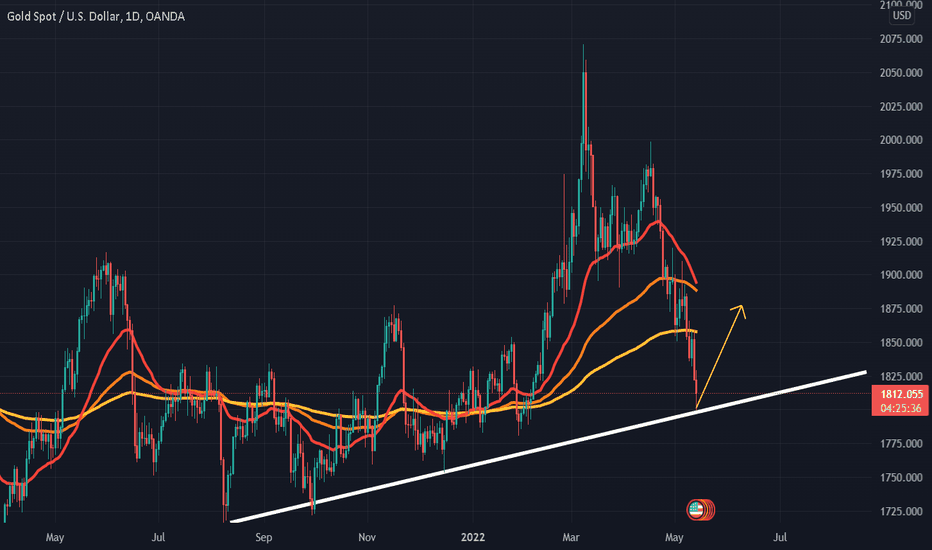
Gold fell to $1,800 for the first time in more than four months on Friday before starting to recover. Meanwhile, 10-year US Treasury yields remain positive above 2.9% after US data, limiting XAU/USD gains.Spot gold (XAU/USD) prices continued to trade with a negative bias on the last trading day of the week, having hit their lowest level in more than three months, just above $1810 earlier in the session.Basic overviewAt current levels in the upper $1,810/ounce, gold is trading around 0.2% lower and looks set for a weekly decline of around 3.5%, which would mark the fourth straight week of bad weather. worst of red and yellow since June. Year 2021.The main driver of gold's weakness this week has been the strength of the US dollar, with the Dollar Index (DXY) looking of course to end the week close to a multi-decade high at 104. .00 on. A stronger US dollar makes USD-denominated items like XAU/USD more expensive for international buyers.Friday's buck's resilience comes despite a rebound in risk appetite that has seen a rally in equities and cryptocurrencies, said to be fueling safe-haven appeal. of gold. Price movements in the US bond market also did not favor the precious metal this week. While nominal yields (albeit higher on Friday) look set to end the week significantly lower, real yields were little changed.That means lower inflation expectations (the 10-year breakeven points to be exact fell more than 20 bps this week to below 2.70%, the lowest since early March), implying demand reduced inflation protection. This hurts gold, as the asset is often seen as a hedge against inflation.Speech by Fed Chairman Jerome Powell on Thursday did not seem to have much effect. He reiterated that he sees a 50 bps rate hike at upcoming meetings as appropriate. Upcoming on Friday, gold traders will be watching for the release of the University of Michigan Consumer Sentiment survey in May at 1500BST for more on how US consumers are holding up against the odds. inflation is still sky high.Any new comments from Fed speakers that could move the needle regarding tightening expectations will also be worth noting. With XAU/USD breaking below the 200-Day Moving Average on Thursday, many technicians anticipate further declines towards yearly lows in the $1780 region.
Duyvinhtrader
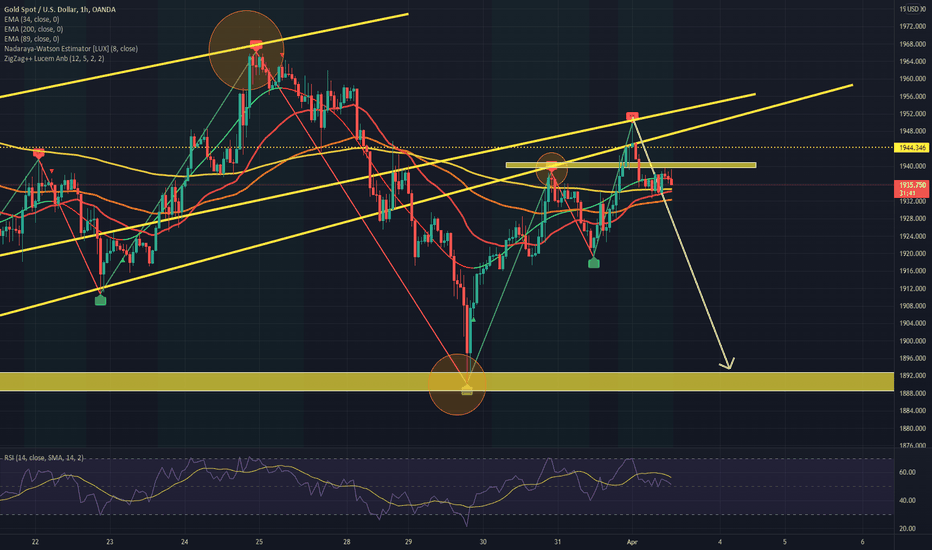
Yesterday we had a very accurate anonymous campaign and got 200 PIP total profit in 2 campaigns. Once again congratulations to all the investors who made a profit.Gold has gained impressive levels thanks to high safe-haven demand amid concerns related to the Russian-Ukrainian conflict. Safe political community with "hot" development has made investors pour into this precious metal market. Besides, signs of economic slowdown in the US when the yield curve inverted pushed investment into global assets.Ending talks about a ceasefire and de-escalation in the Russo-Ukrainian conflict have not yet come to fruition, the hidden currents will still be the factor that helps the resulting metal to yellow against the wind state of the country. The Department of Archives of the Lien Bang My Archives Project.Trading recommendation:SELL SELL US$ at the price range 1940-1945 (APPLY TO BOTH LONG TERM STRATEGY)Stop Loss: 1953Take Profit 1: 1930 (+ 100 PIP)Take Profit 2: 1925 (+ 150 PIP)Take Profit 3: 1910 (+290 PIP)Take Profit 4: 1900 (+ 300 PIP)Note: Please fill in TP and SL specifically in the transaction, and it will make you safer in conquering the financial fieldPs: News and trading strategies will be updated continuously and specifically in the group, so join the group to receive strategies and important documents that will help you increase your chances of winning in the market.Finally, wish you a productive day and success!
Duyvinhtrader
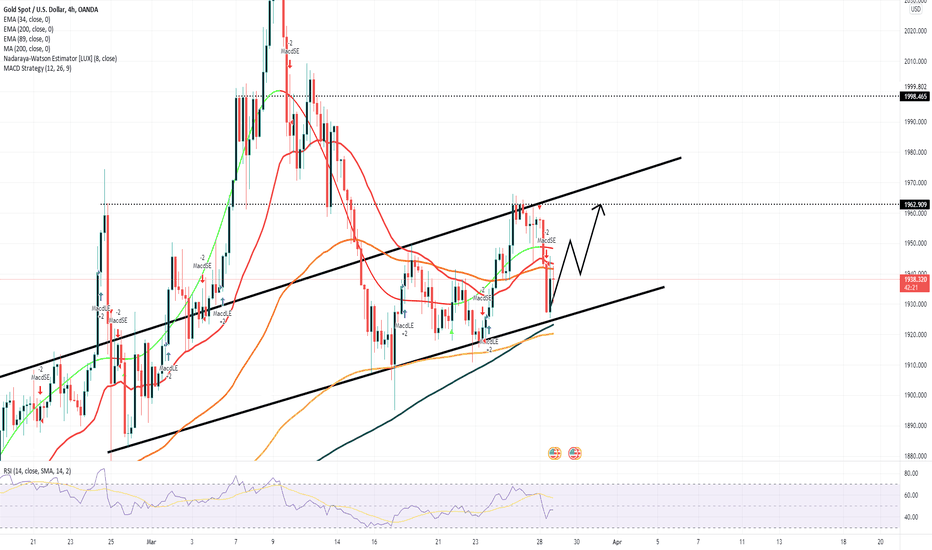
The greenback is gathering strength against its major rivals at the beginning of the week supported by rising US Treasury bond yields. The negative shift witnessed in risk sentiment is providing an additional boost to the dollar as well. February Trade Balance data and the Federal Reserve Bank of Dallas' Texas Manufacturing Survey will ve featured in the US economic docket on Monday. Bank of England Governor Andrew Bailey is scheduled to deliver a speech during the European Trading hours as well.On Sunday, China announced that a two-phase lockdown for Shanghai had been launched amid the rising number of coronavirus infections. Meanwhile, Ukrainian President Volodymyr Zelenskyy said that they will insist on sovereignty and territorial integrity in the next round of talks with Russia. US stock index futures are down between 0.4% and 0.5% early Monday, reflecting the souring market mood. Trading recommendation:BUY soup at the price range: 1930-1920Stop Loss : 1910Take Profit 1: 1945Take Profit 2: 1950Take Profit 3: 1960Good luck with your closing!
Disclaimer
Any content and materials included in Sahmeto's website and official communication channels are a compilation of personal opinions and analyses and are not binding. They do not constitute any recommendation for buying, selling, entering or exiting the stock market and cryptocurrency market. Also, all news and analyses included in the website and channels are merely republished information from official and unofficial domestic and foreign sources, and it is obvious that users of the said content are responsible for following up and ensuring the authenticity and accuracy of the materials. Therefore, while disclaiming responsibility, it is declared that the responsibility for any decision-making, action, and potential profit and loss in the capital market and cryptocurrency market lies with the trader.