
Dak_Trader
@t_Dak_Trader

What symbols does the trader recommend buying?
Purchase History
پیام های تریدر
Filter
Dak_Trader

BTCUSDT SHORT The D1 and H4 are bearish inspite of the W1 being bullish. We saw a double top at previous support turned resistance. I am expecting price to to continue heading lower to the $25,000 zone which is major support on the W1.
Dak_Trader

ETHUSDT, BULLISH OR BEARISH? ETHUSDT, BULLISH OR BEARISH? After making highs around the 2000USD region we began to observe what looks like a pullback. This pullback however can play out in two ways. ETHUSDT, BULLISH OR BEARISH? After making highs around the 2000USD region we began to observe what looks like a pullback. This pullback however can play out in two ways. ETHUSDT, BULLISH OR BEARISH? After making highs around the 2000USD region we began to observe what looks like a pullback. This pullback however can play out in two ways. First, price recently tested the 1800USD region of minor support. This can hold price and a rally to create higher highs can begin or it can rally to the major resistance at 1950USD and reject to the downside to form a head and shoulder. ETHUSDT, BULLISH OR BEARISH? After making highs around the 2000USD region we began to observe what looks like a pullback. This pullback however can play out in two ways. First, price recently tested the 1800USD region of minor support. This can hold price and a rally to create higher highs can begin or it can rally to the major resistance at 1950USD and reject to the downside to form a head and shoulder. ETHUSDT, BULLISH OR BEARISH? After making highs around the 2000USD region we began to observe what looks like a pullback. This pullback however can play out in two ways. First, price recently tested the 1800USD region of minor support. This can hold price and a rally to create higher highs can begin or it can rally to the major resistance at 1950USD and reject to the downside to form a head and shoulder. Second, following the head and shoulder setup, we can see a move lower toward the $1700 major support before we bounce higher. ETHUSDT, BULLISH OR BEARISH? After making highs around the 2000USD region we began to observe what looks like a pullback. This pullback however can play out in two ways. First, price recently tested the 1800USD region of minor support. This can hold price and a rally to create higher highs can begin or it can rally to the major resistance at 1950USD and reject to the downside to form a head and shoulder. Second, following the head and shoulder setup, we can see a move lower toward the $1700 major support before we bounce higher. ETHUSDT, BULLISH OR BEARISH? After making highs around the 2000USD region we began to observe what looks like a pullback. This pullback however can play out in two ways. First, price recently tested the 1800USD region of minor support. This can hold price and a rally to create higher highs can begin or it can rally to the major resistance at 1950USD and reject to the downside to form a head and shoulder. Second, following the head and shoulder setup, we can see a move lower toward the $1700 major support before we bounce higher. Overall, so long as the $1700 level is not broken, it will be wise to focus on long trades as it offers the best RRR from a swing trading prespective. ETHUSDT, BULLISH OR BEARISH? After making highs around the 2000USD region we began to observe what looks like a pullback. This pullback however can play out in two ways. First, price recently tested the 1800USD region of minor support. This can hold price and a rally to create higher highs can begin or it can rally to the major resistance at 1950USD and reject to the downside to form a head and shoulder. Second, following the head and shoulder setup, we can see a move lower toward the $1700 major support before we bounce higher. Overall, so long as the $1700 level is not broken, it will be wise to focus on long trades as it offers the best RRR from a swing trading prespective. ETHUSDT, BULLISH OR BEARISH? After making highs around the 2000USD region we began to observe what looks like a pullback. This pullback however can play out in two ways. First, price recently tested the 1800USD region of minor support. This can hold price and a rally to create higher highs can begin or it can rally to the major resistance at 1950USD and reject to the downside to form a head and shoulder. Second, following the head and shoulder setup, we can see a move lower toward the $1700 major support before we bounce higher. Overall, so long as the $1700 level is not broken, it will be wise to focus on long trades as it offers the best RRR from a swing trading prespective. NOTE: NOT FINANCIAL ADVICE.
Dak_Trader
Possible move to the up side for BTCUSDT as price hits minor support. This support also aligns with the 0.382 fib level.However, if price breaks that level, we can see a move down to 25k region which is the neckline for the head and shoulders pattern. Note: NOT FINANCIAL ADVICE.
Dak_Trader

So following the a strong job market and above expected inflation, the prospect of higher interest becomes increasingly closer to reality. This however is very bearish for gold as investors will prefer to hold USD instead of gold because of interest payment.From the charts, we see that the brief rally on gold bounced of our major trendline resistance structure and has continued as expected to the downside as bears have clearly taken control. So going into next week, I will be looking to short gold either at the break of the counter trendline or at the retest of previous support now resistance.N/B: NOT FINANCIAL ADVICE
Dak_Trader

The weekly candle closed bearish, this comes after an extensive rally that came of the back of a weak dollar. This weakness can be linked to profit taking and uncertainties due to hurricane Ian that hit Florida and other parts of the US gruesomely. This however did not last as the macro economic environment remains bearish for gold. However, I won't be quick to sell as price haven't broken back below lower and higher timeframe support. For this, I will advice caution till price have cleared this key levels and confirmed our sell bias before taking any trades.
Dak_Trader

So XAUUDS from our overview (M1 & W1) we created a double top and have broken the neckline. We know also from our overview we are going lower.On the D1, we see a rally that came off a weakness in the DXY but the trend is still bearish. We also know that Gold moves in zones, with this we are expecting price to come back to a key zone before heading back lower.Next week, we are going to be looking for sell on Gold.
Dak_Trader

Price just broke a major support level . I am expecting price to continue to the downside and will take my entries at a retracement on the H4.
Dak_Trader

Expecting BTC to break the neckline of the Double top for a continuation to the downside.
Dak_Trader

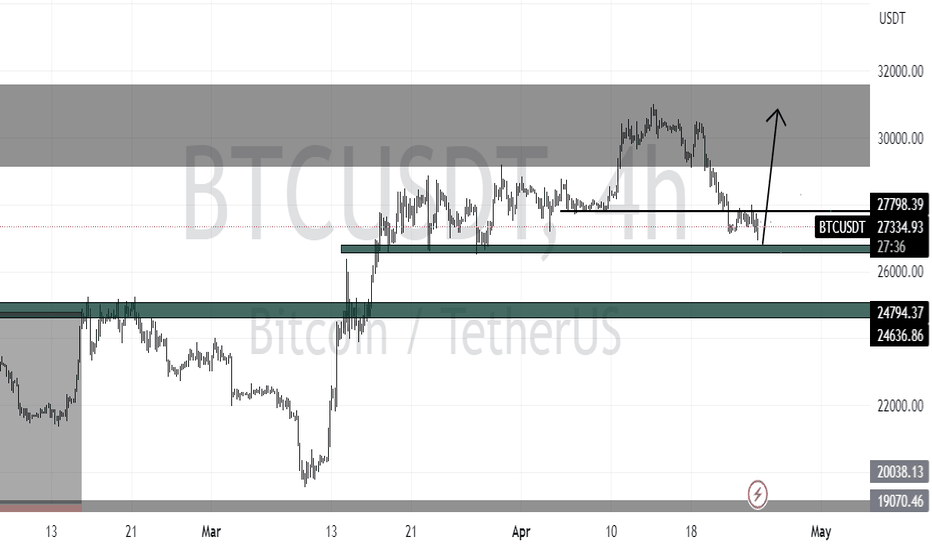
Based on the pattern on the chart, I believe a long is to be expected for BTC.
Disclaimer
Any content and materials included in Sahmeto's website and official communication channels are a compilation of personal opinions and analyses and are not binding. They do not constitute any recommendation for buying, selling, entering or exiting the stock market and cryptocurrency market. Also, all news and analyses included in the website and channels are merely republished information from official and unofficial domestic and foreign sources, and it is obvious that users of the said content are responsible for following up and ensuring the authenticity and accuracy of the materials. Therefore, while disclaiming responsibility, it is declared that the responsibility for any decision-making, action, and potential profit and loss in the capital market and cryptocurrency market lies with the trader.