DailyMarketMovements
@t_DailyMarketMovements
What symbols does the trader recommend buying?
Purchase History
پیام های تریدر
Filter
Signal Type

DailyMarketMovements
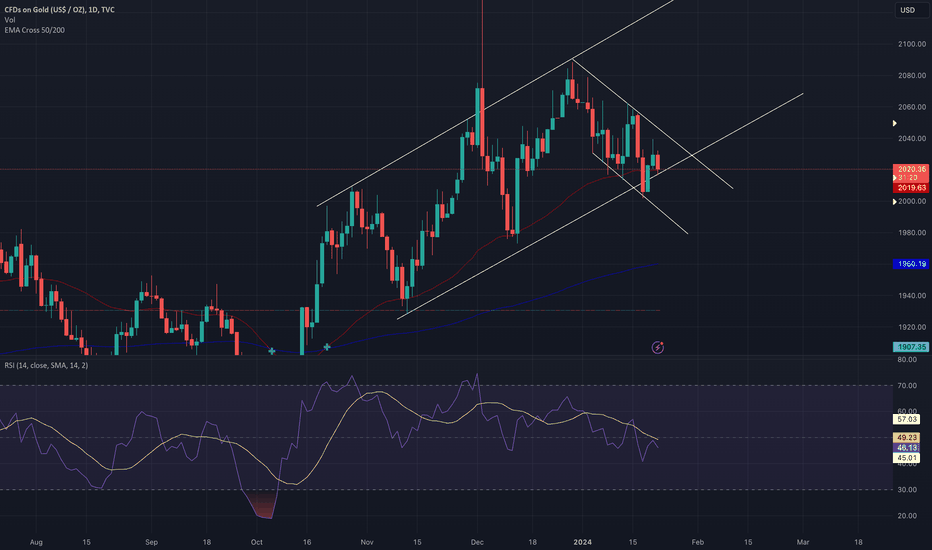
A move to 2040 is in the cards as we move into Tuesdays session. The 20day EMA sits at 2040 and with the support of not just the trend, but the EMA line as well, I believe that the current price of 2020 area offers a great buying opportunity. Entry 2020 SL 2014 TP 2040

DailyMarketMovements
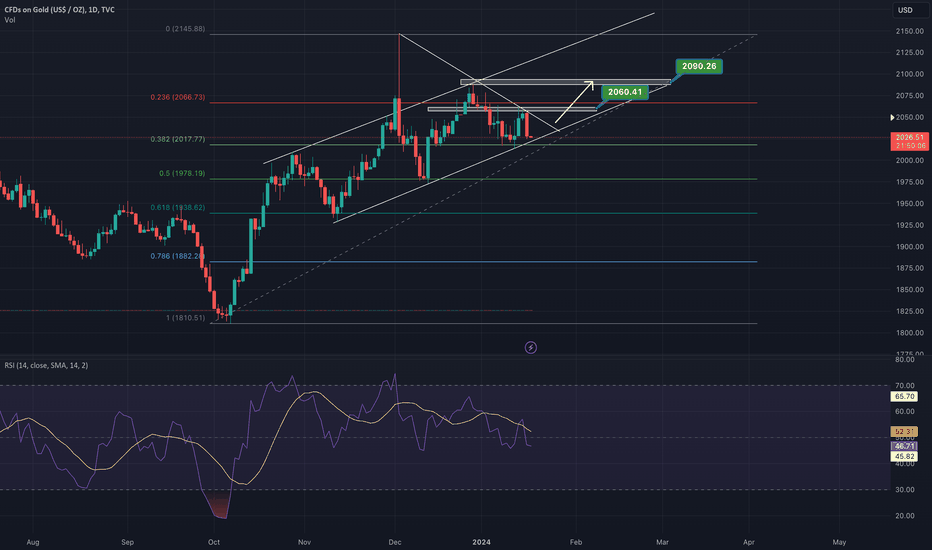
The past 48 hours we have seen 2 missiles hit US & Maltese ships crossing south of Yemen. The US & UK stated " Britain could strike Houthi targets in Yemen again if the rebel group continues to attack ships in the Red Sea" This is a quote from the UK foreign secretary. When the west carry out their attacks wether they be from drones or battle ships, it is typically at night around 3-5am UK time for an attack in Yemen. This makes it easier to carry out as well as not having innocent citizens roaming around a potential target. Tonight I think there is a 80% chance the US & UK will act in retaliation of the past 2 attacks in the last 48 hours. This attack likely further increases risk in the middle east region and I see a path for GOLD to travel up to $2090 in the coming days/weeks. This week I would target $2,060 if you agree with my fundamental catalyst of a western attack on Yemen.

DailyMarketMovements
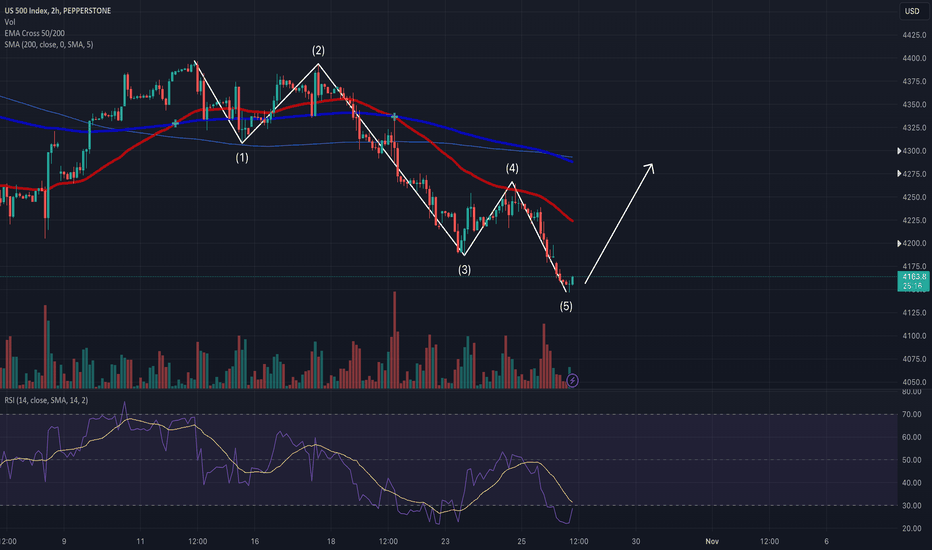
S&P500 has completed its 5 wave move lower, this offers the best opportunity to buy stocks here ahead of a Q4 rally.

DailyMarketMovements
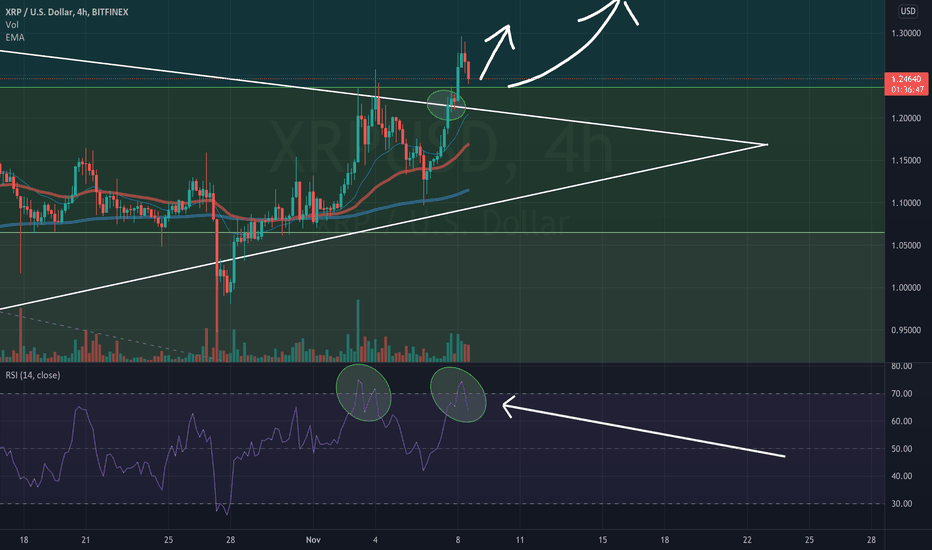
Perfectly normal price movement seen here in XRP.its simply back testing the 0.50% FIB retracement which is a very bullish signal. we could go to 1.23 then see a big bounce and a move to 1.40.

DailyMarketMovements

DailyMarketMovements
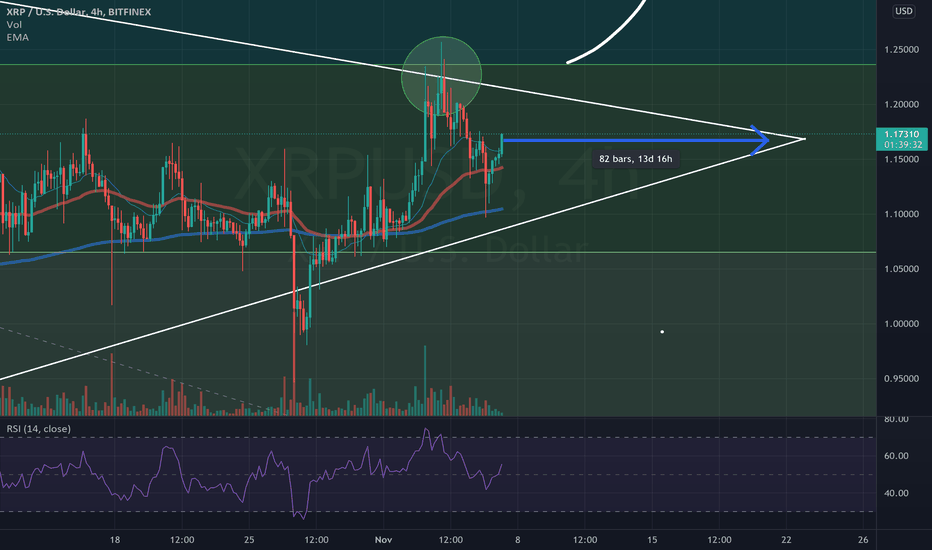
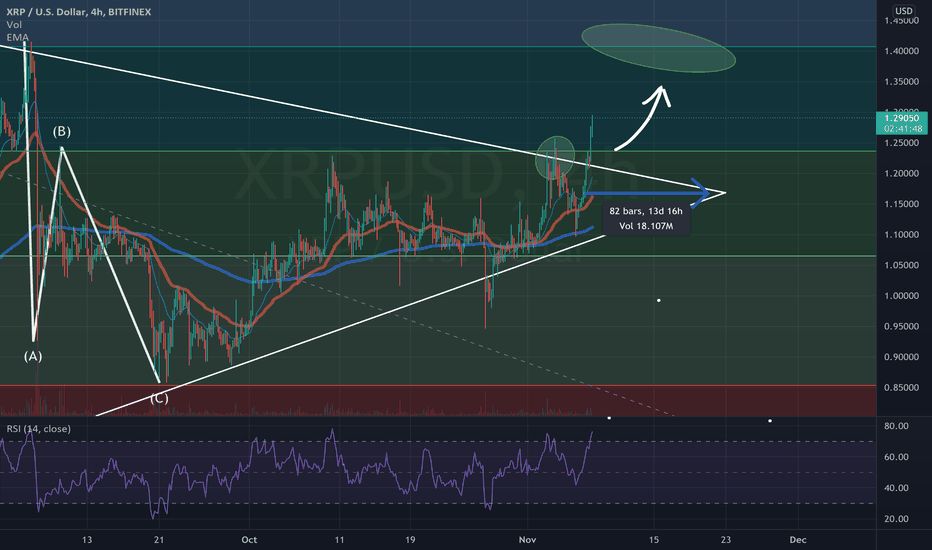
XRP must break out within 13 days!!! as you can see from our chart, XRP has been trading within this wedge since January 2021 and in 13 days time it expires...... we favour a break out towards the top side to 1.40.

DailyMarketMovements

DailyMarketMovements
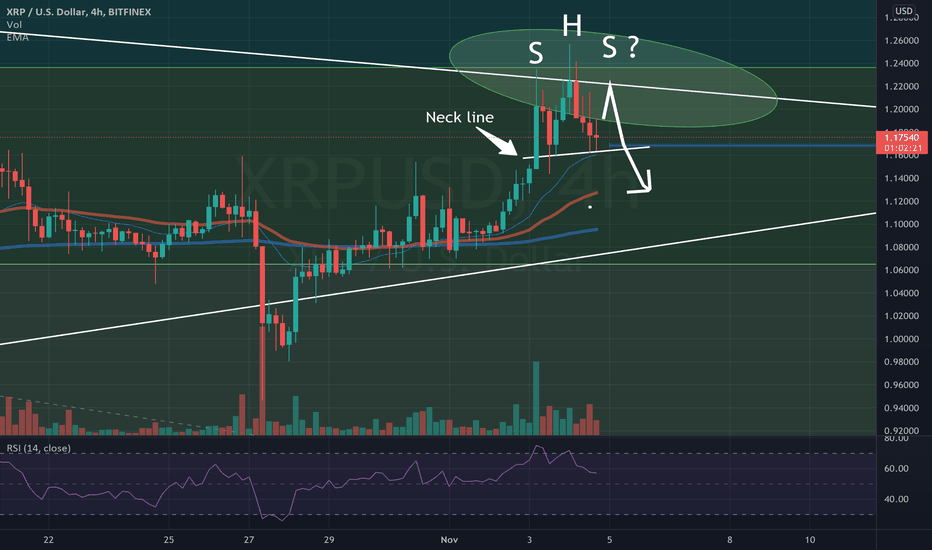
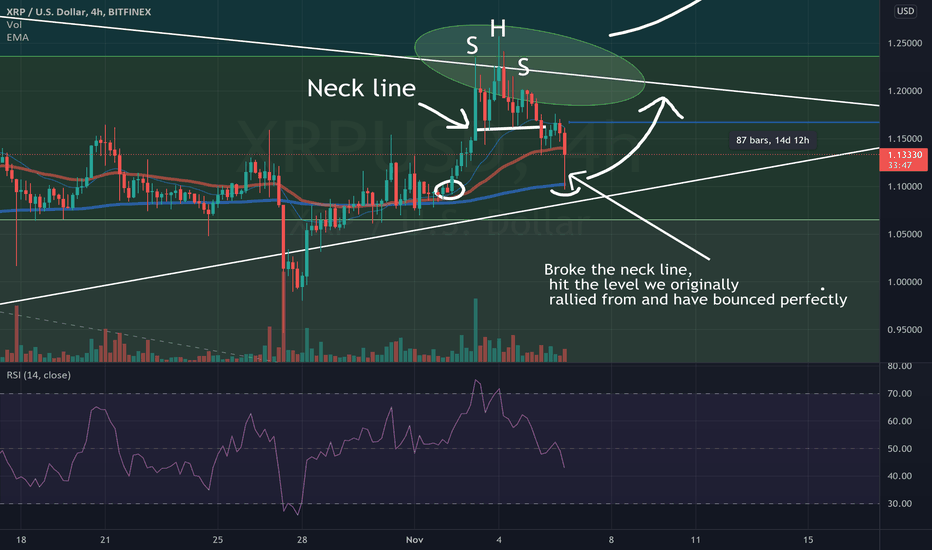
It seems as if we have a head and shoulders pattern forming on the XRP 1H & 4H chart. if we break the neckline @1.16 then we could see a further move lower to 1.08.

DailyMarketMovements
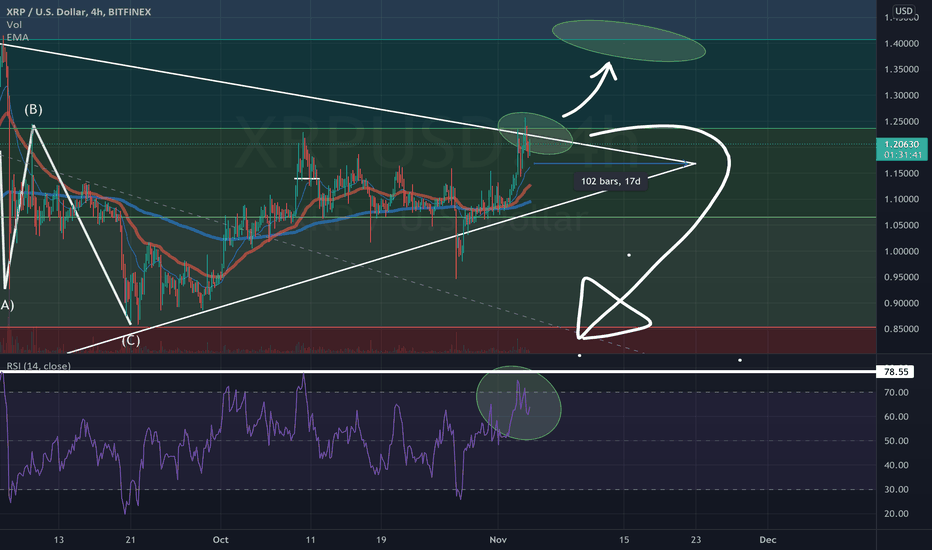
The RSI on the 1H & 4H time frame was overbought this morning trading at levels between 75/80. today we have seen a strong consolidation of XRP , it has held the 1.20 level and whilst we consolidate the RSI is slowly recovering and is now at 60/50 level. it looks very likley that we will see a break out above 1.25 in the shorterm which will lead to a move to 1.40

DailyMarketMovements
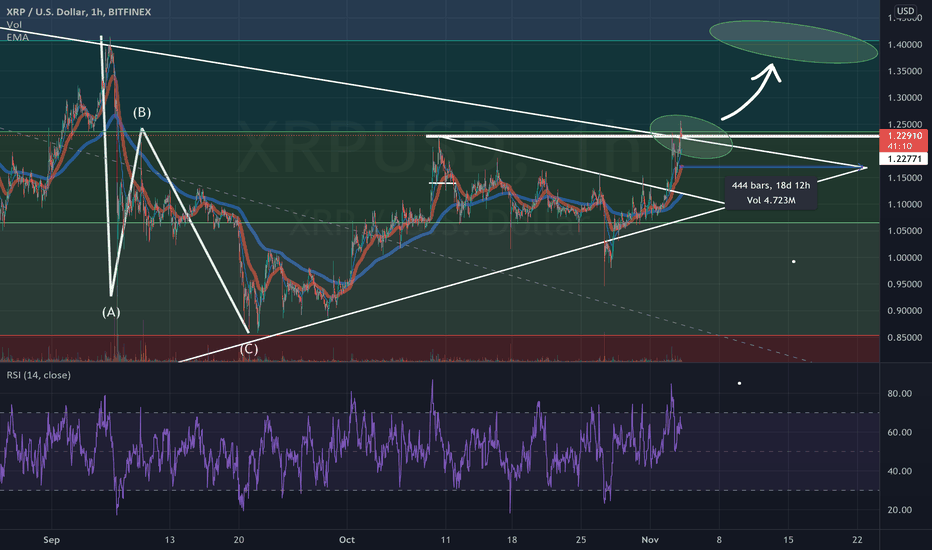
XRP TO 1.40 any day now, its pressing the upside of the wedge and if we trade above 1.25 we could go to 1.40 very quickly. a rejection here could see a move back to 1.13. nevertheless we are looking very bullish here
Disclaimer
Any content and materials included in Sahmeto's website and official communication channels are a compilation of personal opinions and analyses and are not binding. They do not constitute any recommendation for buying, selling, entering or exiting the stock market and cryptocurrency market. Also, all news and analyses included in the website and channels are merely republished information from official and unofficial domestic and foreign sources, and it is obvious that users of the said content are responsible for following up and ensuring the authenticity and accuracy of the materials. Therefore, while disclaiming responsibility, it is declared that the responsibility for any decision-making, action, and potential profit and loss in the capital market and cryptocurrency market lies with the trader.
