
Daffapouuse
@t_Daffapouuse

What symbols does the trader recommend buying?
Purchase History
پیام های تریدر
Filter
Daffapouuse
تحلیل طلا (XAUUSD): فرصت خرید در کجاست؟ احتمال برگشت قیمت به بالای 4233
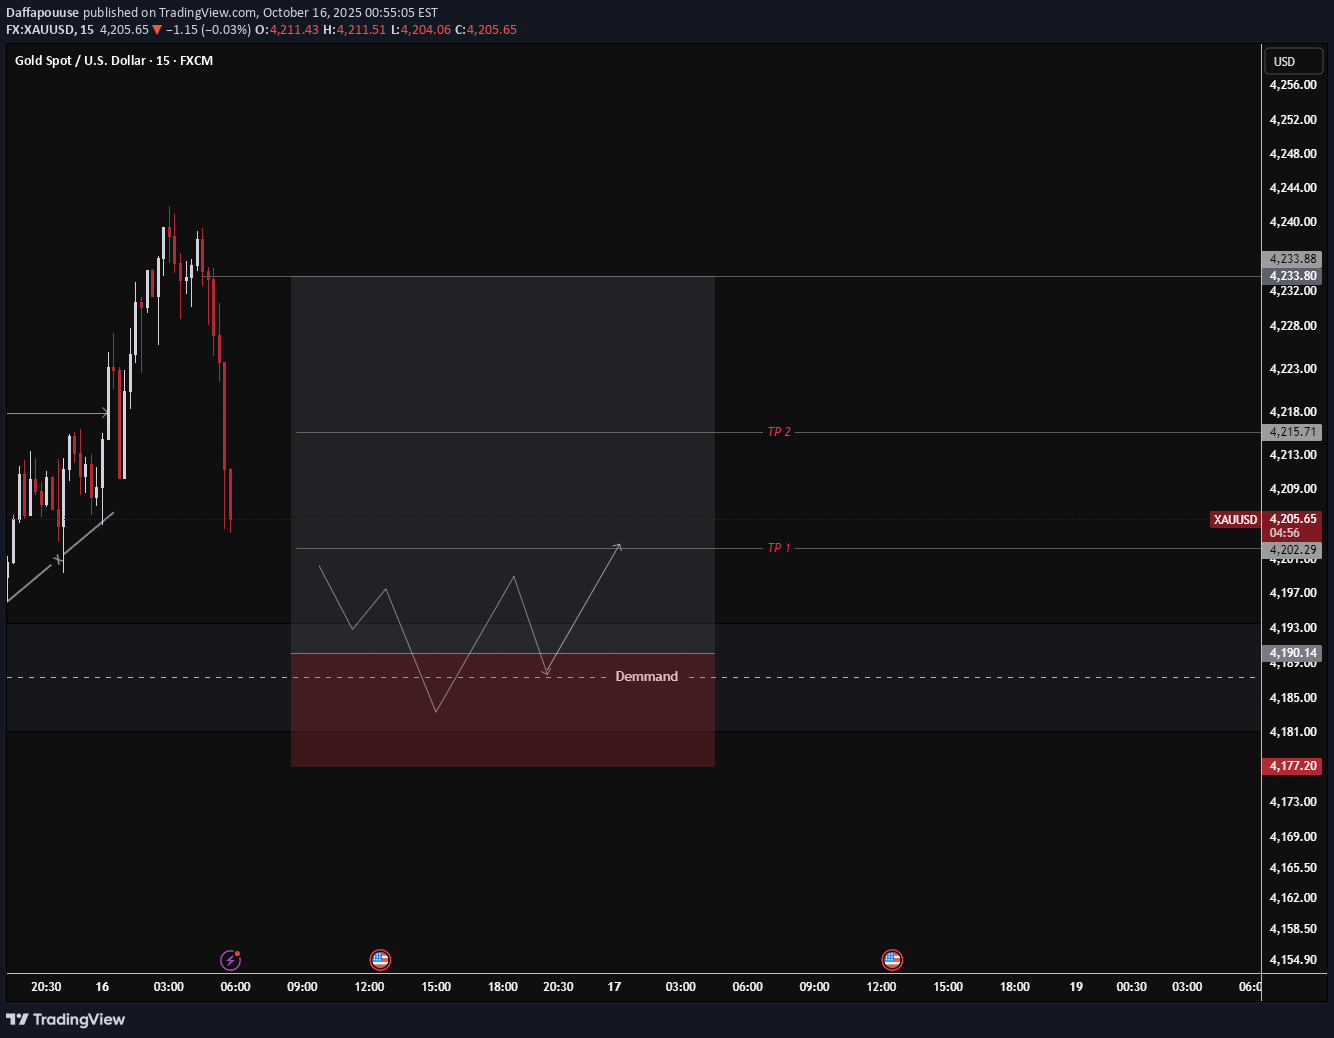
📌 Brief Analysis: Gold is currently experiencing a retracement after its previous sharp rise. The price is starting to approach the strong demand area at 4,185 – 4,190, which previously served as the base of the last bullish impulse. As long as this zone remains intact, the opportunity for a rebound towards 4,215 – 4,233 remains open. The ideal scenario is a retest of the demand area → consolidation → bullish continuation. However, if the price breaks below 4,177, the rebound opportunity will weaken and the potential for a deeper correction could open.
Daffapouuse
اتریوم در آستانه ریزش؟ سطوح کلیدی حمایت و مقاومت برای ETH

Ethereum is currently in a corrective phase after failing to hold above the 4,480 USDT resistance zone. Market structure has shifted from bullish momentum to short-term distribution, indicating that sellers are gaining control. The supply area between 4,450–4,500 remains the key resistance that must be reclaimed to restore a bullish bias. As long as the price trades below this zone, the downside potential toward the 4,170–4,100 demand area remains likely. This level is expected to attract buyers for a possible short-term rebound before a new trend develops.
Daffapouuse
ریزش اتریوم در راه است؟ پیشبینی قیمت ETH با توجه به منطقه عرضه 4620 دلاری

Technical Structure and Market Context ETH is reacting within the 4 580 – 4 620 USDT supply zone, acting as a minor distribution area. The strong upward move lost momentum as the price faced rejection with long wicks around this region — a sign of profit-taking from short-term buyers and potential entry from sellers waiting for confirmation of a pullback. If ETH fails to close decisively above 4 620, a short-term retracement toward the 4 550 validation level is likely. Failure to hold this level could trigger a deeper correction toward the 4 470 – 4 480 demand zone before finding new liquidity. Momentum and Volume Insights The previous rally was driven by a strong impulse volume, but recent candles show declining buying activity and growing selling pressure, signaling a shift in market control from bulls to short-term distributors. This typically occurs as institutional players execute liquidity grabs at premium zones. Sustained selling volume could push the price to test 4 470 as the next major support level. Institutional Outlook From an institutional view, this region serves more as a liquidity distribution zone than an accumulation area. Funds are likely waiting for clear reaction signals around 4 550 – 4 470 before re-entering positions. As long as price remains below 4 620, the short-term bias leans toward a correction. A confirmed break above this threshold, however, could extend the bullish run toward 4 680 – 4 700 USDT.
Daffapouuse
تحلیل بیت کوین (BTC): آیا کف دوقلو در 110,000 دلار، بیت کوین را به 130,000 دلار میرساند؟

BTC/USDT Analysis (Daily Timeframe) Chart Pattern A double bottom pattern has formed around 109,000 – 110,000, which often signals a strong bullish reversal as buyers defend the same support level twice. Key Levels Main Support: 109,000 – 110,000 (double bottom area). Immediate Resistance: 118,000 – 120,000 (currently being tested). A breakout above this level will confirm the double bottom reversal. Upside Target (TP): Supply zone around 127,000 – 130,000. Bullish Scenario If price holds above 114,700 – 115,000 (minor support after breakout), BTC has the potential to continue toward 118,000. A confirmed breakout above 118,000 – 120,000 will open the path toward 127,000 – 130,000. Bearish Scenario (Alternative) Failure to break 118,000 – 120,000 and a drop back below 114,700 may lead BTC to retest 110,000 support. A breakdown below 110,000 will invalidate the double bottom and expose BTC to further downside below 105,000. Conclusion The structure currently favors the bulls with the double bottom pattern in play. As long as 110,000 holds, the medium-term outlook remains positive. A breakout above 118,000 – 120,000 would confirm the bullish bias and set the stage for a move toward 127,000 – 130,000.
Daffapouuse
LINK

📊 **Setup LINK/USDT (15m)** 🟢 **Entry Zone (Demand QML):** ≈ 21.043 – 21.048 🔻 **Stop Loss (SL):** 20.777 🎯 **Take Profit (TP):** * TP1 👉 21.263 * TP2 👉 21.545 * TP Max 🚀👉 21.879
Daffapouuse
BNB

📊 **Setup BNB/USDT (15m)** 🟢 **Entry Zone (Demand):** ≈ 1,009 – 1,011 🔻 **Stop Loss (SL):** 1,000 🎯 **Take Profit (TP):** * TP1 👉 1,016 * TP2 👉 1,026 * TP Max 🚀👉 1,036 📌 **Analisa Singkat:** BNB rebounded from demand in the 1,009-1,011 area. As long as this demand persists, the potential for an increase to TP1 and TP Max is quite strong. If demand breaks through, be careful, as it could fall further below 1,000.
Daffapouuse
$HYPE

The HYPE/USDT pair is still moving within a medium-term uptrend, supported by a sustained trendline since May. Currently, the price is holding above the 44 support zone, which acts as a key level for buyers. If this support holds, there is potential for the price to continue rising, with the first target around 51 (TP1) and an extended target toward 60 as the main TP. This scenario remains valid as long as the price does not break below 44. If support fails, the risk of a deeper correction toward the 38 level will open up.
Daffapouuse
$BNB

The BNB/USDT pair is currently undergoing a retracement after failing to break through the supply zone around 1050–1060. Price structure indicates a possible pullback toward the demand area near 1000–1005, which serves as a key support level and a buyer accumulation zone. As long as this demand zone holds, there is a strong chance of a rebound with the next target around 1050. However, if the demand is broken, the short-term bullish structure will weaken, opening room for a deeper correction. In conclusion, the primary scenario still favors a bullish continuation as long as price holds above 1000. The demand zone is the key validation area before the market can resume its path toward supply.
Daffapouuse
BTC

Bitcoin remains under pressure after a sharp drop from the 114,000 – 115,500 supply zone. On the 1H timeframe, sellers are still in control, highlighted by the failure to hold above 113,200 (BoS level). The price is now testing the 110,800 – 111,200 demand zone, which serves as a short-term accumulation area. Possible Scenarios Bullish: If the 110,800 – 111,200 demand holds, BTC could rebound toward 113,200, with further upside potential to retest supply at 114,000 – 114,200. Bearish: A breakdown below demand would confirm stronger bearish momentum, opening room for a decline toward 109,500 – 109,100. Conclusion The 110,800 – 111,200 zone is decisive. Holding this level keeps the chance of a short-term rebound, while a breakdown would likely extend the bearish trend to lower supports.
Daffapouuse
UNI/USDT – Daily Outlook

UNI is approaching the 7.7 – 7.8 demand zone after significant bearish pressure. This zone will act as a crucial decision point. If demand holds, UNI may rebound and retest the 10.3 resistance, which also serves as the validation level for the Head and Shoulders pattern. A breakout above this level would invalidate the HnS scenario and open the door for further bullish continuation. If demand breaks, the bearish structure could extend lower, potentially targeting the 6.5 – 6.7 region. At this stage, the demand zone will be the key level to watch, as it will decide whether UNI maintains its medium-term bullish outlook or shifts into a deeper bearish trend.
Disclaimer
Any content and materials included in Sahmeto's website and official communication channels are a compilation of personal opinions and analyses and are not binding. They do not constitute any recommendation for buying, selling, entering or exiting the stock market and cryptocurrency market. Also, all news and analyses included in the website and channels are merely republished information from official and unofficial domestic and foreign sources, and it is obvious that users of the said content are responsible for following up and ensuring the authenticity and accuracy of the materials. Therefore, while disclaiming responsibility, it is declared that the responsibility for any decision-making, action, and potential profit and loss in the capital market and cryptocurrency market lies with the trader.