
DL_INVEST
@t_DL_INVEST

What symbols does the trader recommend buying?
Purchase History
پیام های تریدر
Filter
DL_INVEST
Alphabet Inc (Google) Class A
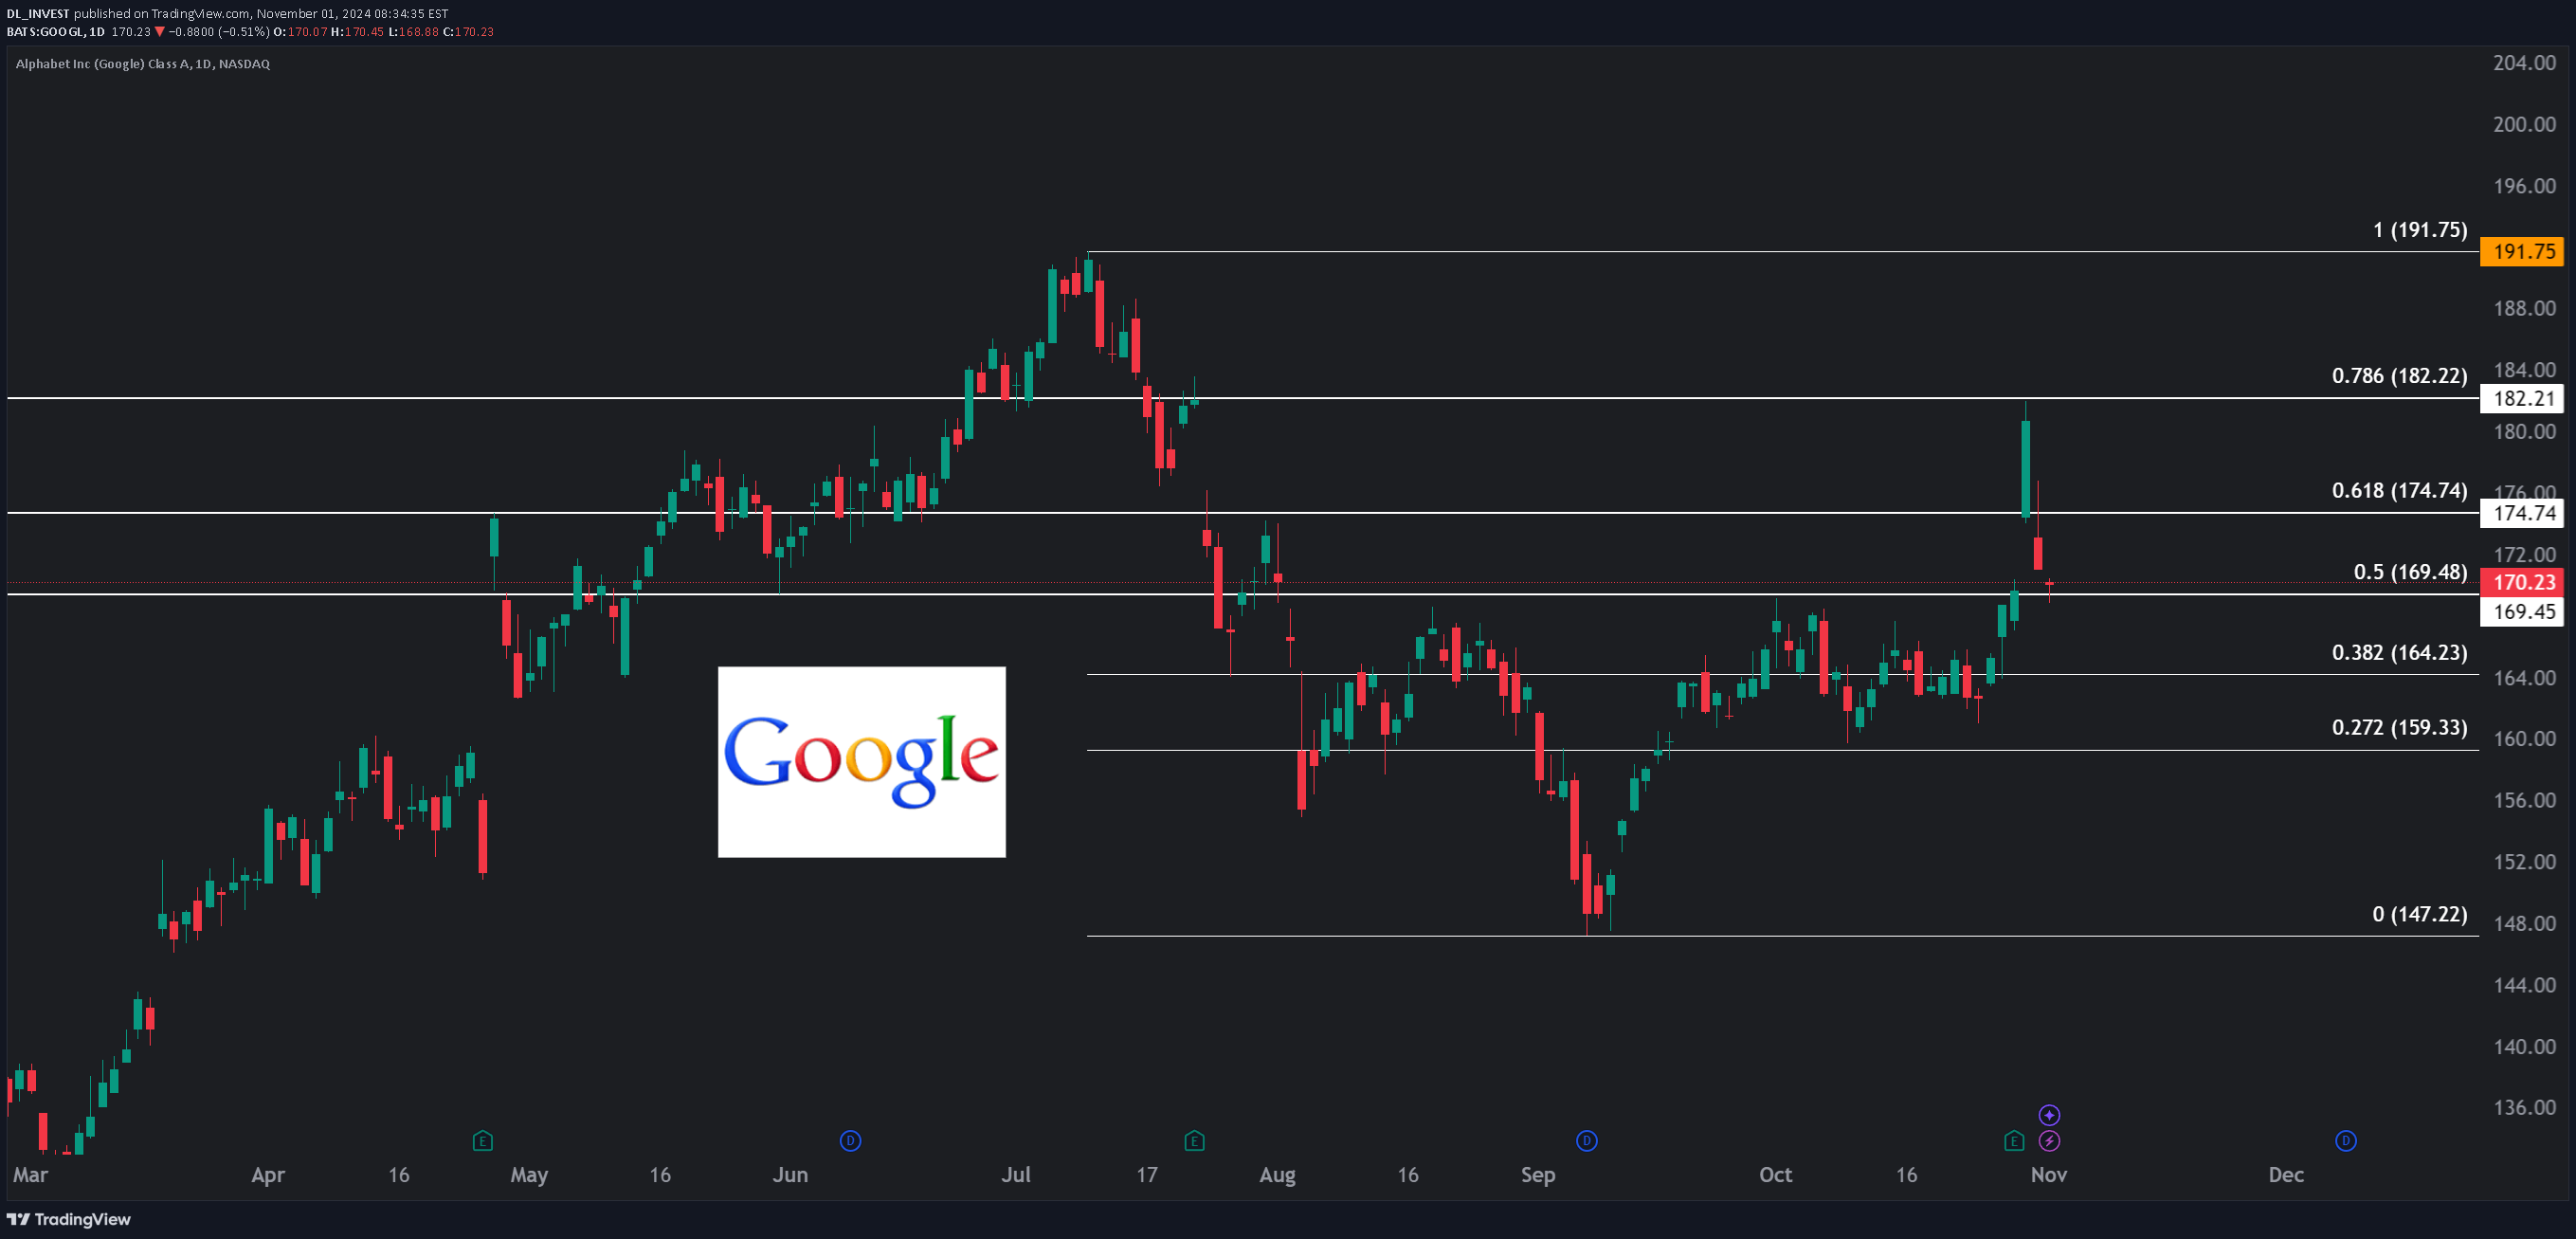
Hello community, Daily chart. I plotted the Fibonaccie retracements. We can clearly see that the levels are respected. Make your own opinion, before placing an order. ► Thank you for boosting, commenting, subscribing!
DL_INVEST
Meta Platforms
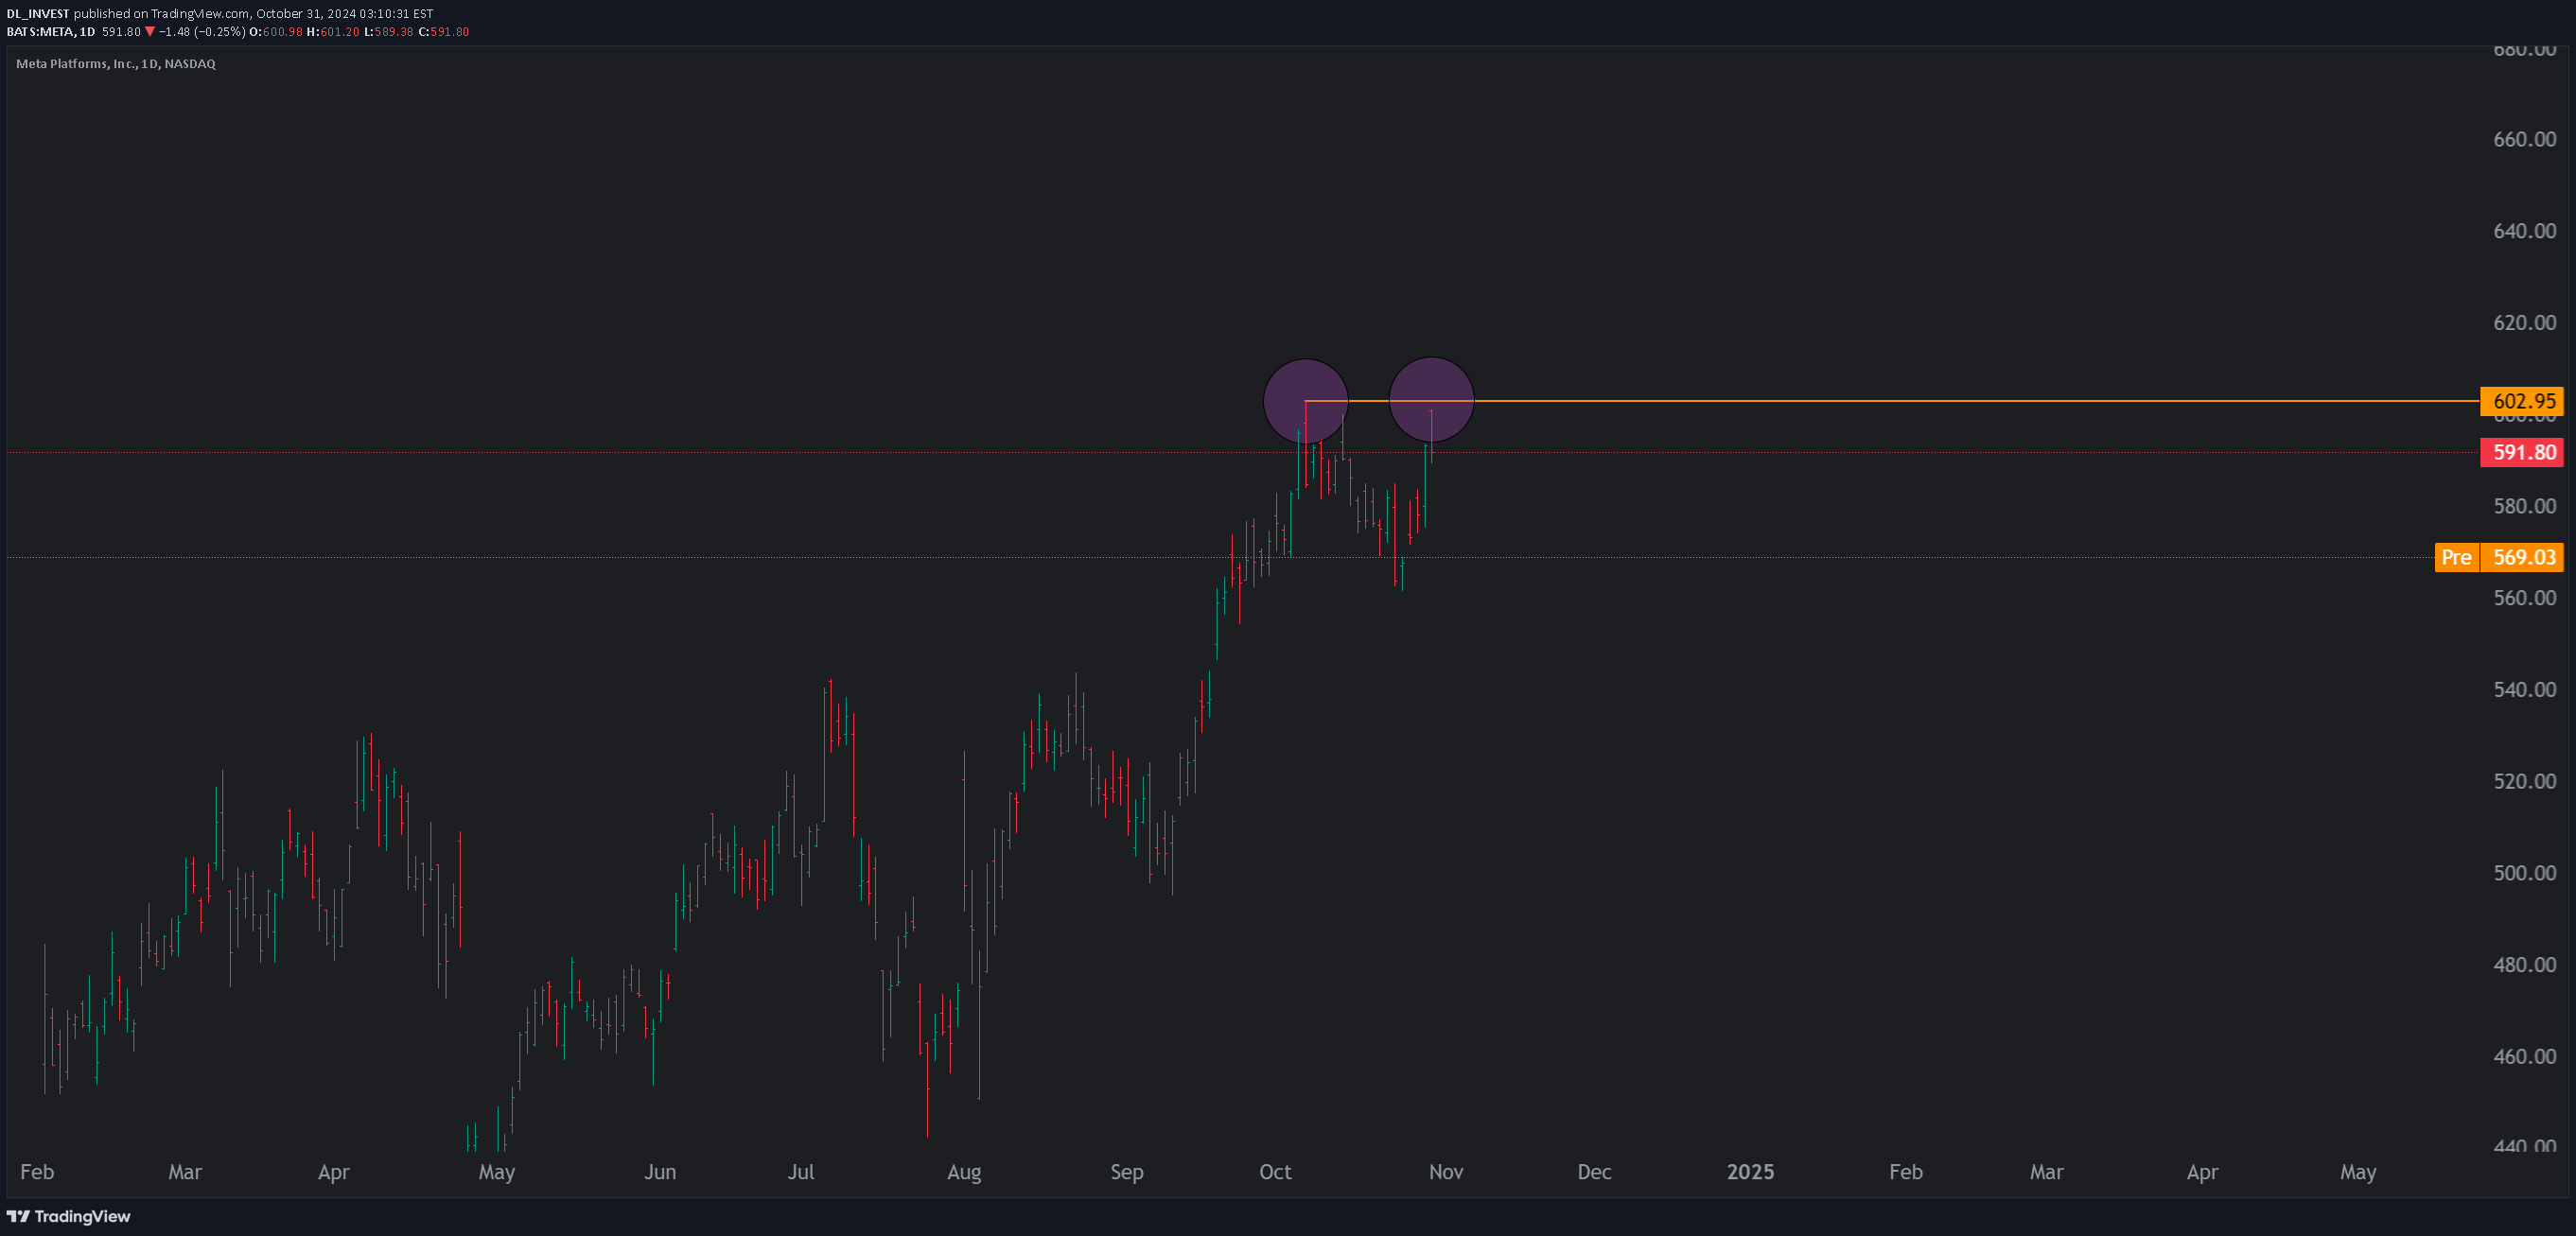
Hello community, Update on the META action in daily. Nice double TOP. Last night's results are pulling prices down! Make your opinion, before placing an order. ► Thank you for boosting, commenting, subscribing!
DL_INVEST
Gold Spot / U.S. Dollar

Hello community,Look at the price of gold since 1833!Weekly scale in log, I use linear regression, powerful mathematical tool!The graph speaks for itself.Make your opinion, before placing an order.► Thank you for boosting, commenting, subscribing!
DL_INVEST
Bitcoin / TetherUS

Hello community,Small daily chart on BTC.I have displayed the accumulation zones.The historical high is at $73,777, I think we will go for it.The 200-period simple average is flat.Not being a crypto specialist, my analyte may be wrong.Make your opinion, before placing an order.► Thank you for boosting, commenting, subscribing!
DL_INVEST
Daily chart of the 7 Magnificents
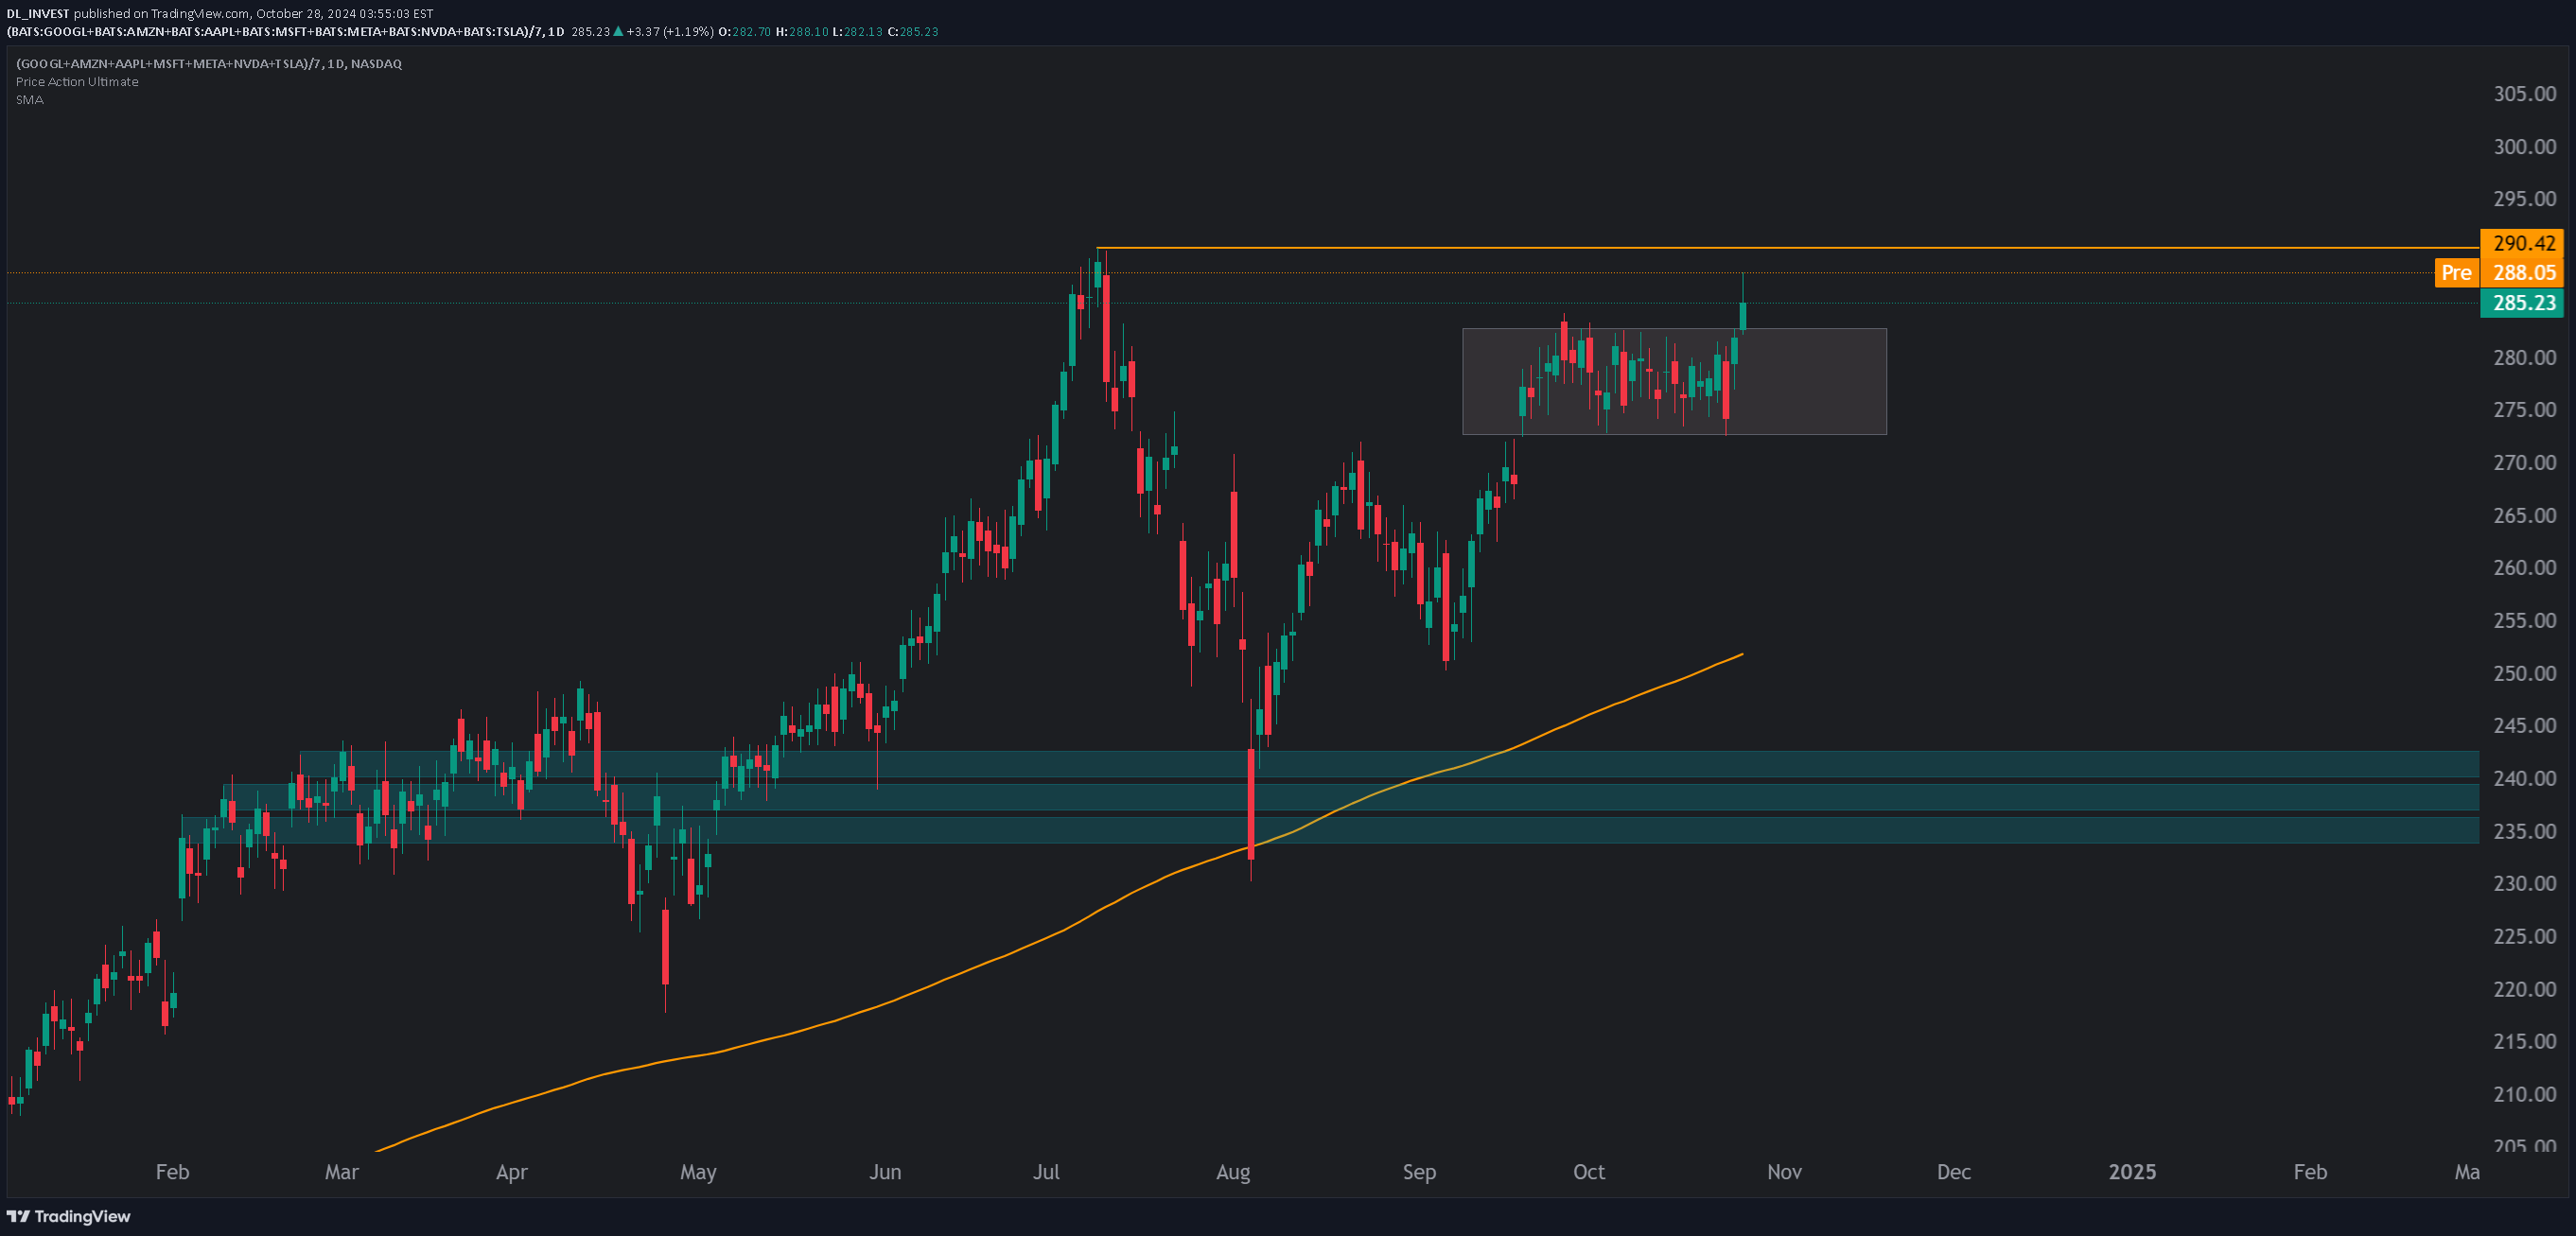
Hello, Daily chart of the Magnificent 7 chart. Are we heading towards a double top? The 200-period simple moving average in orange is bullish. On the chart, the 3 accumulation zones are indicated. Elections are coming soon, things can change. Make your own opinion before placing an order. ► Thank you for boosting, commenting, subscribing!
DL_INVEST
Meta Platforms
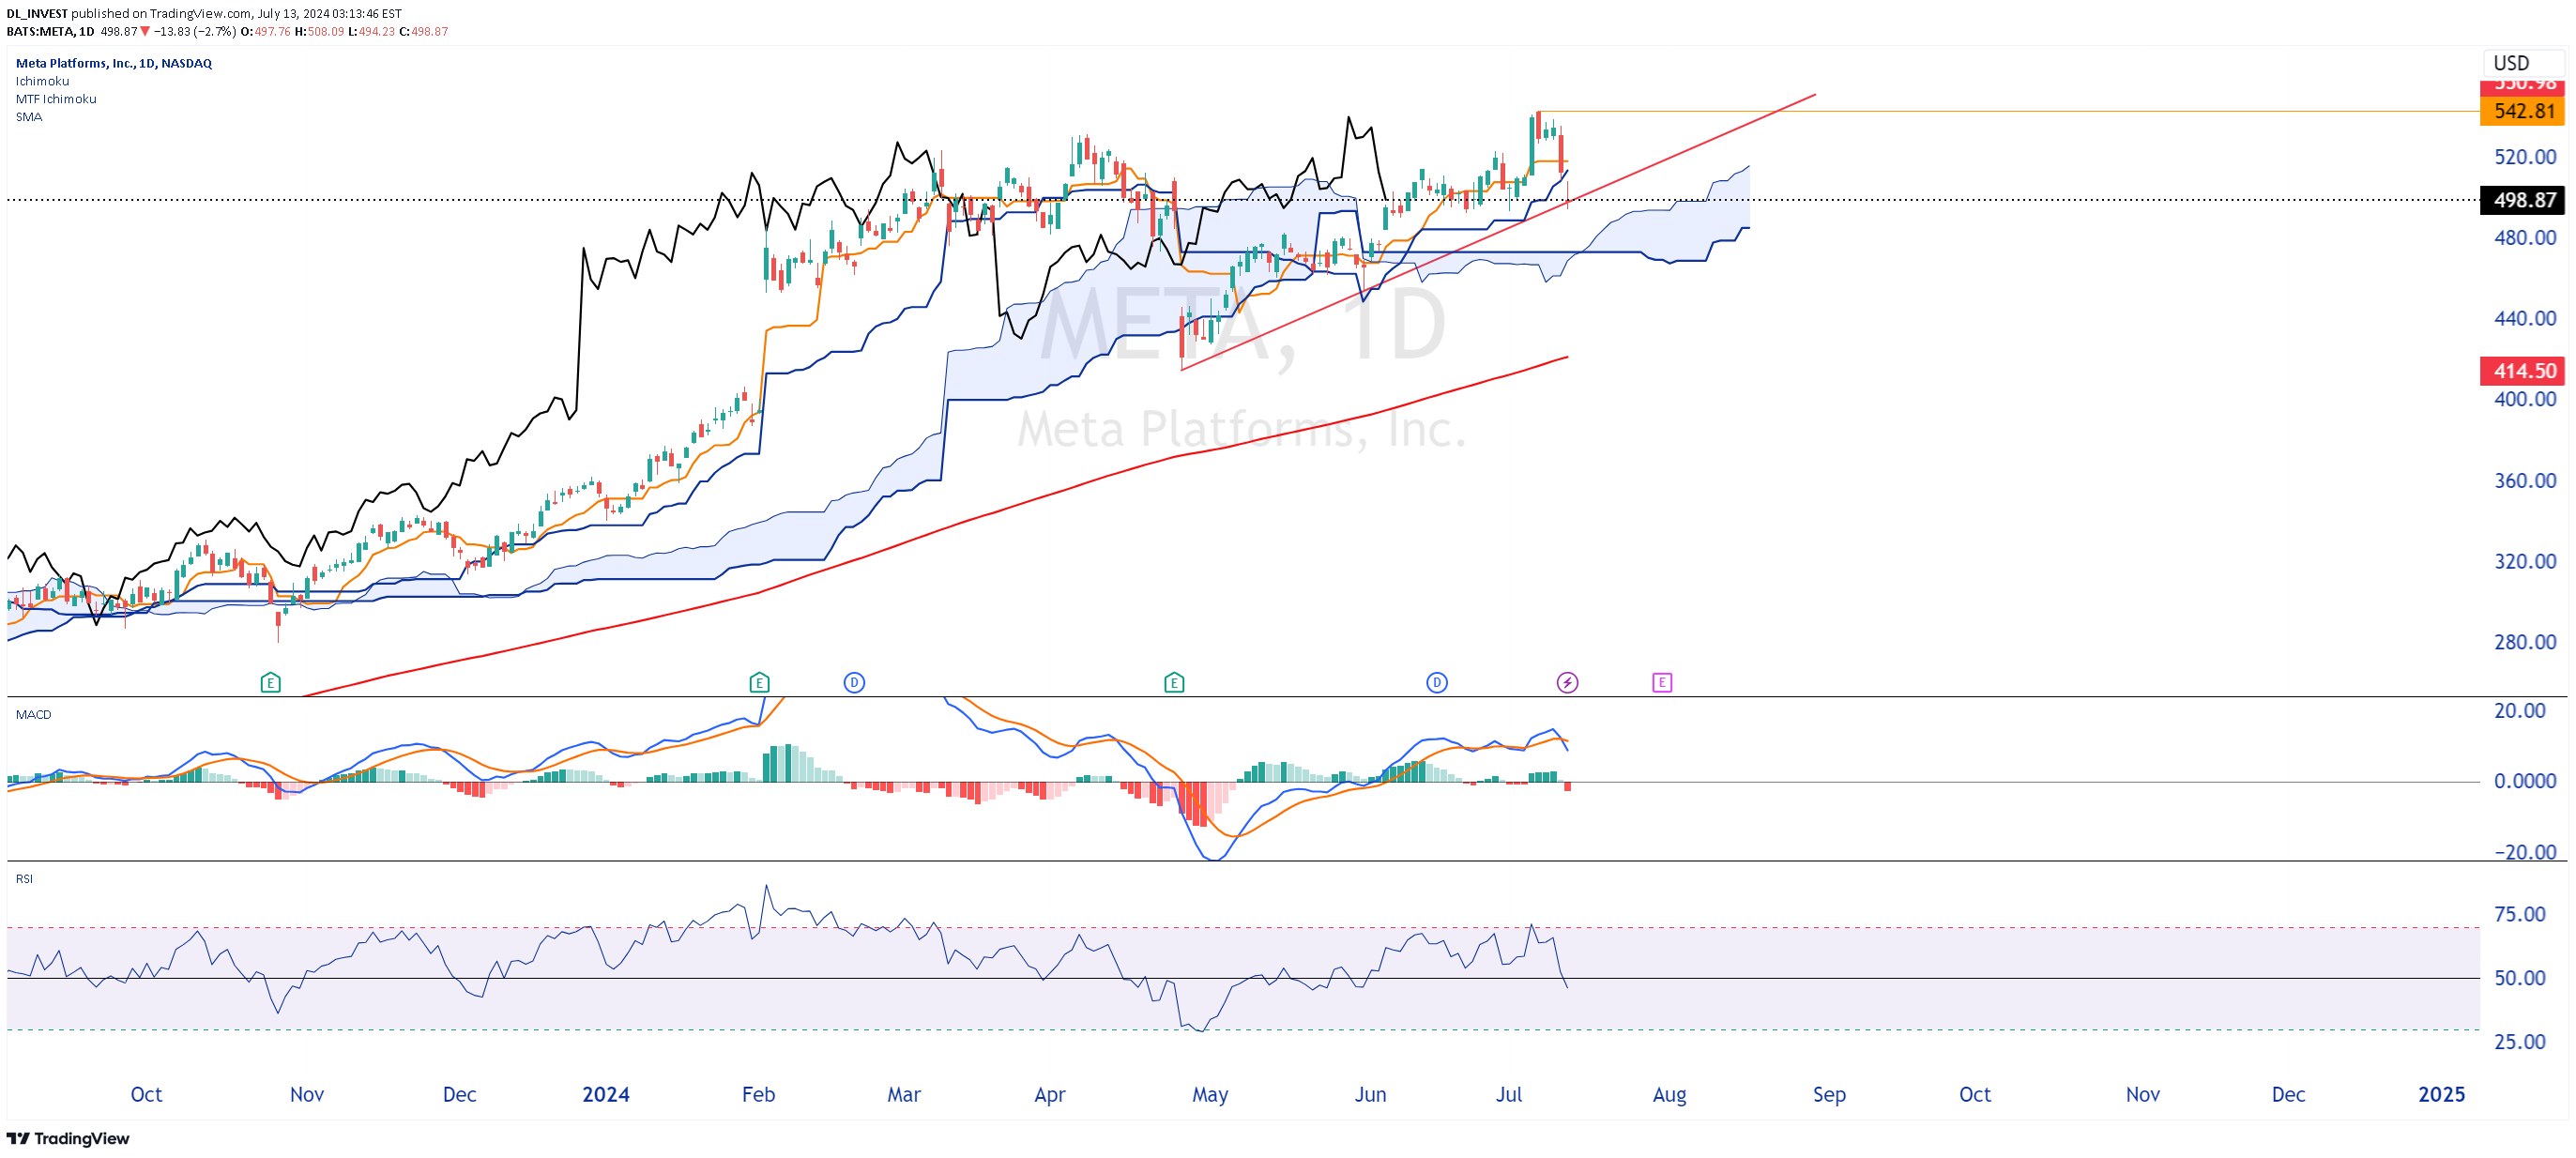
Daily chart with ichimoku. Price under the tankan and under the kinjun. We are above the cloud. Be careful, the cloud is thin and prices could pass through it easily. The SMA 200 is under the cloud, so no worries. MACD increasing, but above the 0 line. The RSI is slightly below 50. To conclude, the trend is bullish, we must monitor the break of my red line, which could announce a corrective movement. Happy trading to you.
DL_INVEST
Alphabet Inc (Google) Class A
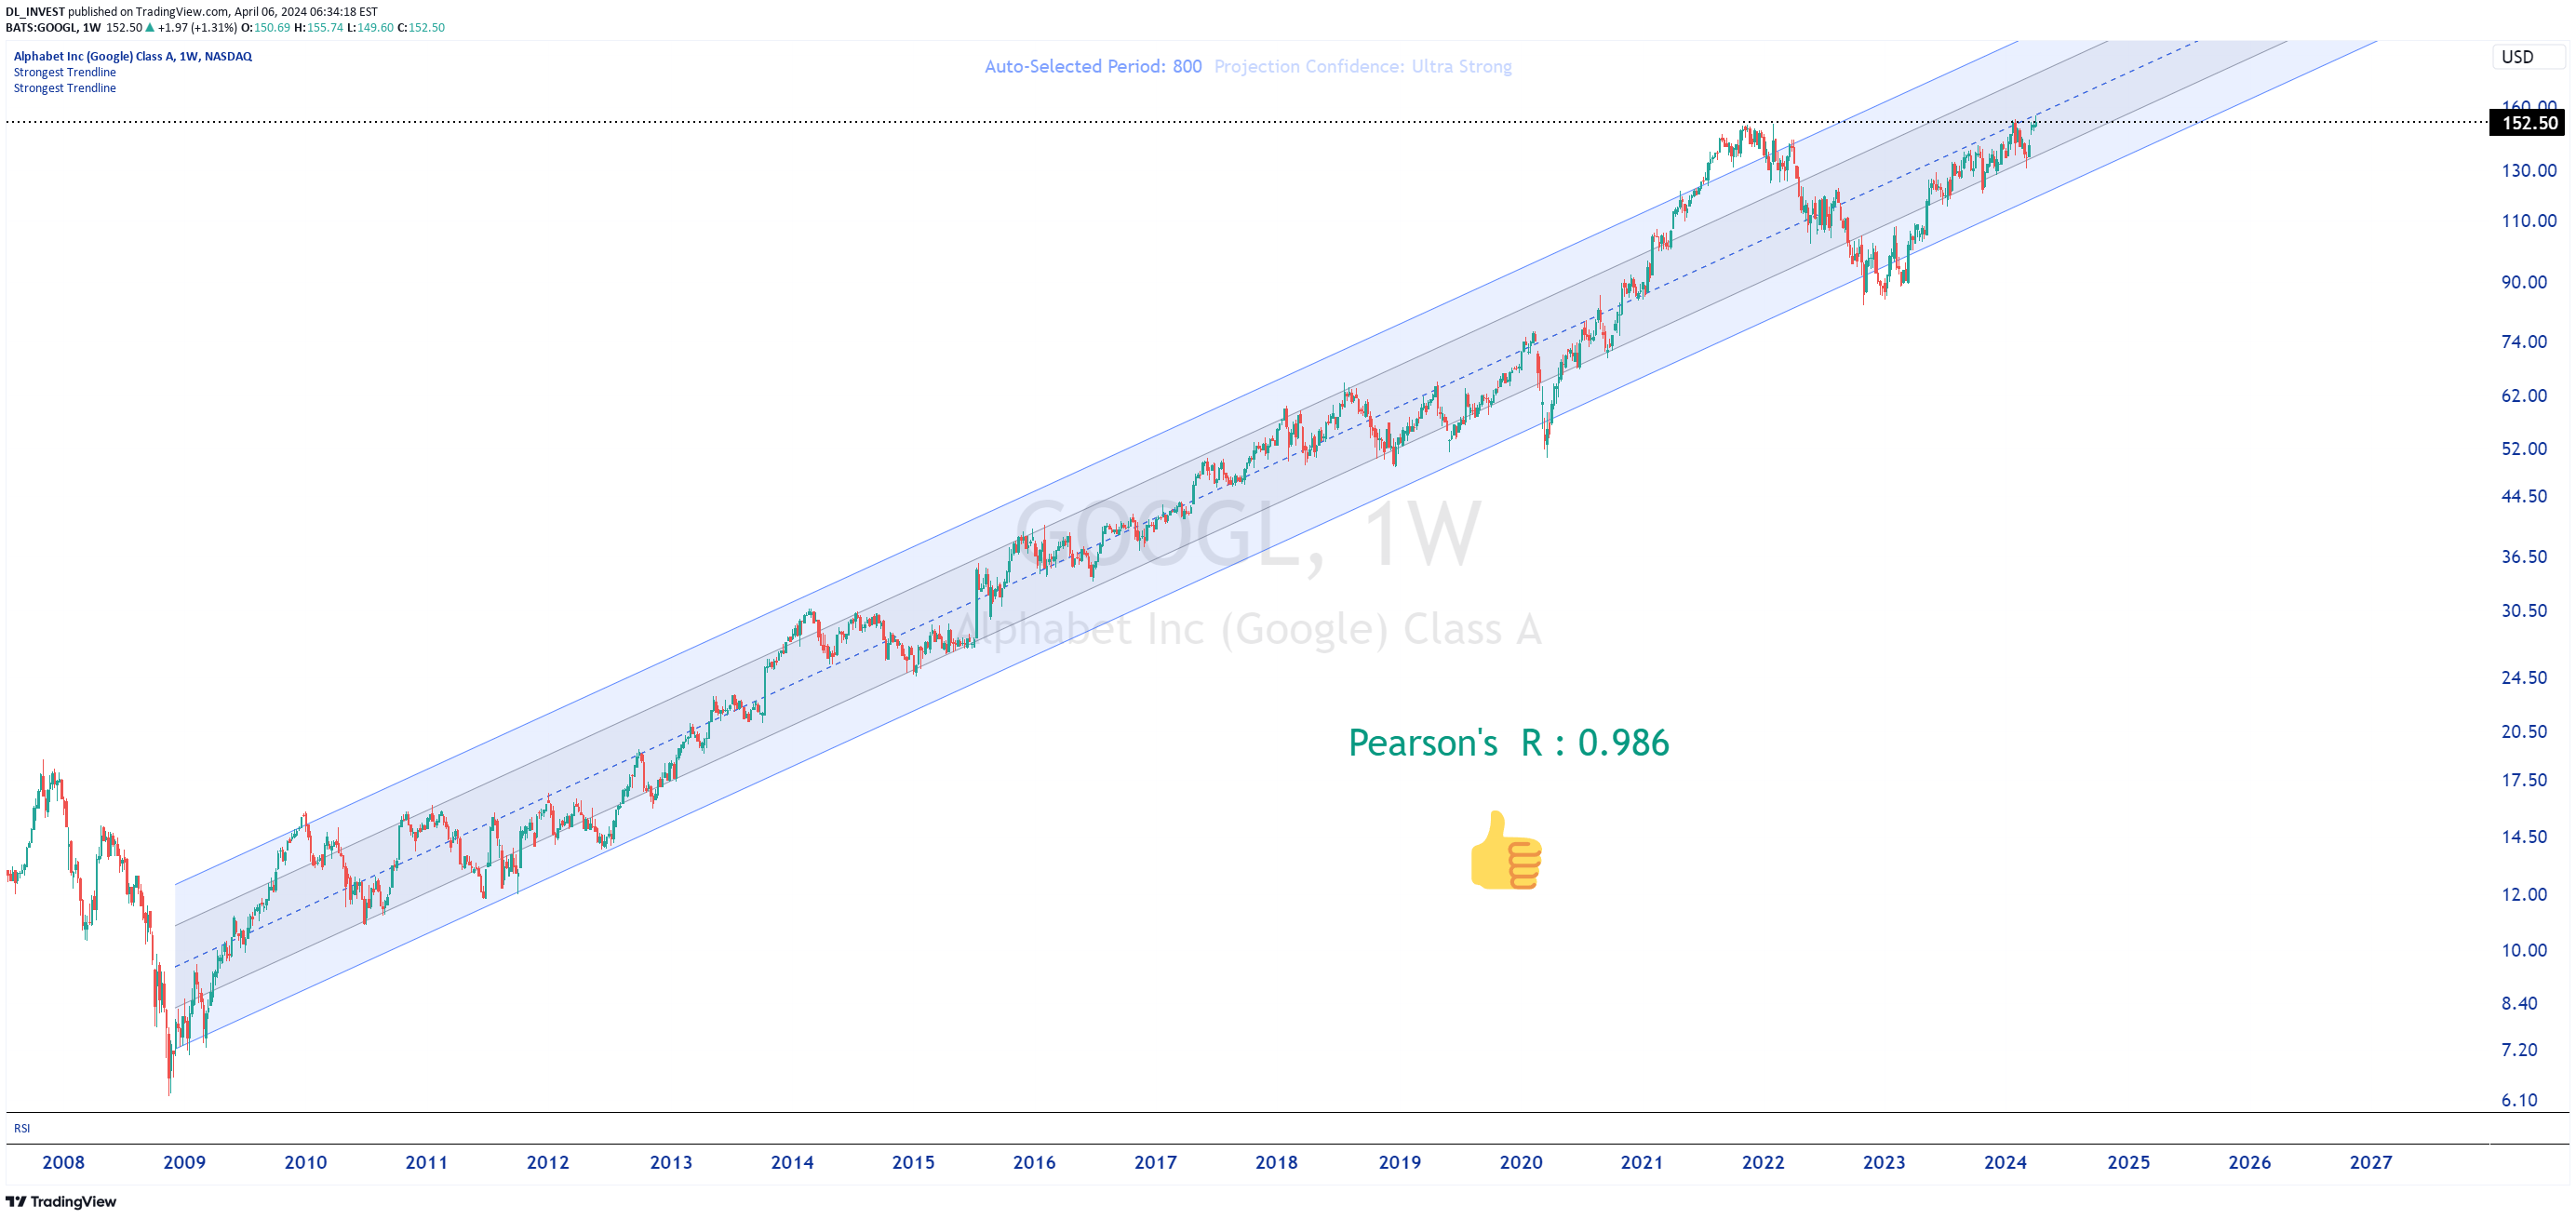
Weekly chart in logarithmic scale. Friend indicator Julien_Eche 1. Overall Trend: - The chart shows a long-term bullish trend for Google's (GOOGL) stock. The share price has seen steady progression from 2009 to 2024. 2. Trading Channel: - A well-defined trading channel can be identified, with parallel trendlines that establish the range of fluctuations in the long run. - The price moves within this channel, with regular bounces off the support and resistance lines. 3. Consolidation Phases: - Some consolidation phases are observed, where the price has seen lateral movements, such as in 2011-2012 and 2018-2019, before resuming the uptrend. 4. Upside Potential: - Currently, the price seems to be near the upper limit of the channel, suggesting limited upside potential in the short term. - However, the trading channel implies the possibility of continued long-term bullish trend, if the price can decisively break above this current resistance level. In summary, the chart displays a long-term bullish trend for Google's stock, with a well-established trading channel that frames the price fluctuations. This suggests further upside potential, provided the price can overcome the current resistance. Make up your mind before placing an order. ► Please boost, comment, subscribe!
DL_INVEST
Magnificent seven 🚀
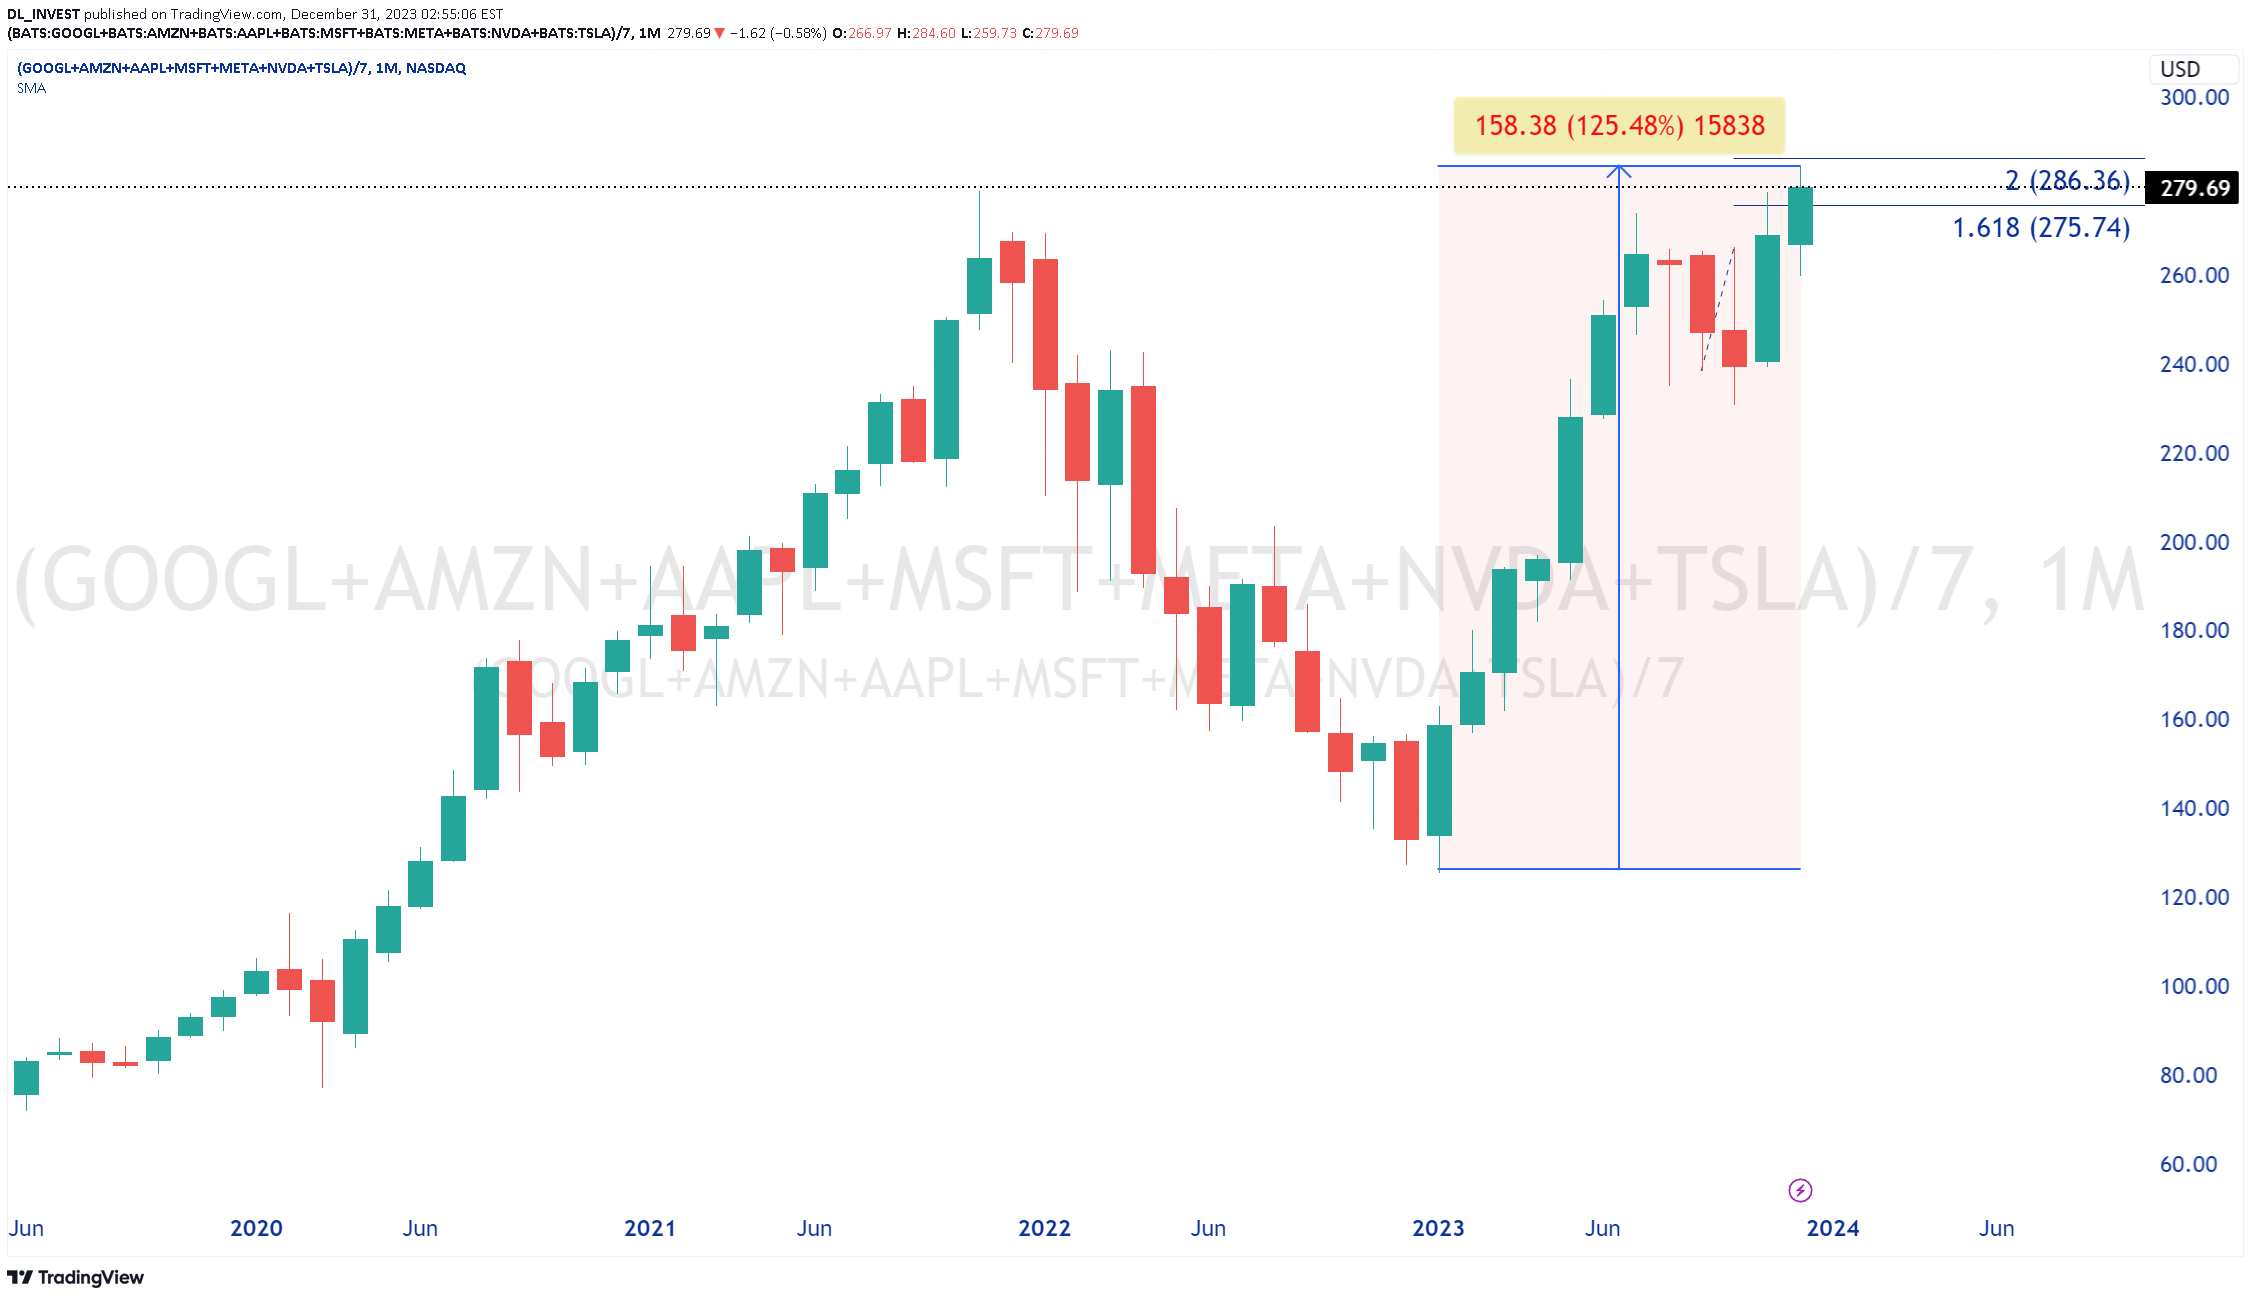
Monthly chart: magnificent seven Impressive increase, with a performance of 125.48% The year was rich for the American technology sector. Good year ! 🚀
DL_INVEST
Magnificent seven
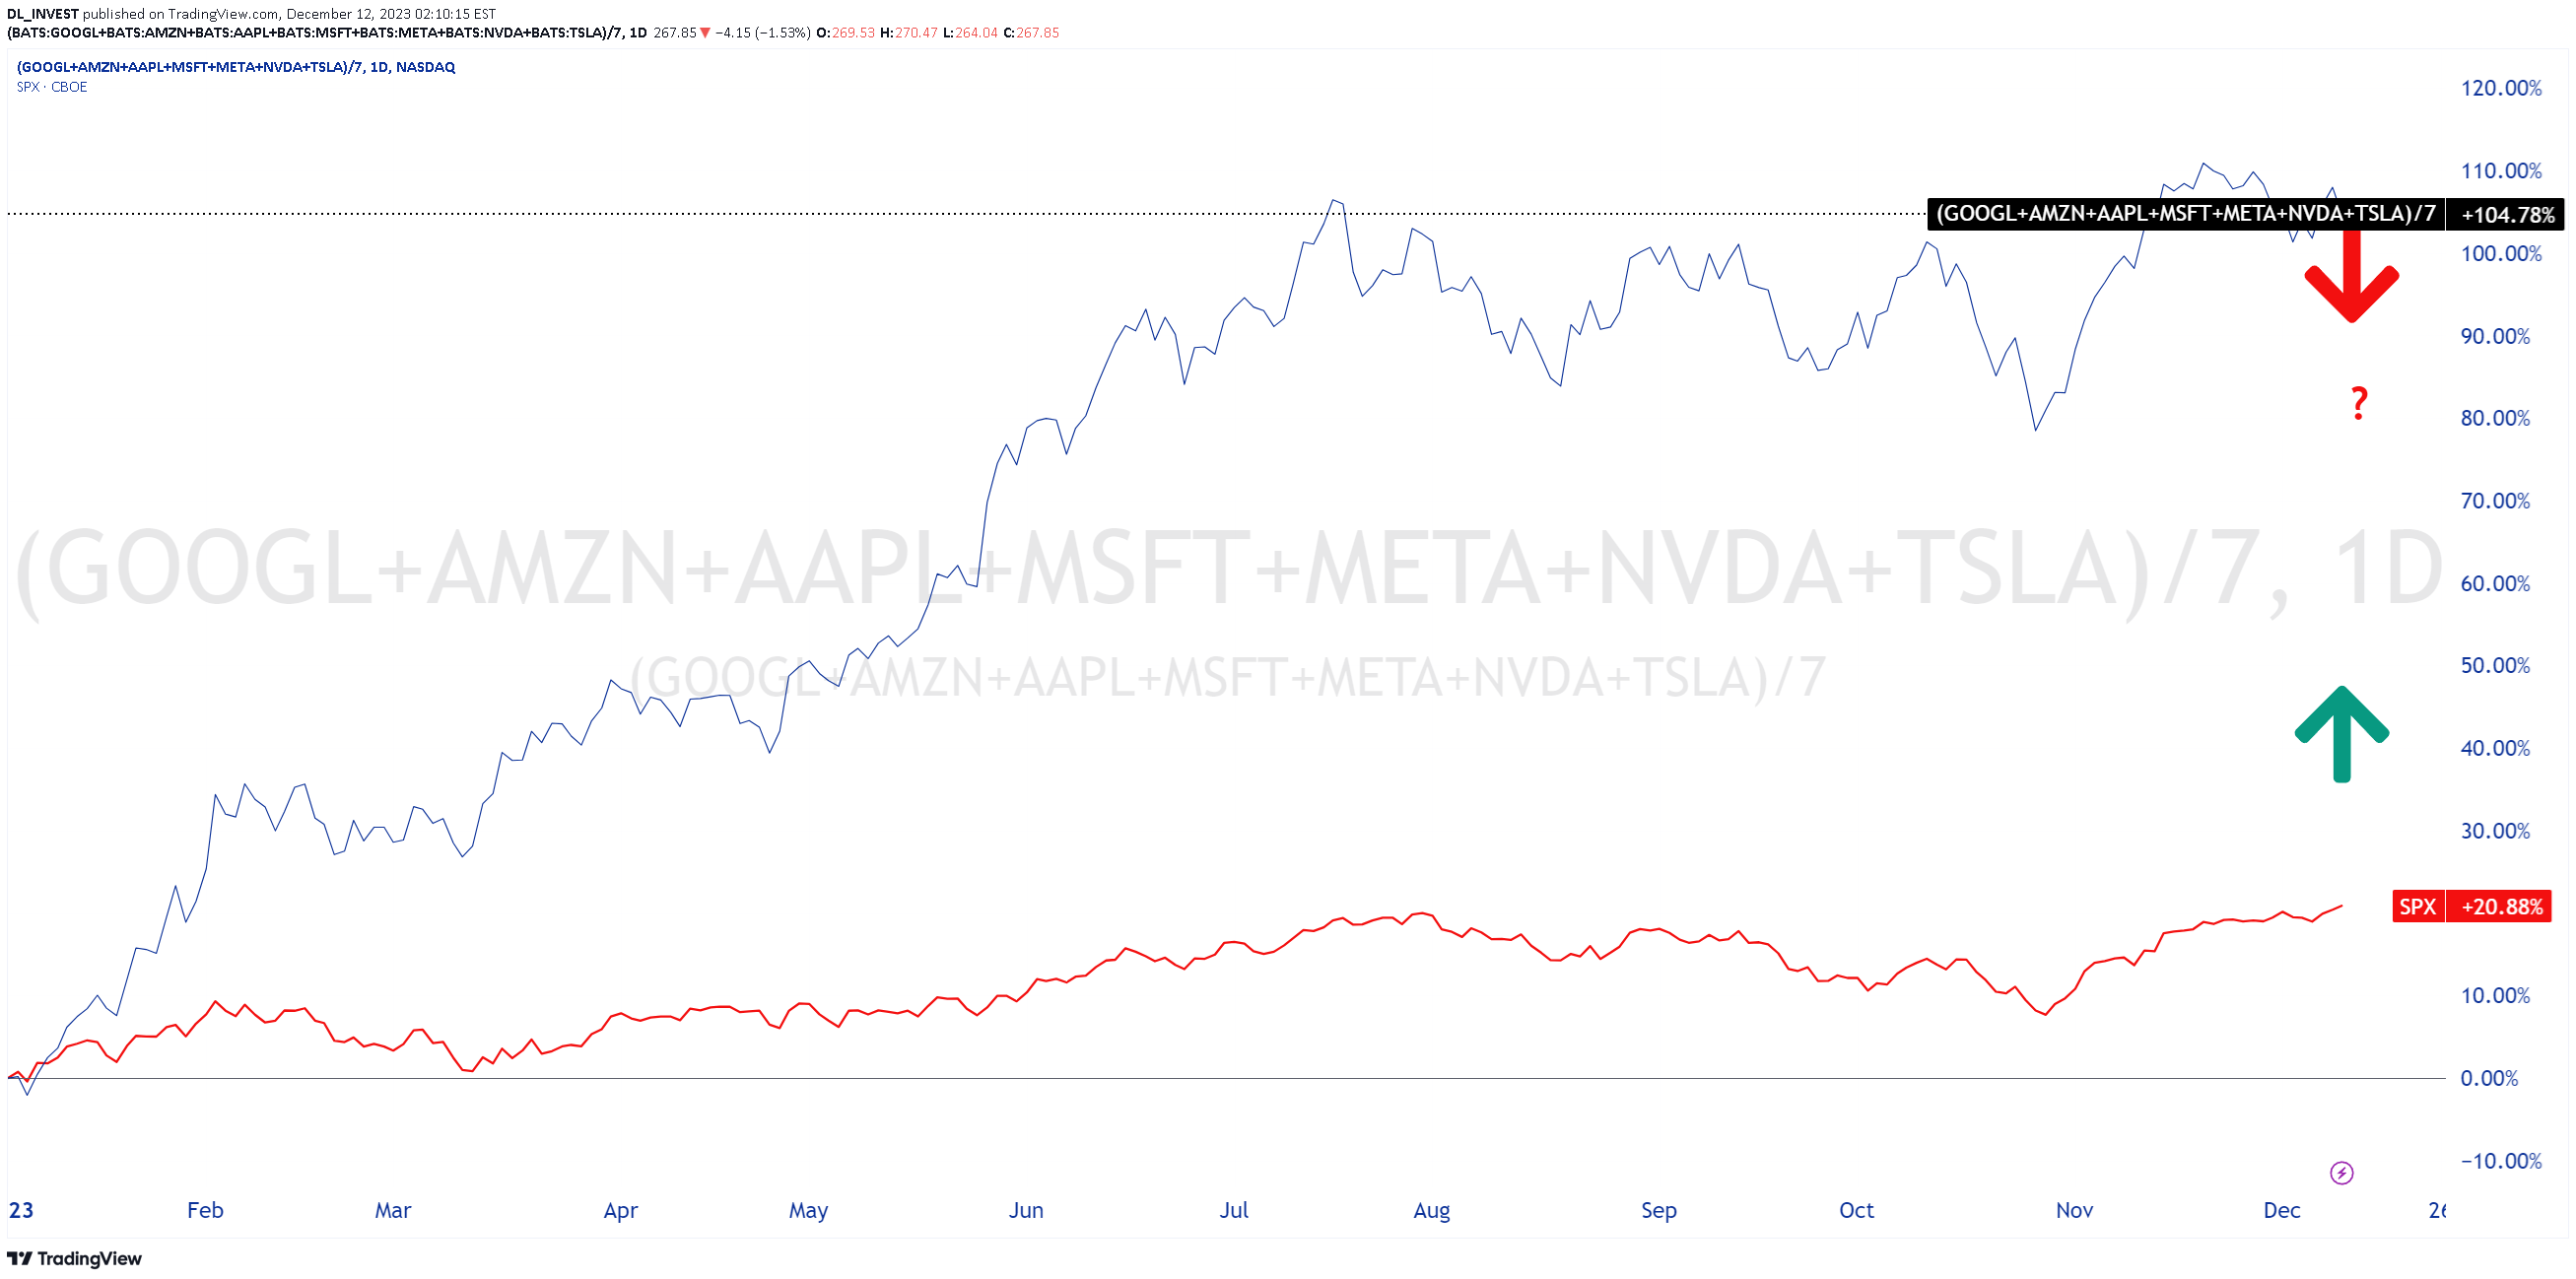
Daily chart. Comparison between Magnificent seven and S&P500. Profit taking? Make up your mind.
DL_INVEST
Alphabet Inc (Google) Class A
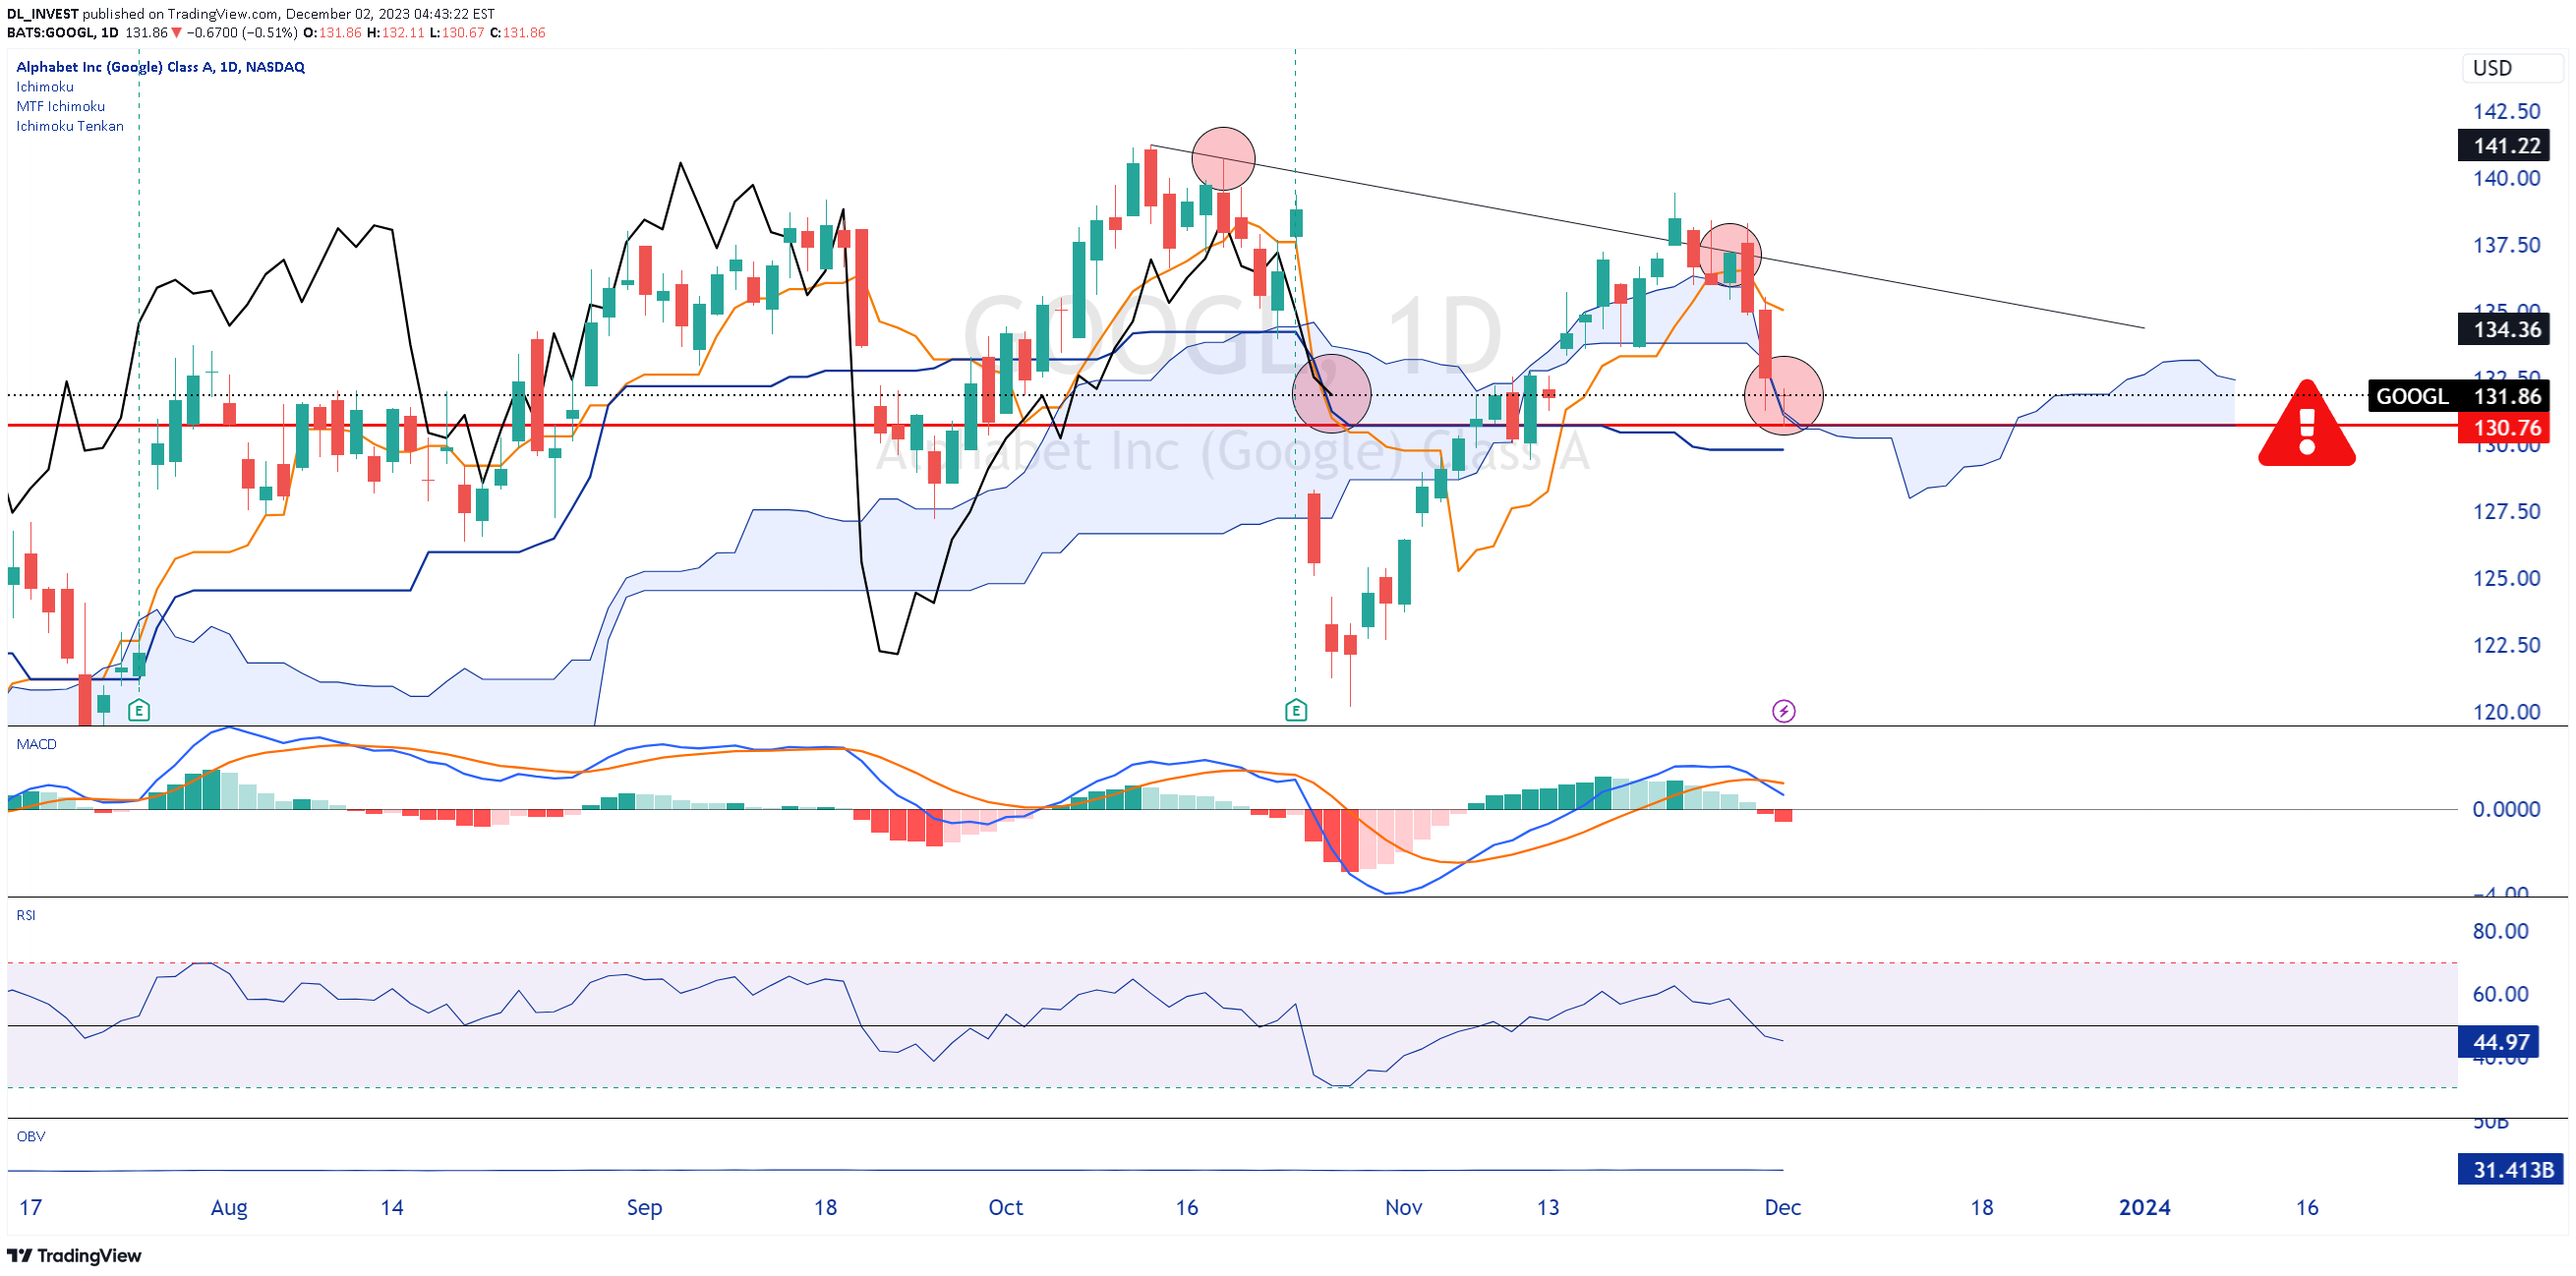
Daily chart with ichimoku. In short, I don't like the graph very much. Make up your mind.
Disclaimer
Any content and materials included in Sahmeto's website and official communication channels are a compilation of personal opinions and analyses and are not binding. They do not constitute any recommendation for buying, selling, entering or exiting the stock market and cryptocurrency market. Also, all news and analyses included in the website and channels are merely republished information from official and unofficial domestic and foreign sources, and it is obvious that users of the said content are responsible for following up and ensuring the authenticity and accuracy of the materials. Therefore, while disclaiming responsibility, it is declared that the responsibility for any decision-making, action, and potential profit and loss in the capital market and cryptocurrency market lies with the trader.