Cryptolover333
@t_Cryptolover333
What symbols does the trader recommend buying?
Purchase History
پیام های تریدر
Filter
Signal Type
Cryptolover333
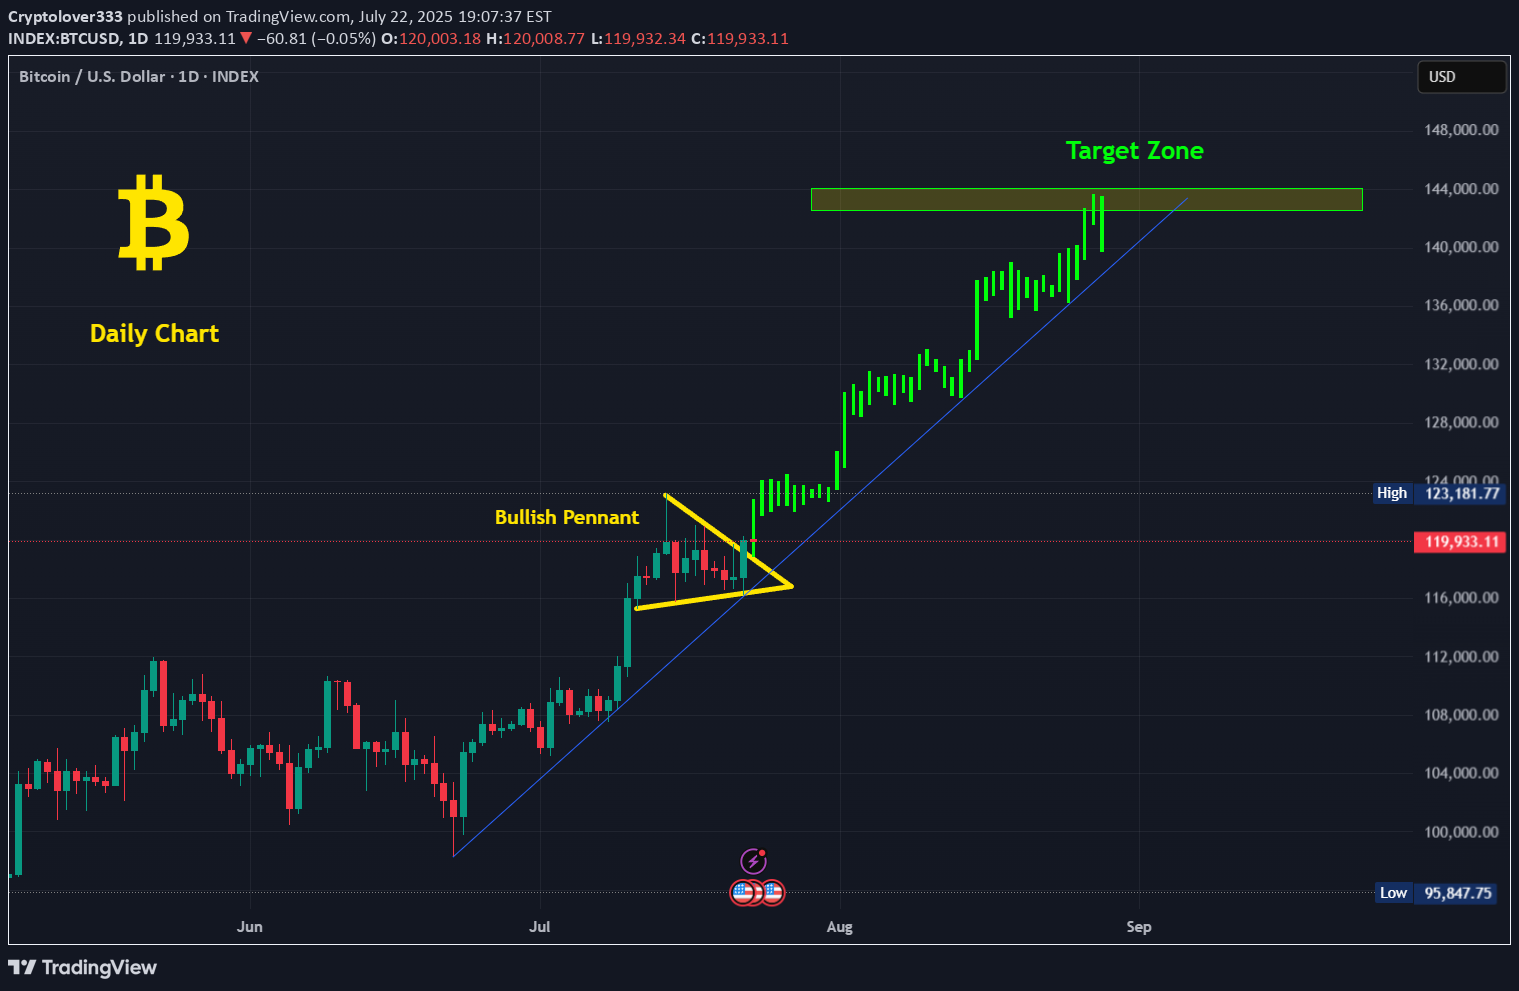
Bitcoin seems to be breaking out from this bullish pennant and it could be in the way to hit a target of $142,500 to $144,000 by the end of next Month most probably at least if is not before, I have posted an idea before in the 4 hours chart but this is an update on this daily chart, is looking good and as expected, happy trading everyone!
Cryptolover333
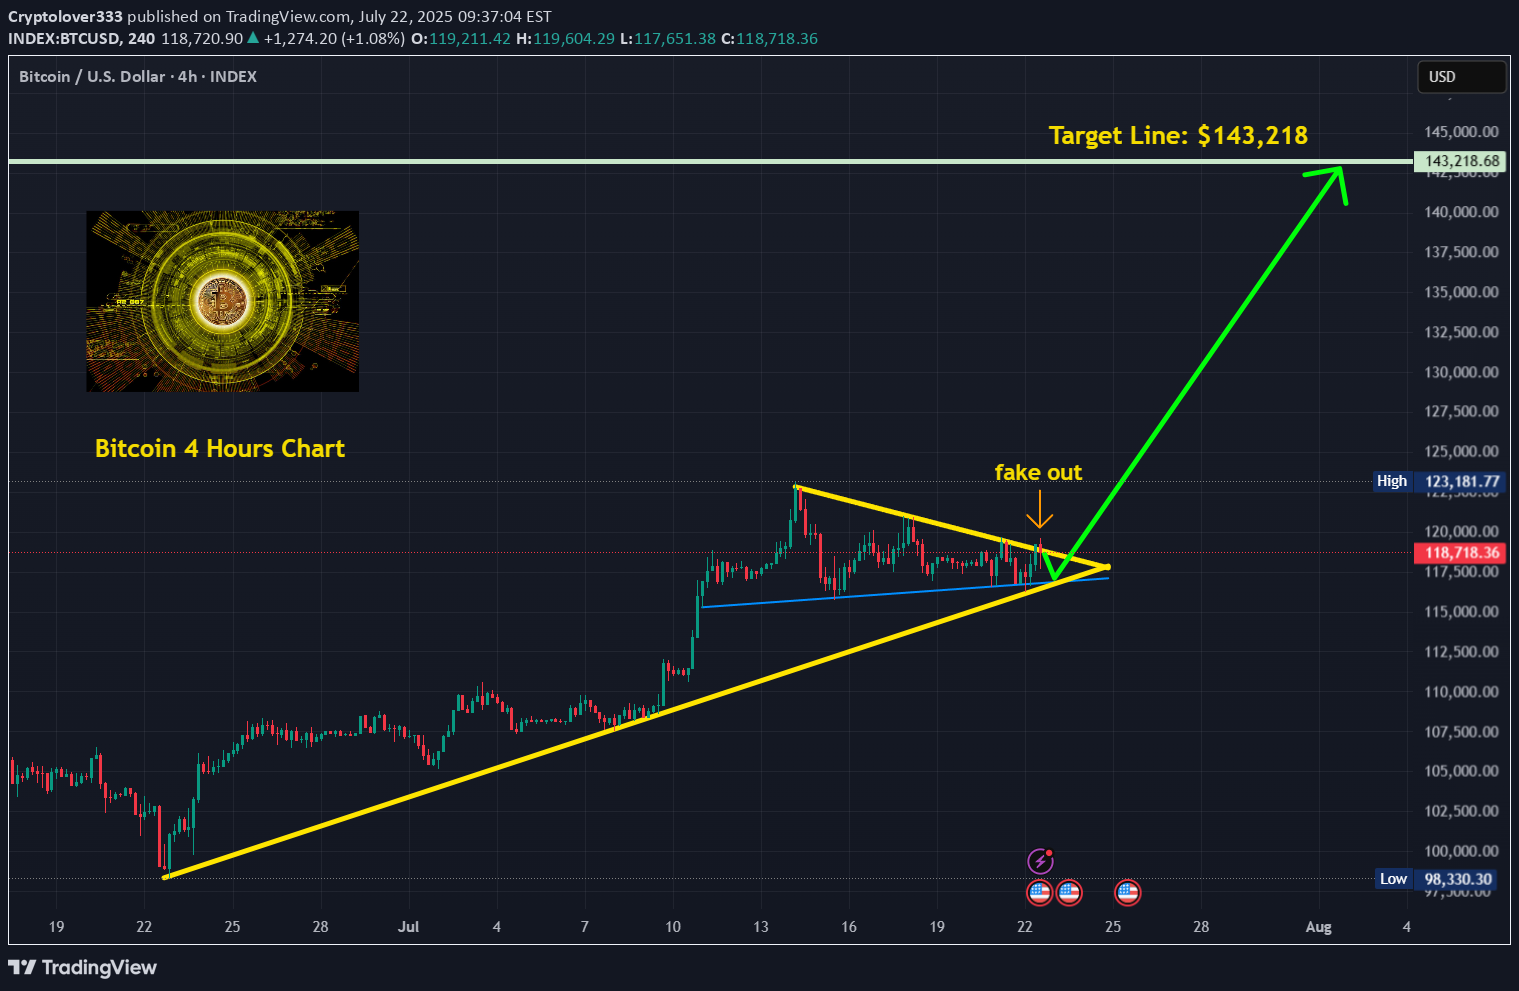
Bitcoin seems to be completing a massive symmetrical triangle or a Bullish pennant (Blue line), it doesn't matter what it is because the target is the same, we could observe a huge move soon this week most probably or by next one maximum after breakout if is not fake again, Bitcoin have many fake outs but soon it could make a start to the target line!
Cryptolover333
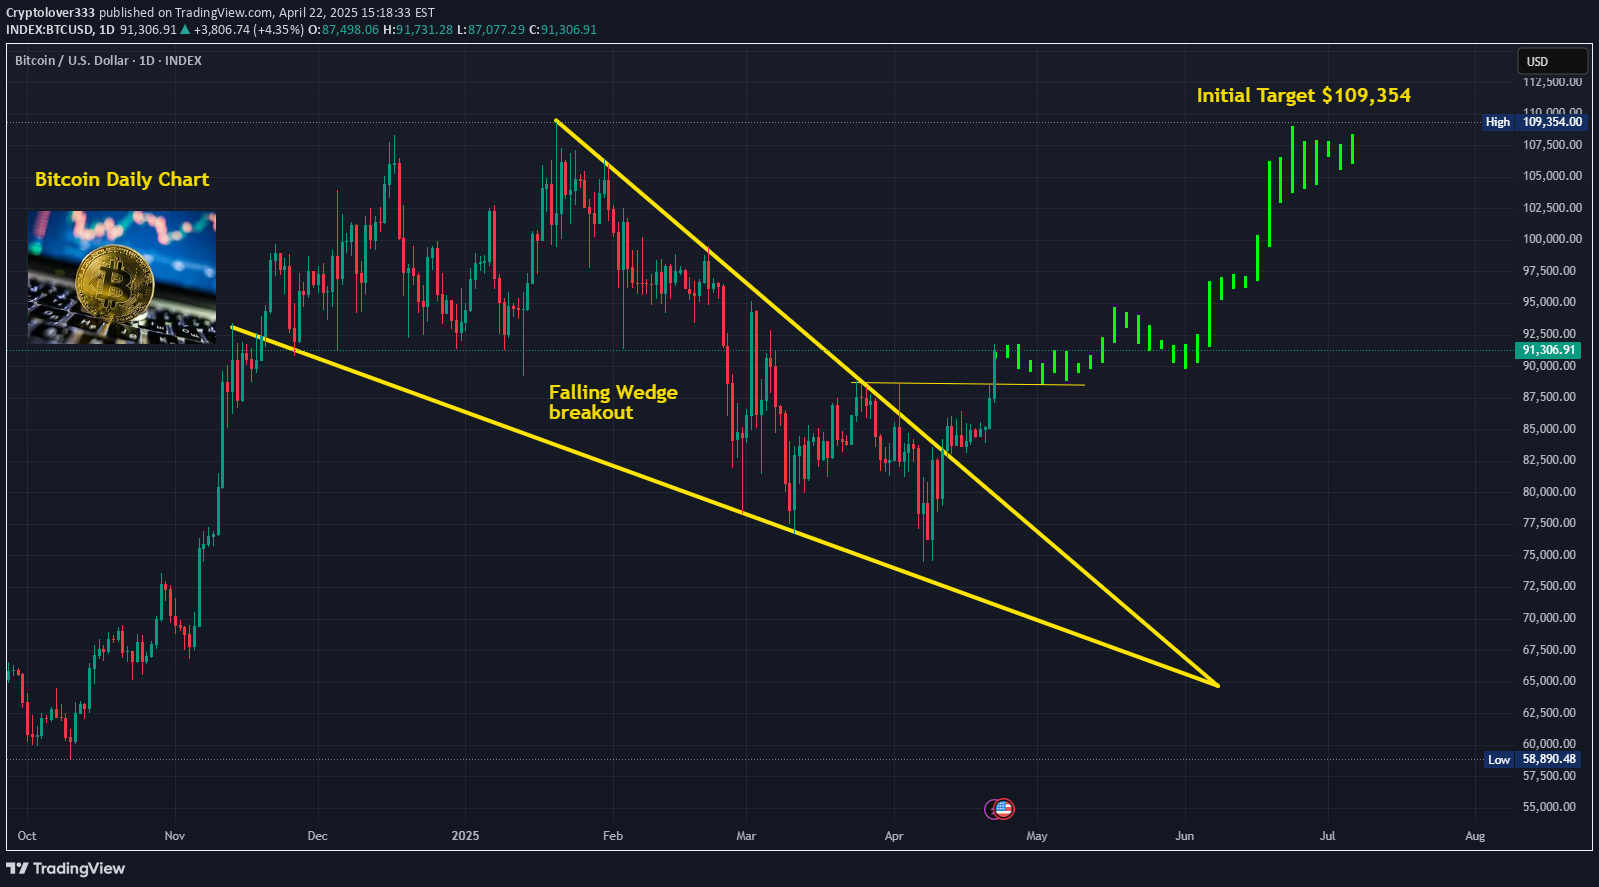
The Falling Wedge posted on my previous idea has now breakout and retested, it is very likely that bitcoin could follow the candles pattern I put in this idea and hit the target , I think this is only the beginning of a massive move that could be about to explode soon for a couple of Months, fingers crossed.
Cryptolover333
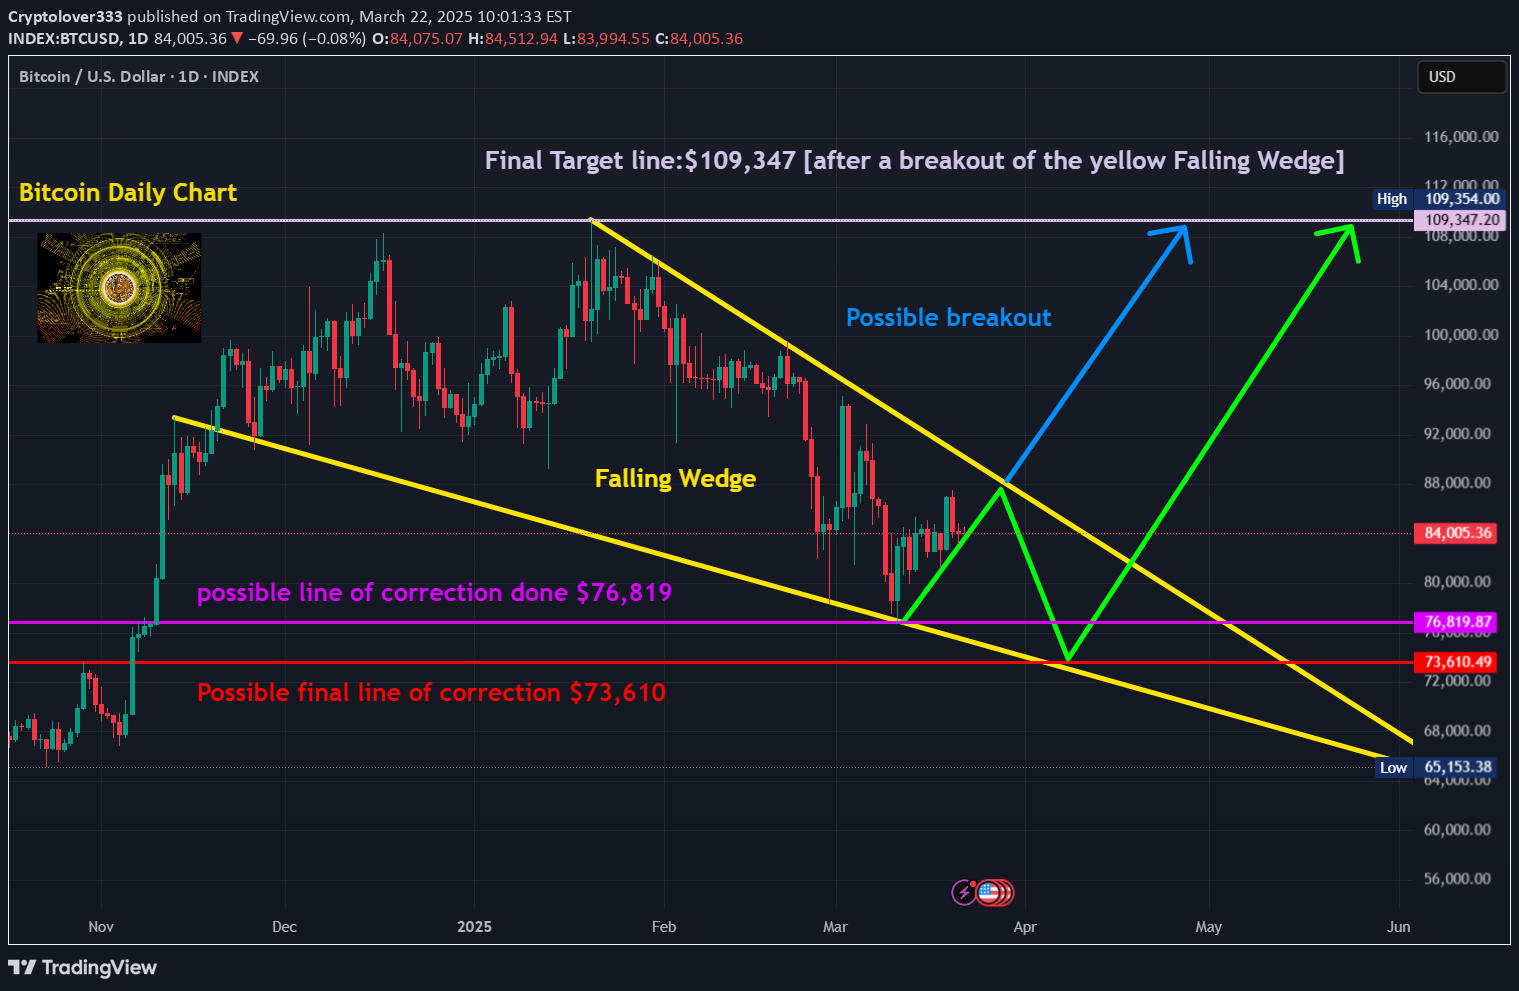
Bitcoin finally seems to be forming a Falling Wedge here in this daily Chart, it has been really boring the last few weeks and that is the reason why I didn't posted any idea for a while, now Bitcoin could start what I believe to me a possible next supper rally before the next Bear Market starts, the initial target could be the top of this Wedge sitting at $109,347, there is a purple line with a possible correction bottom done sitting at $76,819 and a red line sitting at $73,610 in case of the worst think to happen that would be the next correction target but there is always a possibility to go a bit bellow and hit the yellow line of the Wedge and complete the pattern but I have a strong feeling that a breakout to the upside could be in the way soon as there is also Bullish divergences in the RSI on this daily Chart.
Cryptolover333
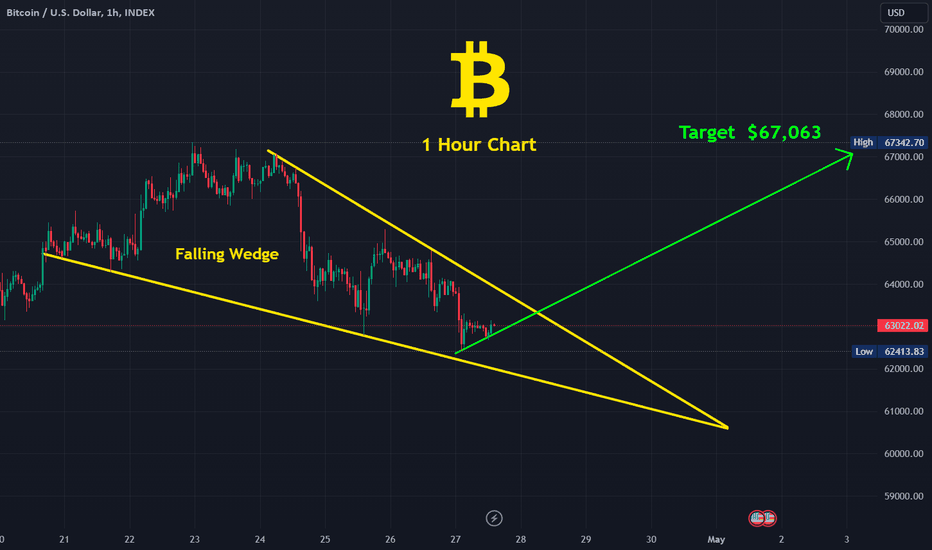
Bitcoin is been forming a falling wedge in this one hour chart, also visible in 4 Hours chart but more clear here, I am long after breaking this most likely to the upside.
Cryptolover333
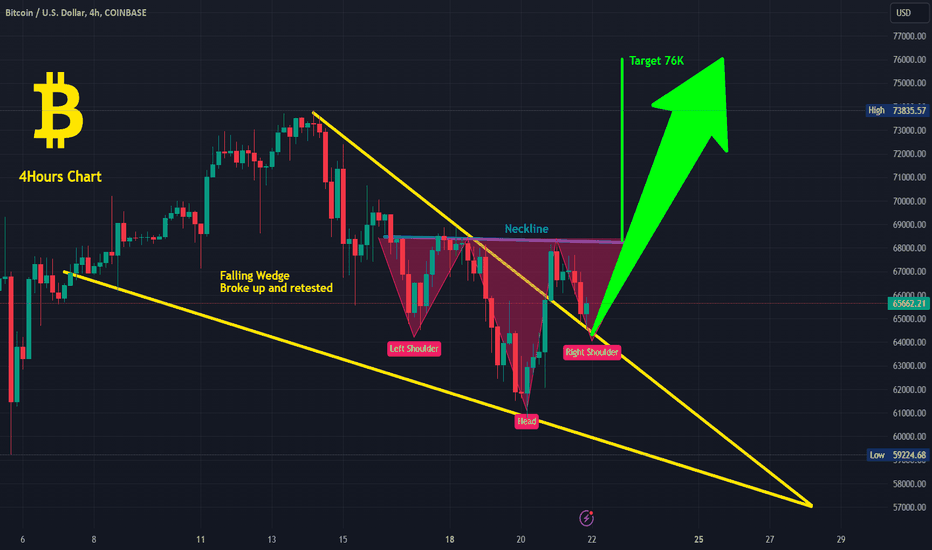
Bitcoin has retested the Falling Wedge two times in this four hours chart, and what was looking a possible double Bottom now is looking more an inverse head and shoulders that could potentially give the same target as the double bottom, $76,000, so lets hope that this breakout of this Wedge is not a fake out and this inverted head and shoulders play out!.
Cryptolover333
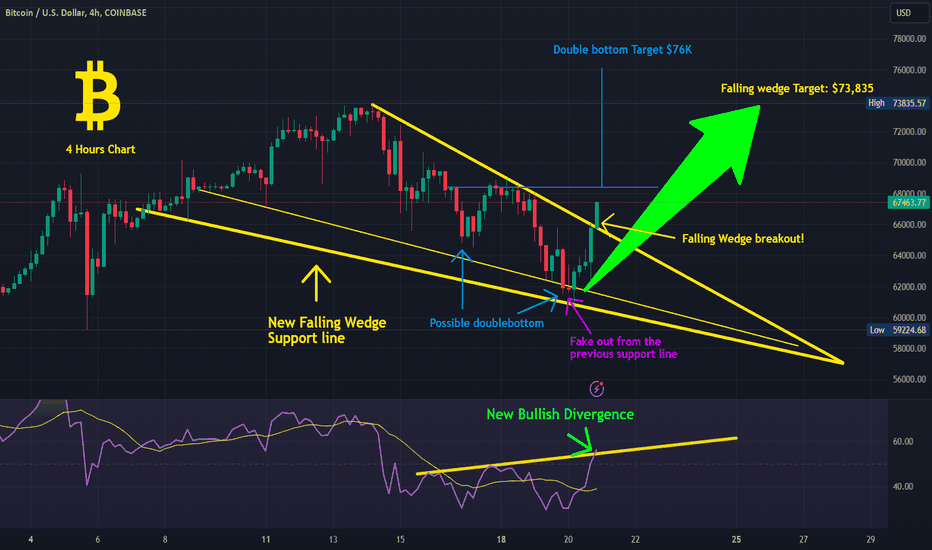
Bitcoin is finally breaking out from this Falling Wedge mentioned in my last idea from yesterday, last night it was a fake out that normally happens a lot in the bitcoin charts but it is finally breaking up with a target on the beginning of the wedge at $73,835, but the good news here is that it could also form a doubled bottom with a potential target of at least $76,000 ,fingers crossed and good luck to everyone!
Cryptolover333
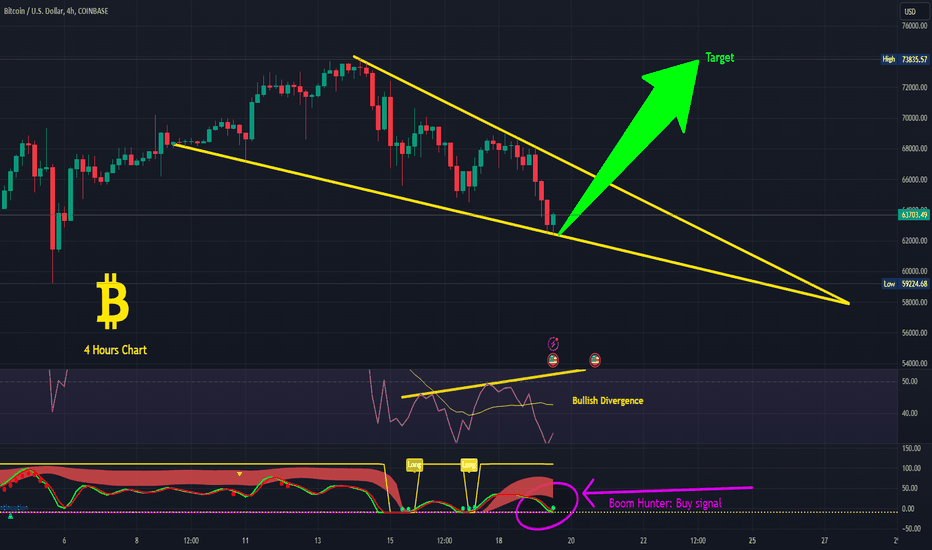
Bitcoin correction could be over, it is creating an extended falling wedge and at the same time Bitcoin have a bullish divergence in the rsi in this 4 Hours chart, also Bitcoin have a buy signal on the boom hunter indicator and the Stochastic RSI is also oversold, it has only maded support in the 5 Weekly EMA so this is a good sign and needs to happens often, everyone is thinking we are going much lower but I seriously think that the correction could be over so fingers crossed and good luck everyone!
Cryptolover333
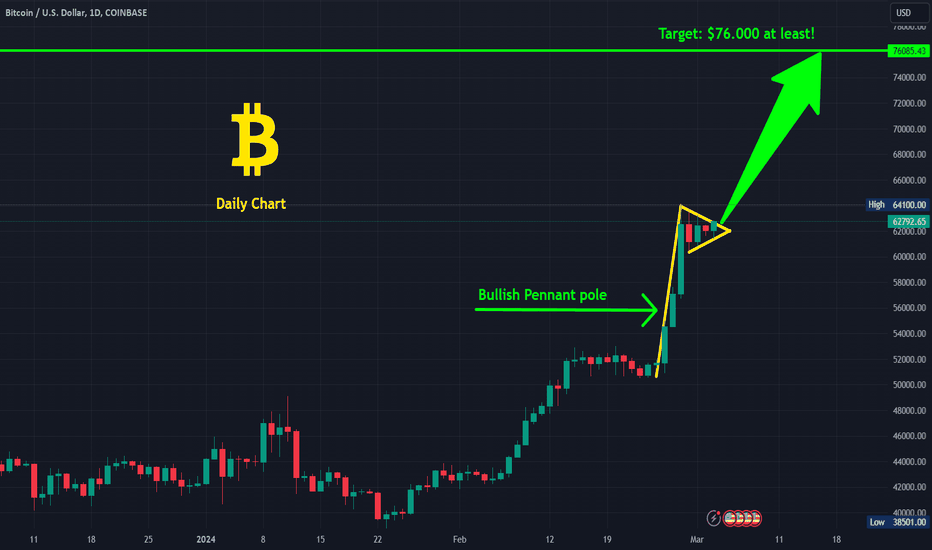
Bitcoin is trying to breakout from this bullish pennant that still in place in this daily chart, you could observe this better than in the 4 Hours chart, if this happen and is not a fake out we could see an ATH as early as next week for bitcoin! this never happened before the halving, so fingers crossed that it could happen for the first time in history, good luck!
Cryptolover333
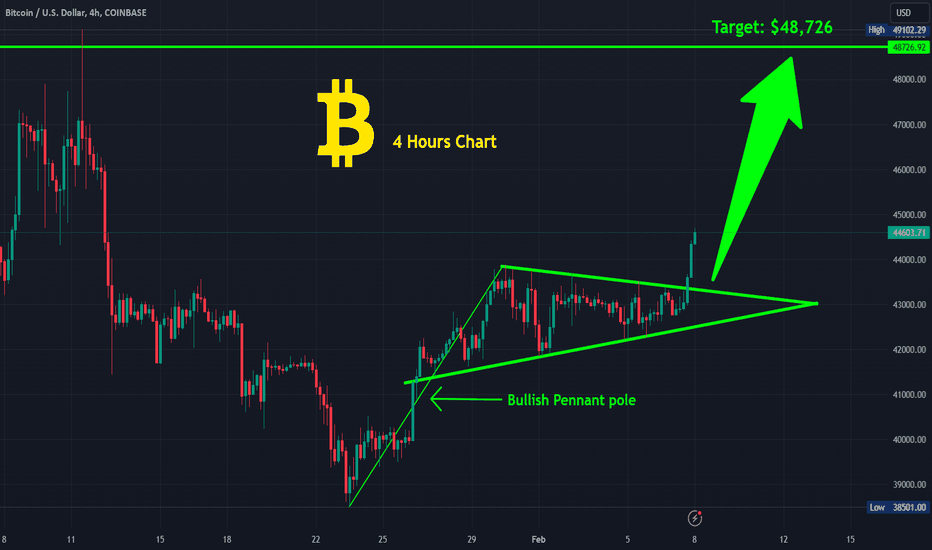
Bitcoin is clearly breaking up from this Bullish Pennant in this 4 hours chart, it is less than two weeks so the measurement will be from the flag pole bottom to the top, if this was longer than 3 weeks it would has been considered a Symmetrical triangle but is not, so the target here would be $48,726, hope is not a fake out, good luck!
Disclaimer
Any content and materials included in Sahmeto's website and official communication channels are a compilation of personal opinions and analyses and are not binding. They do not constitute any recommendation for buying, selling, entering or exiting the stock market and cryptocurrency market. Also, all news and analyses included in the website and channels are merely republished information from official and unofficial domestic and foreign sources, and it is obvious that users of the said content are responsible for following up and ensuring the authenticity and accuracy of the materials. Therefore, while disclaiming responsibility, it is declared that the responsibility for any decision-making, action, and potential profit and loss in the capital market and cryptocurrency market lies with the trader.