
Crypto_Ikigai
@t_Crypto_Ikigai

What symbols does the trader recommend buying?
Purchase History
پیام های تریدر
Filter
Crypto_Ikigai
تحلیل ساختار بیت کوین: آیا روند نزولی تمام شده یا فقط بازیابی موقت است؟
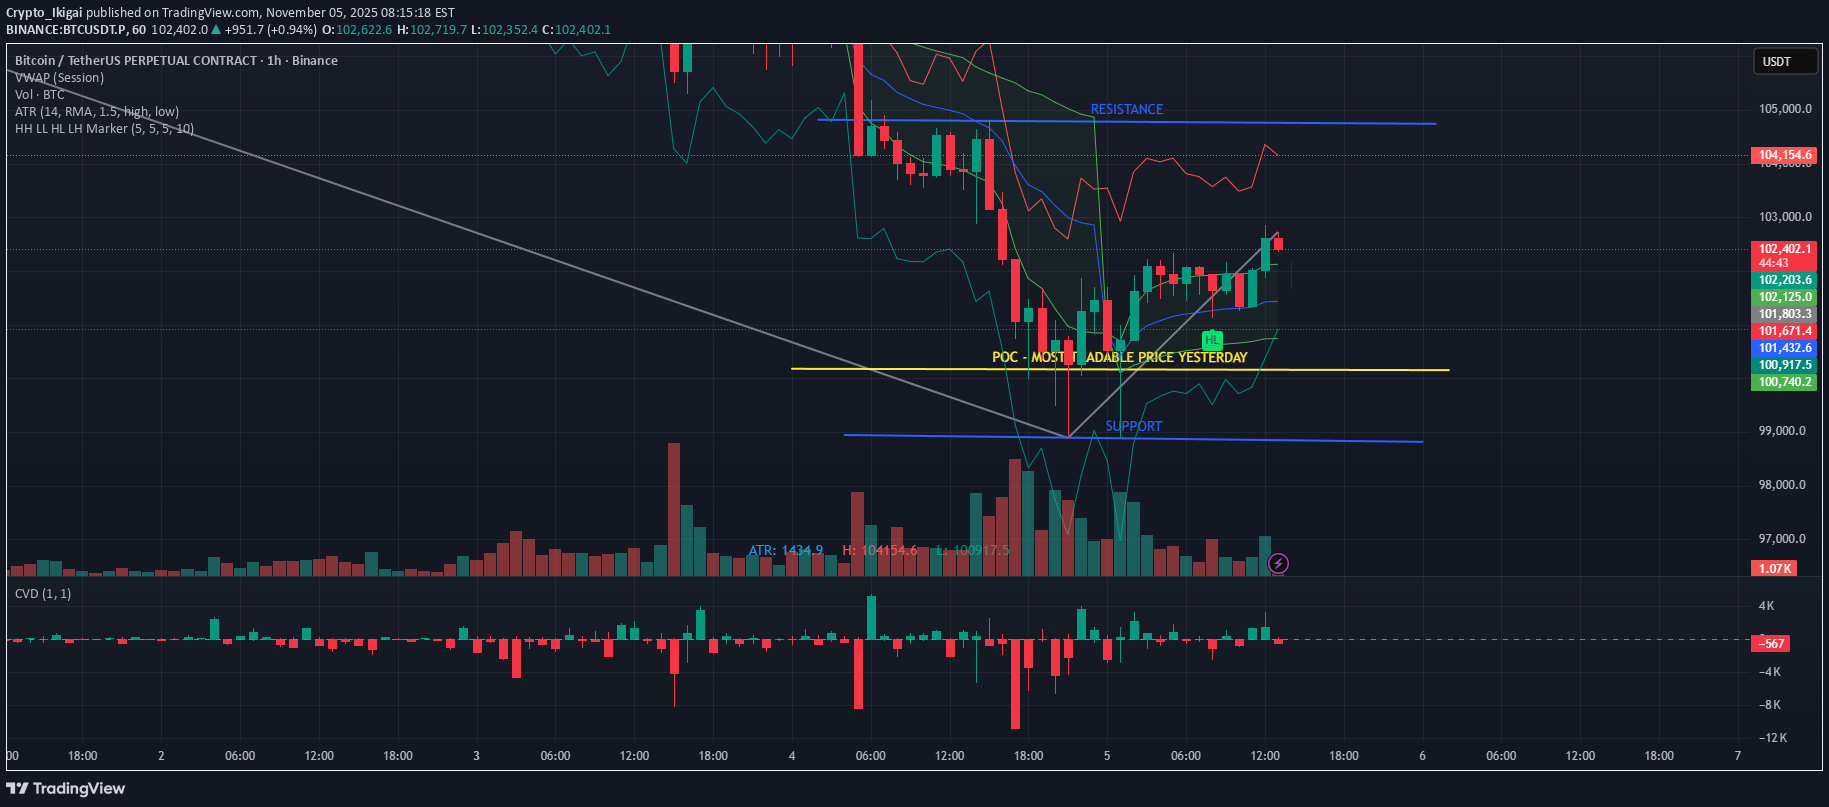
✅ What the chart is telling us 1) Strong Impulsive Down Move Large bearish impulse candles High selling volume CVD deeply negative → aggressive sellers in control Main trend is still down. 2) Reversal Reaction at Support Zone At the local bottom we see: Increased volume at lows ✔️ CVD flattening ✔️ Multiple failed breakdown attempts ✔️ This area shows buyers absorbing, shorts covering, and early longs stepping in. 3) First Higher Low (HL) A Higher Low formed following a sharp drop. ✅ First sign of potential trend shift ❗Not a confirmed uptrend yet To confirm a true reversal we need: HL → done HH → minor HH formed Retest & hold → pending So far this is only early recovery structure, not yet trend reversal confidence. 4) Key Level: POC + Value Area Low Price is holding above yesterday’s POC — short-term bullish signal. However, overhead we have: Mid-range resistance 102.3–102.6 supply zone Micro-value high cap Price is pushing into resistance. 📊 1H Structure Summary ElementStatus Higher timeframeDowntrend Current structureHL → minor HH VolumeStabilizing CVDRecovering (-9k → -380) LocationRetest of POC into supply BiasRange → early accumulation signs This is not a FOMO long spot. This is a range recovery zone, not breakout continuation. 🎯 Trade Scenarios 🔥 Bullish scenario Looking for: Minor pullback Hold 101.90–102.10 Break into 103,000 zone Best long entry = HL retest after breakout, not here. ❄️ Bearish scenario Short continuation if: Price loses 101.90 Drops below Value Low CVD flips down again ✅ Trader Game Plan We do not chase here. Patience wins. Looking for either: Pullback to 1H demand + bounce → long scalp Reject from 102.6 + LH on 5m → short continuation Trade the reaction, not prediction. Let the market show direction before committing. 📌 Conclusion Buyers showed life — but still need to prove momentum. Key levels Bull defense: 102.0 – 101.9 Breakout confirmation: 102.6+ Bear continuation trigger: < 101.9 Now is the time to wait, not guess. Patience ≠ weakness — it’s discipline.
Crypto_Ikigai
EOS/USDT Technical Analysis (4H Timeframe)

EOS is currently showing strong bullish momentum on the 4-hour timeframe, breaking past critical resistance zones clearly highlighted by the blue lines. The immediate support level is now established around the $0.67 region, previously a significant resistance point, indicating a successful breakout and potential for further upside. The next significant resistance to watch is around the psychological $1.00 mark, which aligns closely with the upper horizontal blue line, indicating a substantial profit-taking zone or potential reversal point if bulls lose strength. Indicators: Price is trading well above the 200-period SMA, indicating bullish bias. The CM_Ult_MacD_MTF indicator shows strong upward momentum, further supporting the bullish continuation scenario. Trade Idea: Bullish Scenario: Maintain bullish positions targeting near-term resistance at around $1.00. Tight stops recommended below $0.67. Bearish Scenario: If price rejection occurs strongly at the $1.00 zone, expect a potential retest of the new support near $0.67. Watch for bearish signals around the resistance. Stay cautious at resistance levels and manage risks accordingly. Happy trading!
Crypto_Ikigai
SUN/USDT 4H Chart Analysis
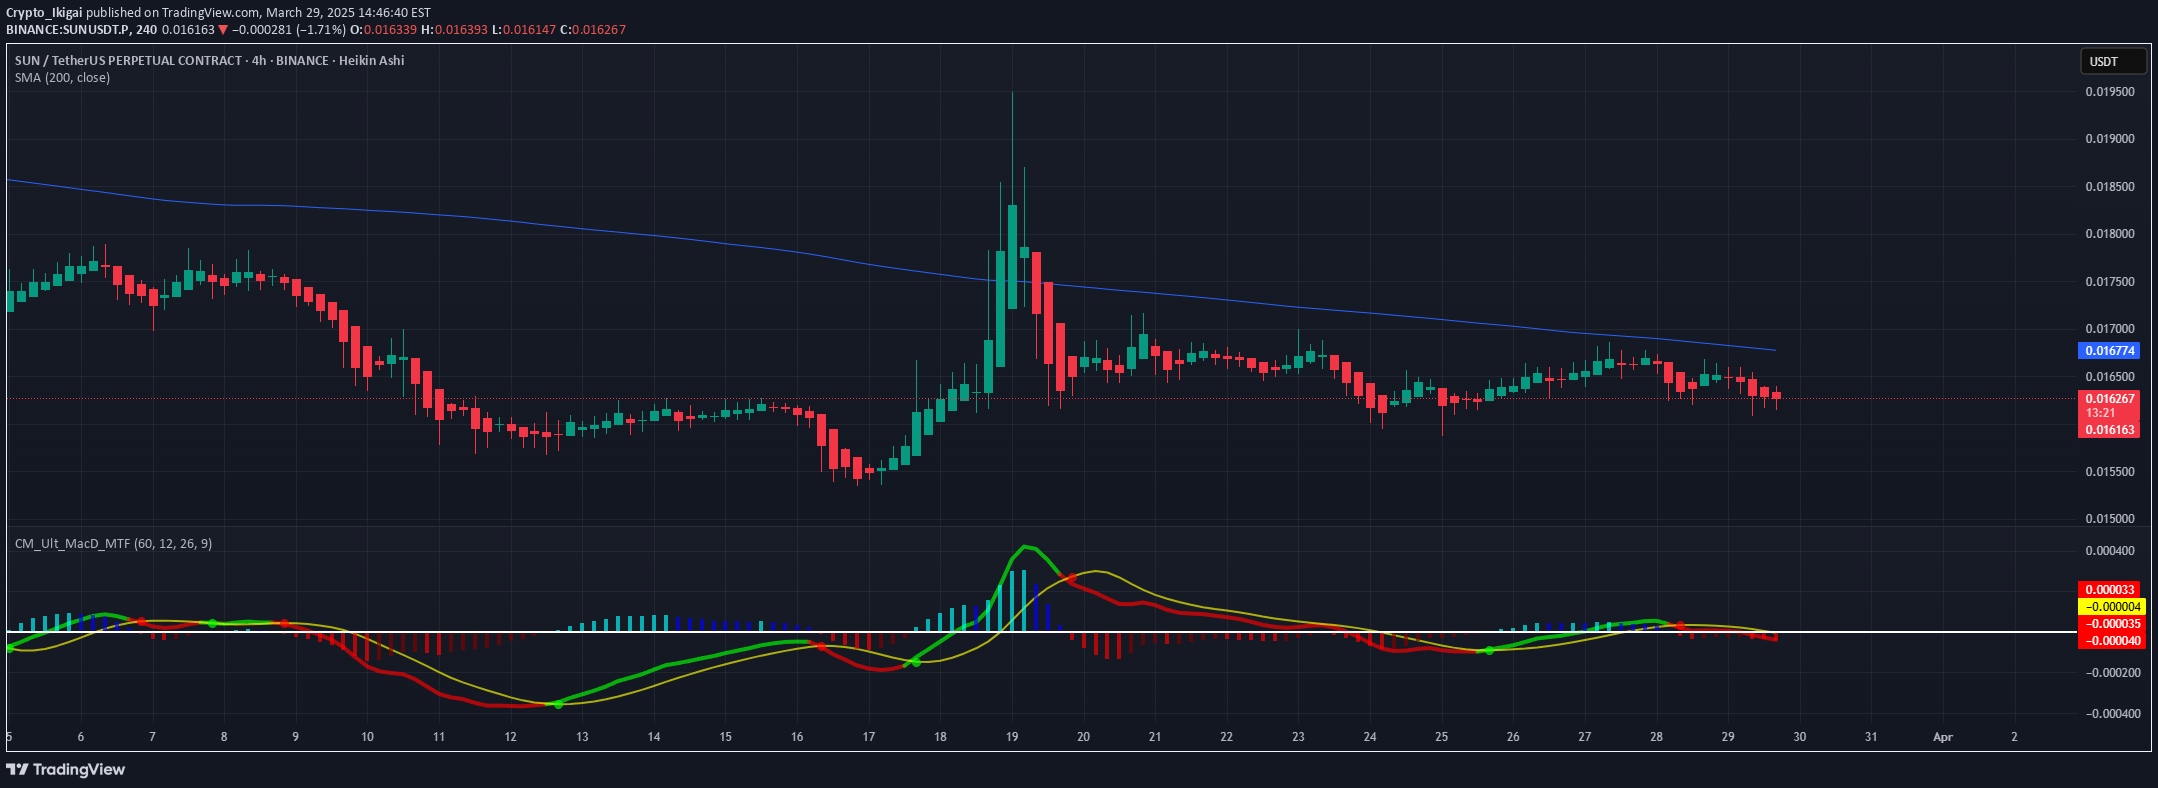
Currently observing SUN/USDT on the 4-hour timeframe with Heikin Ashi candles: 1️⃣ Price Action & Trend The price remains below the 200-period SMA, currently acting as a dynamic resistance at approximately 0.01677 USDT. Clear short-term bearish trend structure, with lower highs visible since the recent spike. The recent price action indicates consolidation, but bearish momentum persists. 2️⃣ Key Levels: Resistance: Immediate resistance around the 200 SMA (0.01677). Any break above this line could trigger bullish momentum. Support: Local support established near 0.01615. A breach below could signal further bearish continuation towards 0.01550. 3️⃣ Indicators: MACD (Ultimate MTF) shows negative momentum with MACD lines below the zero-line, indicating ongoing bearish sentiment. Histogram bars remain negative, underscoring the bears' control over the current market condition. 📌 Trading Idea: Short Scenario: If the price rejects clearly from the 200 SMA, consider short positions targeting 0.01615 and potentially 0.01550. Long Scenario: Wait for a confirmed breakout and retest above the 200 SMA (0.01677) for bullish confirmations, targeting upwards towards 0.01750 initially. ⚠️ Recommendation: Maintain tight stop-losses around key levels, especially given the potential for volatility in the current consolidation phase. 👉 Conclusion: Currently leaning bearish with cautious optimism if resistance at the 200 SMA is overcome. Monitor closely for decisive price action to determine direction. 💬 Let me know your thoughts below! Like & follow for more updates! 🚀📈
Crypto_Ikigai
Potential Breakout in ETH/USD Amid Sideways Market and ETF News

Chart Description: Over the past 48 4-hour candles, ETH/USD has been oscillating within a tight range, suggesting a sideways market condition. The resistance zone around $3490-$3500 has been tested multiple times without a decisive breakout. However, the landscape is subtly changing post-ETF news, which hasn't yet significantly moved the market, potentially due to the overhanging impact from the Mt. Gox sell-off. Technical Analysis: Sideways Trend: The consolidation observed in the last 192 hours indicates uncertainty but also builds potential energy for a significant price move. Resistance Test: The $3490-$3500 level is critical, having acted as a strong barrier on multiple attempts. A clear break above this level could shift the market sentiment. Impact of ETF News: Despite the ETF news not triggering an immediate bullish response, the market appears to be digesting the implications slowly. This latent reaction might be due to the large-scale sell-offs linked to historical factors like Mt. Gox, clouding immediate bullish cues. Potential Breakout Targets: Should ETH move above $3500 decisively, the next resistance lies at the $3550-$3600 range. Overcoming this could pave the way for a sharp rally towards $4000, where significant sell orders are anticipated. Market Sentiment: The market is relatively calm, providing a potential setup for a bullish breakout if it responds positively to the accumulated cues. However, traders should watch for volume increases as a confirmation of breakout strength. Strategy: Entry Point: Look for a sustained breakout above $3500 with high trading volume as a confirmation. Stop Loss: Set a stop loss just below $3490 to minimize exposure to a false breakout. Take Profit Levels: Initial targets at $3550-$3600, followed by a potential run towards $4000 if momentum sustains. Conclusion: The ETH/USD pair shows potential for an upward movement if it can sustain a breakout above the immediate resistance. With the market's slow reaction to ETF news and recent sell-offs factored in, any move above $3500 could trigger a stronger bullish phase towards the $4000 mark. Keep an eye on market volume and sentiment shifts as these will be key to confirming the expected trend.
Crypto_Ikigai
Kaspa to the moon?
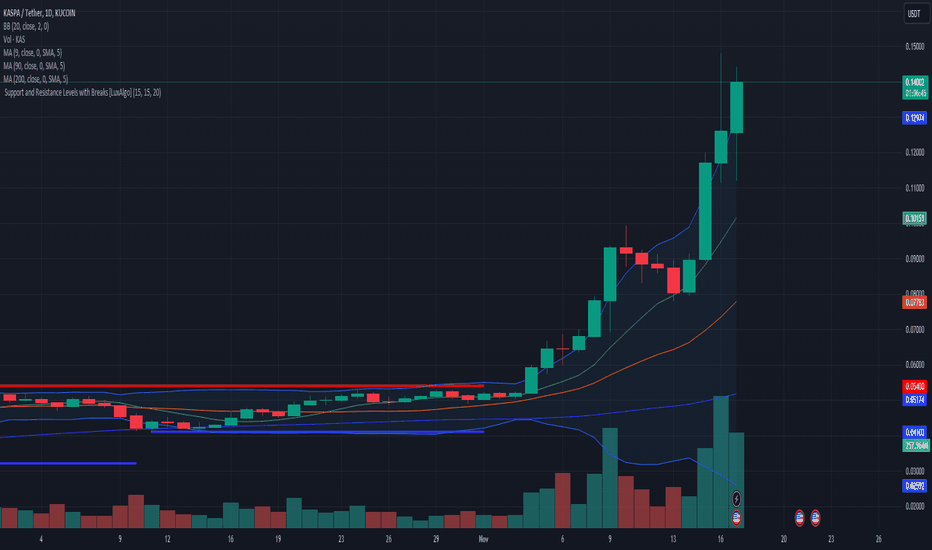
KASPA ( KAS ) has recently shown signs of consolidation, setting the stage for a potential bullish surge. With a strong foundation and several fundamental catalysts in play, KASPA appears poised to ascend to new heights in the crypto sphere. Technical Analysis: Consolidation and Accumulation: KASPA has undergone a period of consolidation, forming a strong support level around [0.05]. This accumulation phase suggests a possible impending breakout. Bullish Indicators: Multiple technical indicators, such as the MA, are signaling a bullish momentum gaining traction. Volume Surge: Noticeable spikes in trading volume during the consolidation phase indicate increased interest and potential accumulation by investors. Fundamental Catalysts: Unique Technology: KASPA distinguishes itself with its innovative technology [Kaspa is the fastest, open-source, decentralized & fully scalable Layer-1 in the world. The world’s first blockDAG – a digital ledger enabling parallel blocks and instant transaction confirmation – built on a robust proof-of-work engine with rapid single-second block intervals.]. Market Expansion: Plans for expanding into new markets or regions, along with increased community engagement, could drive further demand. Price Target and Strategy: Given the technical setup and fundamental strength, a price target of 0.5 within the 6 months seems achievable. Traders might consider accumulating KASPA on dips near the support levels for a potential breakout trade. Risks to Consider: Market Volatility: Cryptocurrency markets are highly volatile, and price movements can be unpredictable. Regulatory Changes: Regulatory developments or changes could impact the crypto market sentiment. Competitive Landscape: Competition within the crypto space may affect KASPA's growth trajectory. Conclusion: KASPA ( KAS ) is positioned for a significant move upwards based on its technical setup and robust fundamentals. Traders eyeing a potential rally should closely monitor the price action, considering both technical indicators and upcoming fundamental developments.
Crypto_Ikigai
Could Bitcoin free fall continue?

We are at the last day of November and the monthly candle looks strong red, we are about to see the breakout from the support at $17 650 and the free fall will continue.
Disclaimer
Any content and materials included in Sahmeto's website and official communication channels are a compilation of personal opinions and analyses and are not binding. They do not constitute any recommendation for buying, selling, entering or exiting the stock market and cryptocurrency market. Also, all news and analyses included in the website and channels are merely republished information from official and unofficial domestic and foreign sources, and it is obvious that users of the said content are responsible for following up and ensuring the authenticity and accuracy of the materials. Therefore, while disclaiming responsibility, it is declared that the responsibility for any decision-making, action, and potential profit and loss in the capital market and cryptocurrency market lies with the trader.