
CryptoWizard_
@t_CryptoWizard_
What symbols does the trader recommend buying?
Purchase History
پیام های تریدر
Filter

CryptoWizard_
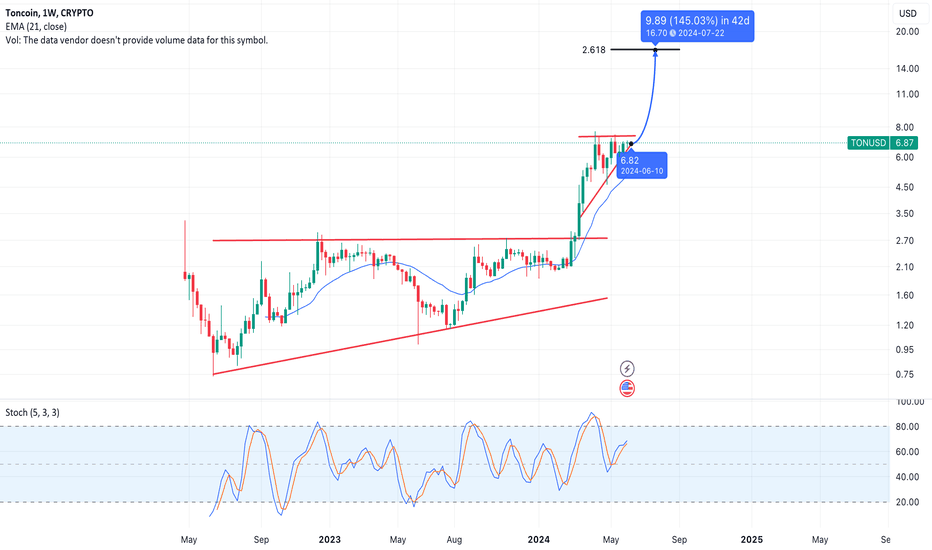
Based on this analysis, Toncoin shows significant bullish potential in the short to medium term . The current price of Toncoin is $6.90. The chart shows that the price is predicted to rise to $16.70 in 42 days, giving an upside of 145.03%. Support & Resistance - There is seen strong support around $5.03 (EMA 21). - The resistance level is located around $7.04, which was recently tested and may be broken if the bullish trend continues. Price Pattern: An ascending Triangle pattern is visible, which usually indicates a potential bullish breakout. This pattern has been confirmed with an upward breakout. Technical Indicators: The stochastic indicator shows 69.10 (K%) and 66.35 (D%), which shows that Toncoin is approaching the overbought zone but not yet oversaturated, so there is still room for further increases. Fibonacci Extensions: The $16.70 price target is based on the 2.618 Fibonacci extension level, which is often used to project post-breakout price potential.

CryptoWizard_
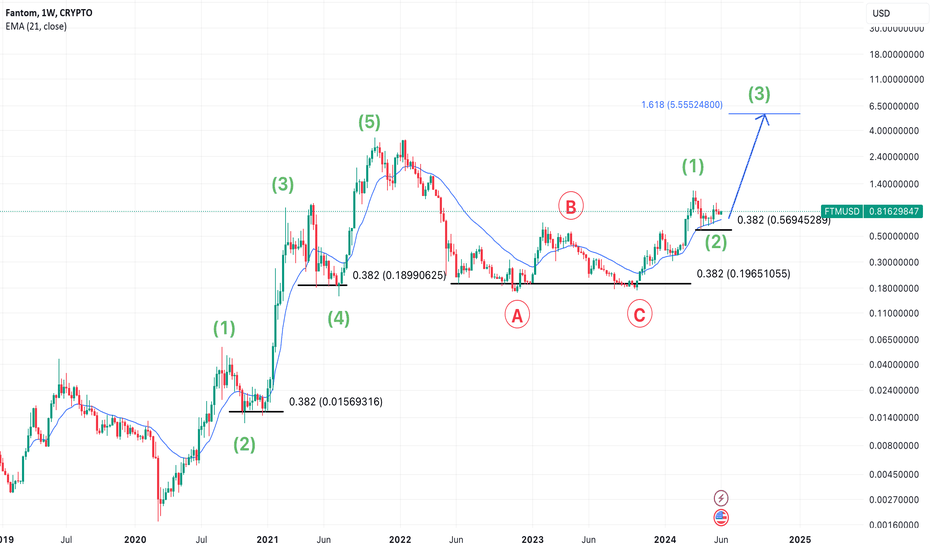
Elliott Wave Pattern: The chart shows a complete Elliott Wave pattern with the sequence 1-2-3-4-5 followed by an ABC correction. Currently, FTM is in the initial phase of the third wave of the new cycle, which signals the potential for significant upside ahead. Fibonacci Retracement Level: FTM has tested the 0.382 Fibonacci retracement level several times as strong support. This provides an indication that the price is likely to respect this technical level, which is usually a positive sign for potential further upside. Moving Average: The 21-week Exponential Moving Average (EMA) shows an uptrend. When price is above this EMA, it usually indicates bullish momentum. Price Target: The price target projection using Fibonacci extensions suggests that the price could reach around $5.55 in the anticipated wave 3 phase. This provides interesting upside potential from the current level of around $0.82. Sentiment and Fundamental Analysis: Based on the latest analysis and predictions, the Fantom project has growth potential supported by the adoption of new technologies and collaborations in the DeFi and dApps ecosystem.

CryptoWizard_
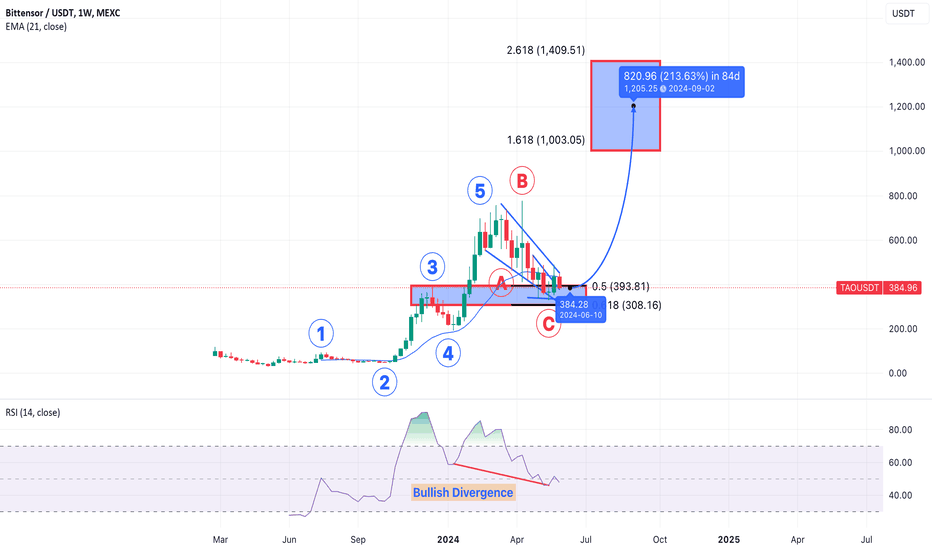
Elliot Wave Pattern: The chart shows an Elliot Wave pattern in which waves 1, 2, 3, 4, and 5 are identified. Currently, the price is in the corrective area of wave C. This implies that the correction may be nearing its end and a potential reversal towards the next impulsive wave may occur. The next rally will be the very impulsive based because we are in major wave 3. Fibonacci Retracement: The price is currently around the 0.618 (approx. $308.16) and 0.5 (approx. $393.81) Fibonacci retracement levels. This level is often considered a strong support level in technical analysis. If the price manages to stay above this level, a significant upward movement is likely. Bullish Divergence on RSI: The RSI (Relative Strength Index) indicator shows a bullish divergence, which means that even though prices are falling, purchasing power is starting to increase. This is often a signal that the price will reverse upwards. Price targets: Potential price targets based on Fibonacci extensions are approximately $1,003.05 (1.618) and $1,409.51 (2.618). This indicates the potential for a large increase from the current price if a reversal occurs. EMA (Exponential Moving Average): The price is currently below the 21-day EMA, which serves as dynamic resistance. A break above this EMA will provide additional confirmation that an uptrend is underway. Taking into account the factors above, TAO/Bittensor has the potential to experience a significant increase if the price manages to stay above the critical support level and there is confirmation of the bullish divergence on the RSI.

CryptoWizard_
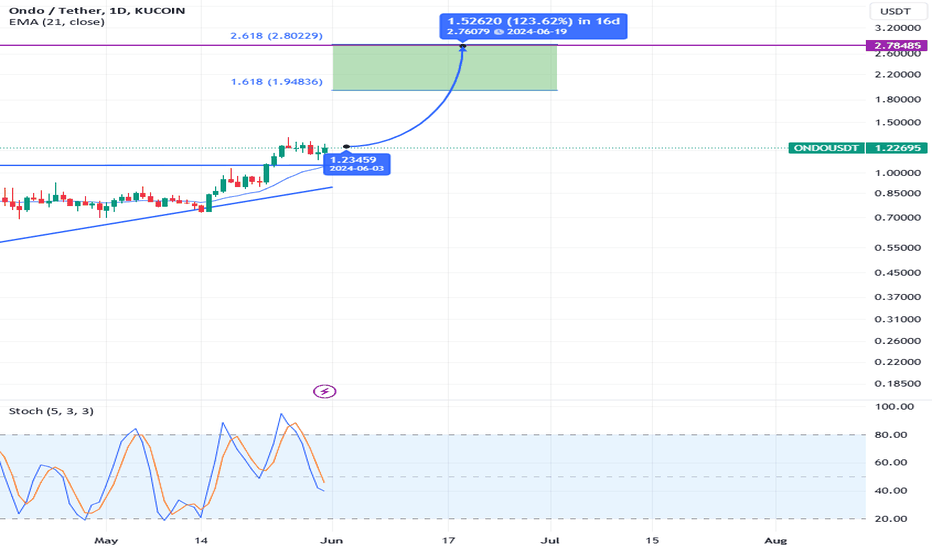
Price Action The main trend shows a significant rise from a low of around $0.35 to reach over $1.20, with the price currently hovering around $1.24. The next major resistance based on the Fibonacci Extension is around $1.95 (1.618) and $2.80 (2.618). The price formed an ascending triangle pattern before breaking out upwards, indicating bullish strength. The pattern is supported by the dynamic support line of the trendline and breakout at around $1.23. Indicator - The price is above the 21 EMA, indicating strong short-term bullish momentum. The 21 EMA also acts as additional dynamic support, currently located around $1.05. - Stochastic RSI is at a medium level, neither overbought nor oversold, which indicates that there is still room for further increases before a potential correction. Price Target Using Fibonacci Extension, the next upside targets are at level 1,618 (around $1.95) and level 2,618 (around $2.80). These targets are based on previous movements measured from the last breakout of ascending triangle. Overall market sentiment is bullish with prices consistently making higher highs and higher lows, indicating investor confidence in price moves higher. In conclusion, the Ondo chart shows strong bullish potential.

CryptoWizard_
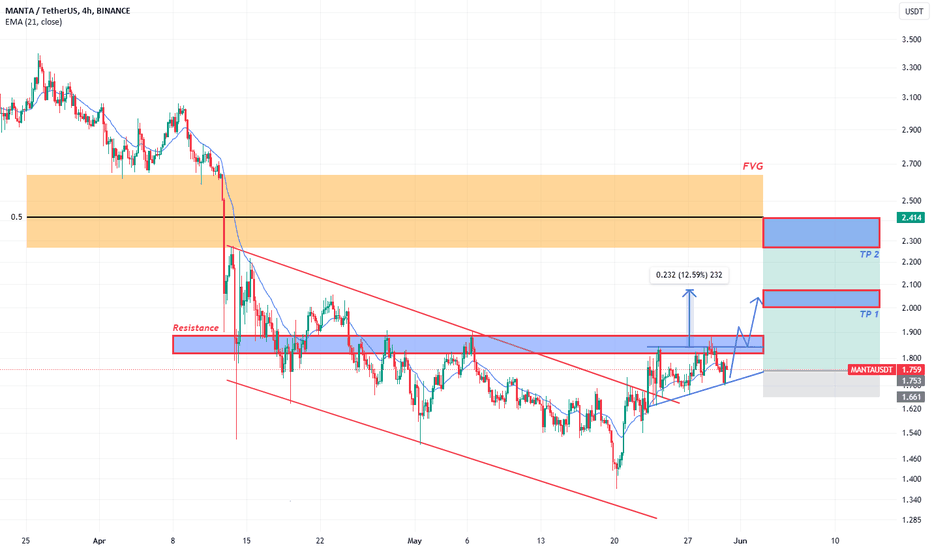
The main trend shows a sharp decline from a high of around $3.50 to a low of around $1.40 before the price begins to consolidate and a new pattern forms. There is a strong resistance area around $1.78 to $1.90 (blue area). Price has tried to break this level several times but is still stuck. Price Movement : Falling Wedge: There is a falling wedge pattern that has broken upwards, which is generally considered a bullish pattern. This pattern provides an indication that the price has the potential to rise further. Right now, Manta has succesful breakout of falling wedge and forming ascending triangle as a continuation pattern. The price is around the EMA 21, which indicates consolidation and potential further directional movement. There appears to be a Fair Value Gap (FVG) in the area of around $2.00 to $2.40. If the price manages to break through the current resistance, the next target will likely be to fill this gap. Profit Target TP 1: Around $2.10, based on measurements from the falling wedge breakout TP 2: Around $2.40, the upper area of the Fair Value Gap (FVG). Stop Loss: Around $1.66 or slightly below the 21 EMA to reduce risk, around $1.65

CryptoWizard_
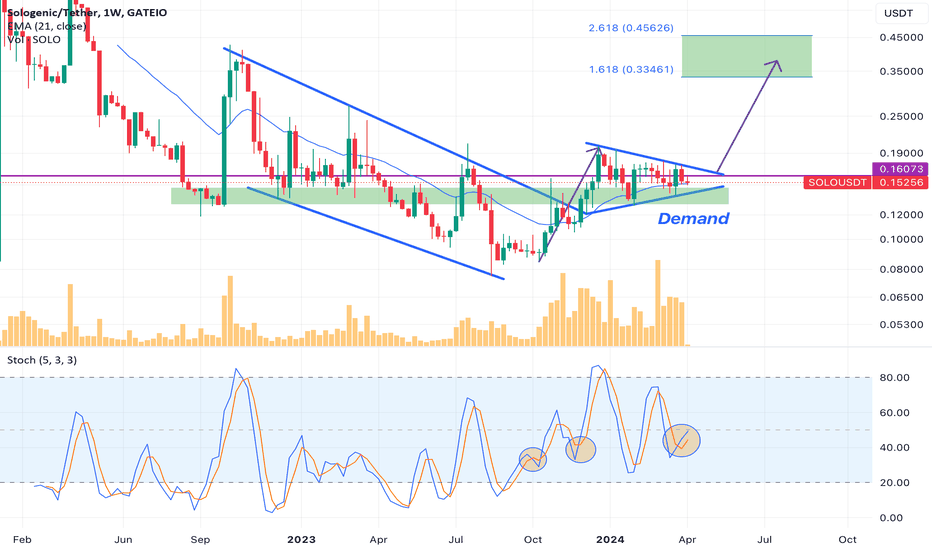
Sologenic is an ecosystem built on top of the XRP ledger network utilizing the on-demand tokenization of assets from traditional financial markets. Q2 is the best time to trade RWA Crypto, because of Larry Fink Ceo of Blackrock that focusing on tokenization real world assets. Many RWA Crypto has already pumped way more that 100% in just a week. What's next? Sologenic is a real world assets + cbcd crypto that has not pumped yet. Sologenic has already breakout from descending channel and right now we are in a bullish continuation pattern (Bull Pennant). From the Stoch, we can see that the momentum is crossing up, the volume spikes and it seems ready to take off! If you want to buy, place entry on the demand zone with stop losses slighty bellow the demand. And for reminder, use risk management & don't go all in. Goodluck! Recap : - Bullish Fundamental - Bullish Chart Pattern - Bullish Indicator Follow me for more deep crypto outlook!

CryptoWizard_
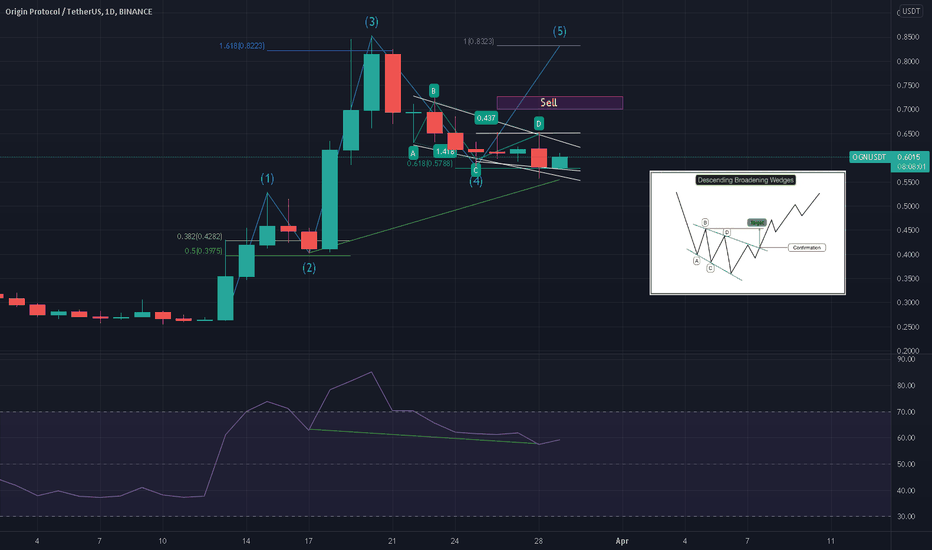
So last time the ascending triangle pattern has been broken. I Tried to find new opportunity and we are in two pattern, right angle broadening wedge and descending broadening wedge. This is a reversal pattern, you can browser it and find it. This is a good chance to happen because we are in corrective phase, and some other proof that this will happen is that there is RSI Bullish Divergence in 1-day timeframe. So the first target if we break out to the top from this pattern will be around 0.7- 0.72 then our wave 5 target. Good luck!!

CryptoWizard_
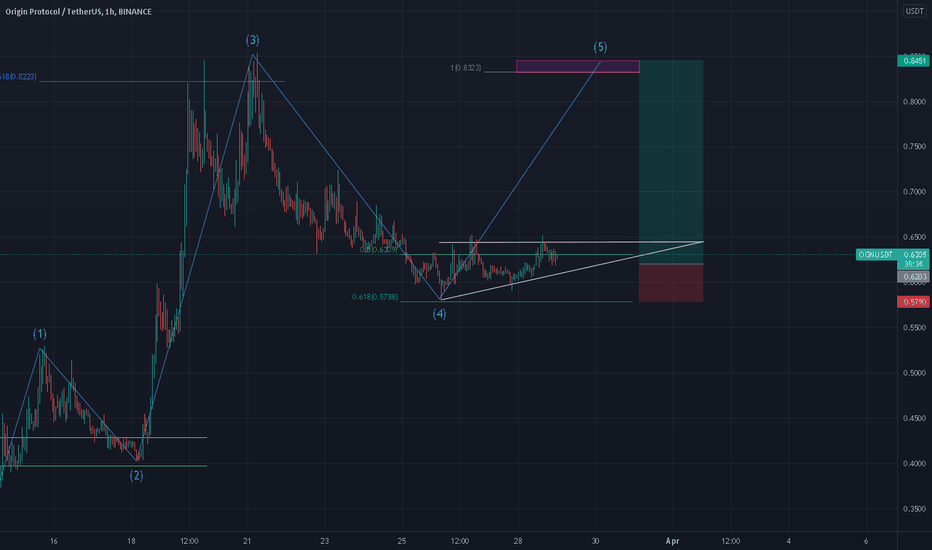
As you can see, the Origin protocol is currently in a bullish trend . According to the Eliote wave count, it is currently in the 4th wave which is the corrective phase. I believe this is the best entry point because it is an accumulation area before the take off. In the corrective phase we are sideways forming an ascending triangle pattern, breakout from here will confirm the continuation of wave 5. Risk and reward ratio is really good, so i think is a big opportunity to make decent gains, Good Luck
Disclaimer
Any content and materials included in Sahmeto's website and official communication channels are a compilation of personal opinions and analyses and are not binding. They do not constitute any recommendation for buying, selling, entering or exiting the stock market and cryptocurrency market. Also, all news and analyses included in the website and channels are merely republished information from official and unofficial domestic and foreign sources, and it is obvious that users of the said content are responsible for following up and ensuring the authenticity and accuracy of the materials. Therefore, while disclaiming responsibility, it is declared that the responsibility for any decision-making, action, and potential profit and loss in the capital market and cryptocurrency market lies with the trader.