
CryptoVision
@t_CryptoVision

What symbols does the trader recommend buying?
Purchase History
پیام های تریدر
Filter
CryptoVision
انضباط آهنین در ترید؛ راز کسب سود ثابت از ارز دیجیتال TON (تجربه ترید 4 ساعته)

I trade 4H on Binance, relying on liquidity levels, trend context, and strict risk control. On October 30 I executed a short from 2.1832. Entry on the next candle, TP map prepared in advance, capital allocated to just two take-profit levels. Closed TP2 the same day, netted about 2.5 percent with 2x leverage. Clean supply zone with a follow-through impulse down, no noise or forced re-entries, stop placed where the scenario loses validity. On November 7 I worked a long from 2.0999. Same logic, next-candle entry, two-tier profit taking, no risk bloat. A retest of the control zone confirmed continuation, TP2 hit sequentially, around 2.5 percent with 1.5x leverage. The structure behaved by the book impulse pullback retest continuation which kept the pace steady and emotions out. On November 13 I took a trade from 1.9892. Mapped take-profits up to TP4, stops placed across the board, risk tightened. The coin traded nervier, volatility choppy, liquidity occasionally thin. I stuck to the plan with no improvisation and no averaging against the move. Order distribution was calibrated, exits followed the map, leverage control prevented overload. The key takeaway is straightforward. On TONUSDT.P 4H the rhythm is readable if you respect levels, take profits per plan, and keep discipline. Analytics first, position management mandatory, emotions sidelined. This methodical approach extracts movement consistently even in a tricky market.
CryptoVision
ترید دقیق و سودآور POPCAT: راز معاملات موفق در ارز دیجیتال

Working the 4H on Binance, this coin behaved textbook. On November 3, after a thorough read of liquidity levels and supply zones, I took a short from 0.1373 with entry on the next candle as per plan. Mapped four take-profit levels, laddered the deposit, kept risk under control. All four targets were hit within the day, totaling about 6.5 percent with 4x leverage. On November 7, I got confirmation of a reversal scenario and went long from 0.1303, again with entry on the next candle. Same rules, same levels, same stop-losses. All four targets closed sequentially, netting around 6 percent thanks to a well-structured TP ladder. The chart printed by the book: impulse, partial scaling out, pullback into the control zone, and continuation in my direction. After this quality of execution, the coin is on my shortlist for further trades. On November 13, I worked another trade starting at 0.1324. TPs were set up to TP3, kept greed in check, stops tight. The market extended and the position ultimately closed through TP4. I preemptively de-risked and stayed within risk management. POPCATUSDT.P on the 4H gives a readable rhythm if you respect levels and don’t trade on emotion.
CryptoVision
استراتژی مخفی من در ترید XRPUSDT: چگونه با انضباط 6% سود خالص گرفتم؟
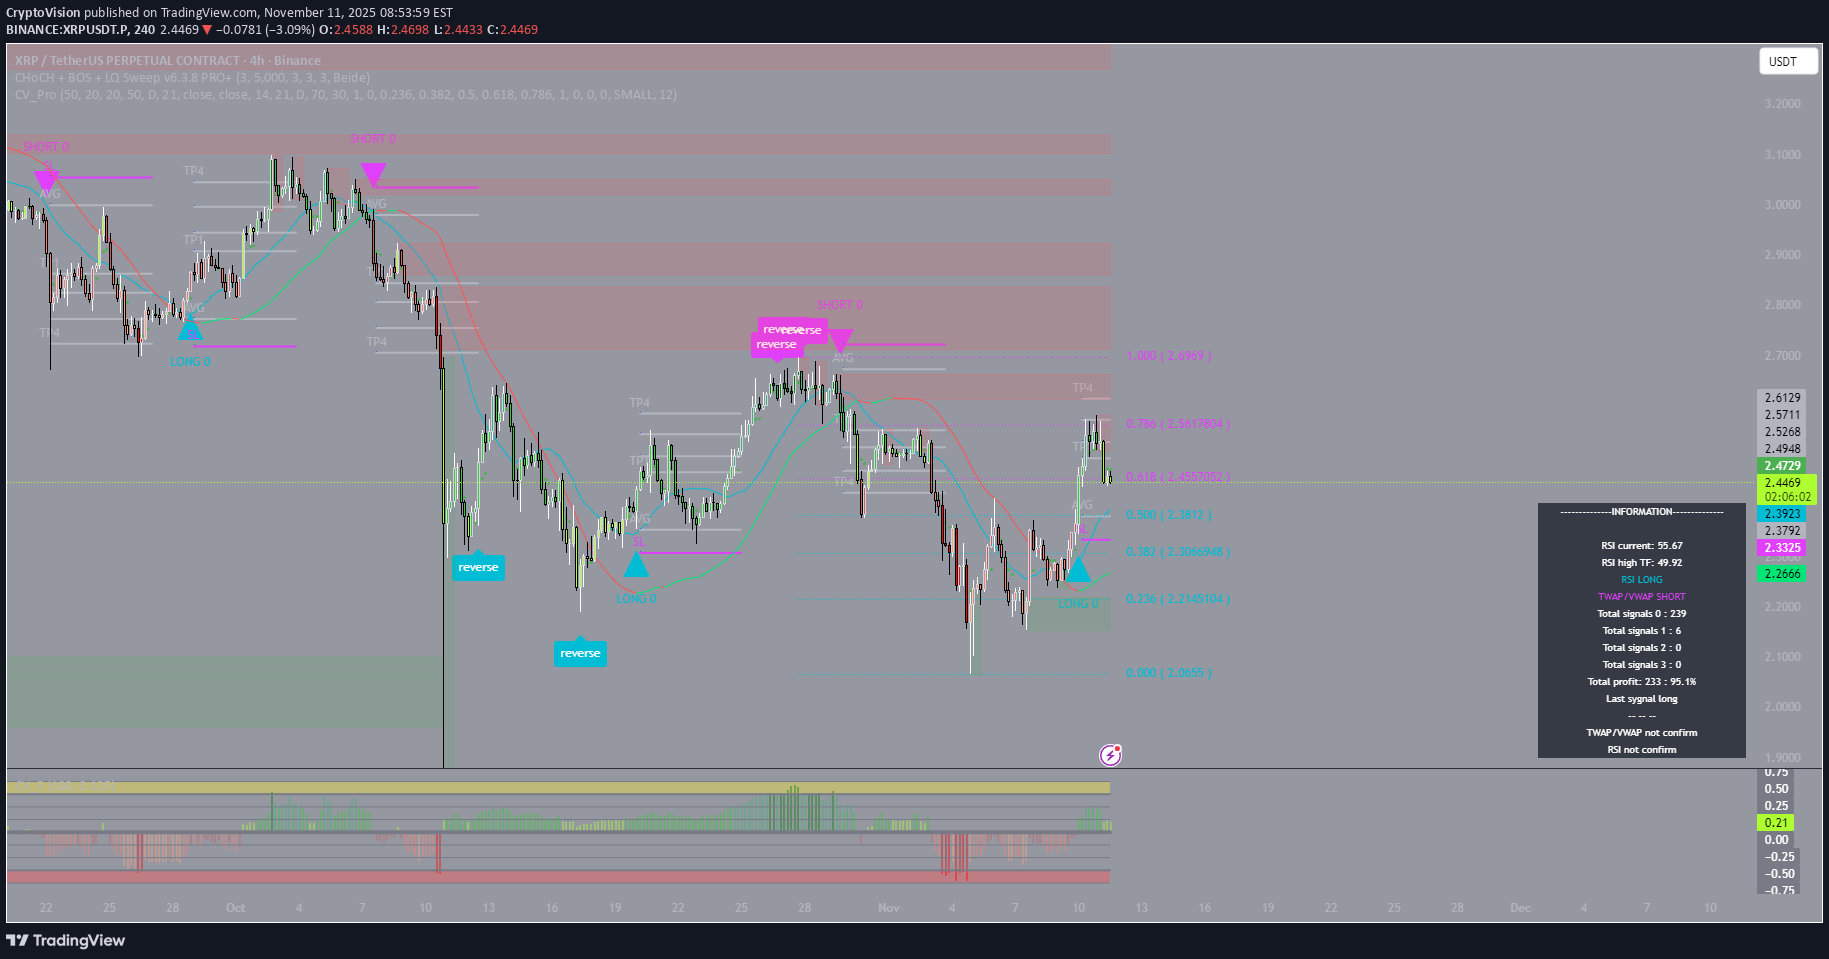
Here is how my discipline performed on the 4H chart. On October 20, after clear analysis and visualization of key levels, I took a long decision at 2.4335 and entered on the next candle without haste strictly by plan. Then came meticulous execution: I mapped four take profit levels, allocated the deposit across the steps, and kept risk under control. No improvisation: only predefined rules and a secret proprietary strategy that structures entry and exit points and sets clear position management boundaries. The result over a few days all four TPs were hit. In total I captured about 6% with 3x leverage. What matters is that I did not chase the perfect top I took what the market offered at my levels. The chart validated the scenario: impulse partial profit taking reset in the consolidation zone and then continuation in my direction. Yes those who hesitated or jumped in mid move watched missed gains. That is the cost of chaos. On my side were level visualization precise timing of entry on the next candle and disciplined execution. The outcome is a predictable process and steady realization of the move’s potential without chasing or drama.
CryptoVision
اهمیت انضباط در معامله: درسهایی از یک سود و یک ضرر در بیت کوین

On October 21 I received a long scenario but the move turned out to be false as the market reversed and the stop loss was triggered. Moments like this remind me that discipline is more important than emotion. This is why I always place a protective order even when I am confident in the direction. Losing a limited amount is far better than destroying a deposit. Then on October 30 a new opportunity appeared a short from the 107686.2 level. I entered on the next candle after confirmation and gradually closed all four profit targets. As a result I gained around 6 percent. The secret proprietary strategy clearly highlighted the reversal zone and the market followed the plan precisely. Systematic trading is not about chasing every impulse. It is about following rules where every action is backed by analysis. The key is maintaining structure controlling emotions and having clear visual levels. That is what makes trading predictable and safe.
CryptoVision
تحلیل دقیق اتریوم: چگونه با استراتژی مخفی، 5% سود قطعی کسب شد؟
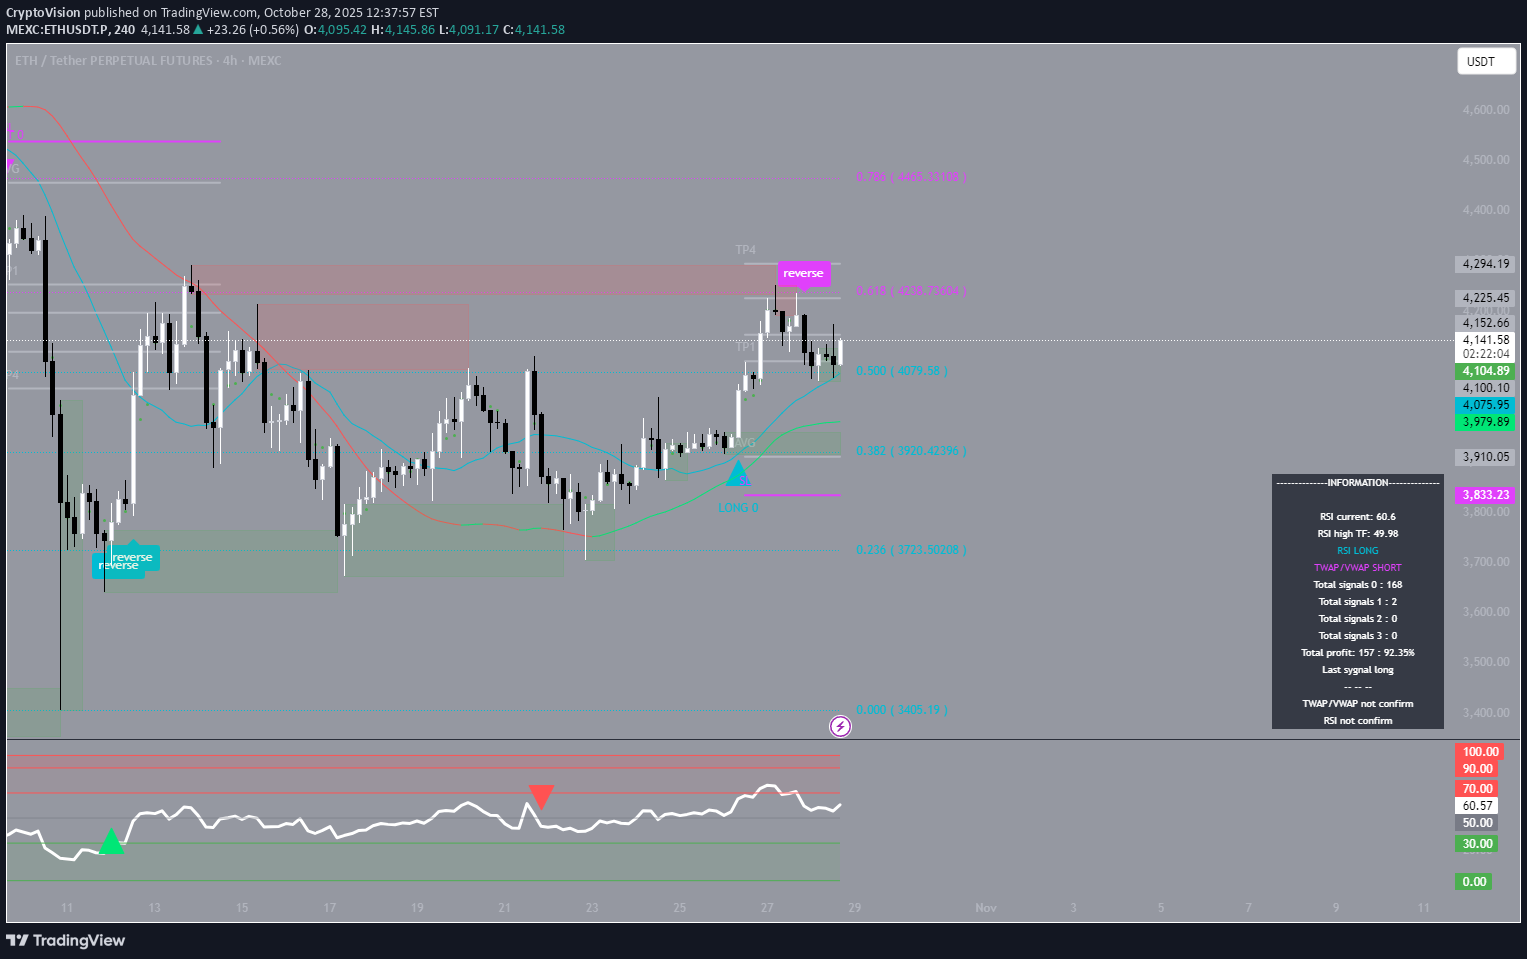
On October 26, Ethereum showed a clear upward movement on the 4-hour chart from the 4043.78 level. I entered on the next candle after confirmation and gradually closed positions at three profit-taking levels. I distributed the deposit across these zones and collected around 5 percent profit with 1.5x leverage. The key is not greed but structure. Thanks to a secret proprietary strategy, it was possible to clearly see the levels and avoid emotional reactions. Many traders at that moment tried to chase the market, entering too late, but precise calculations and visualized levels allowed me to act calmly and without haste. I often notice that even experienced traders make mistakes by ignoring their plan and technical references. But discipline is what separates chaotic trading from a system. Each level was predetermined, and the price moved exactly according to the calculations.
CryptoVision
رشد انفجاری BNB: راز استراتژی محرمانه که نوسانات بازار را شکست داد!
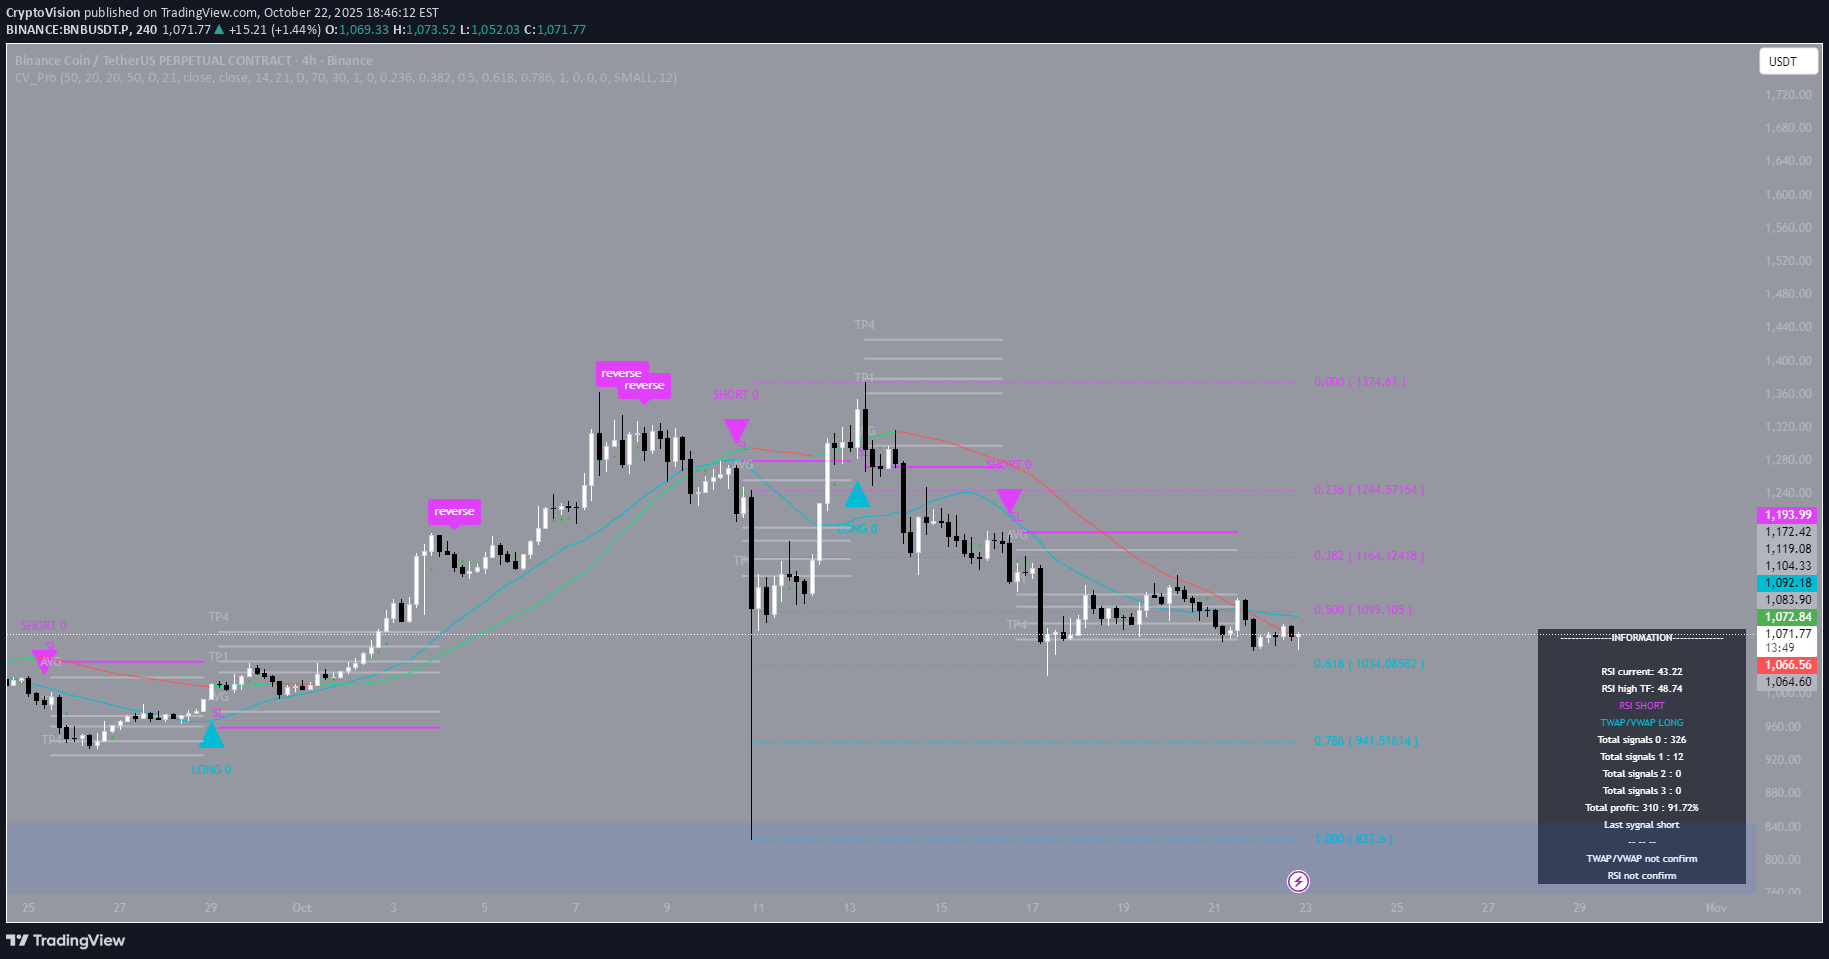
On October 10, I watched the BNB 4-hour chart carefully. The market looked unstable, so I decided not to open a position, waiting for confirmation. That choice turned out to be right — a strong drop followed soon after, but previous take-profit levels had already been hit, which protected my balance. On October 13, I entered on the next candle and closed the first target, taking about 2 percent profit without leverage. Nothing spectacular, but it was more about patience and discipline than chasing big moves. Then, on October 16, the setup repeated itself, but this time the momentum was stronger. All four targets were reached in sequence, giving me roughly 10 percent profit using 2x leverage. I applied my secret custom strategy that helps analyze market structure without emotions. The indicator clearly highlighted fixation zones and confirmed trend stability. There are thousands of financial indicators on TradingView, but only a few can stay objective during turbulence. That objectivity becomes the true advantage when the market tests every trader’s discipline.
CryptoVision
ثبات در آشوب سولانا: راز موفقیت با استراتژی سیستمی (حتی در ریزش بازار)
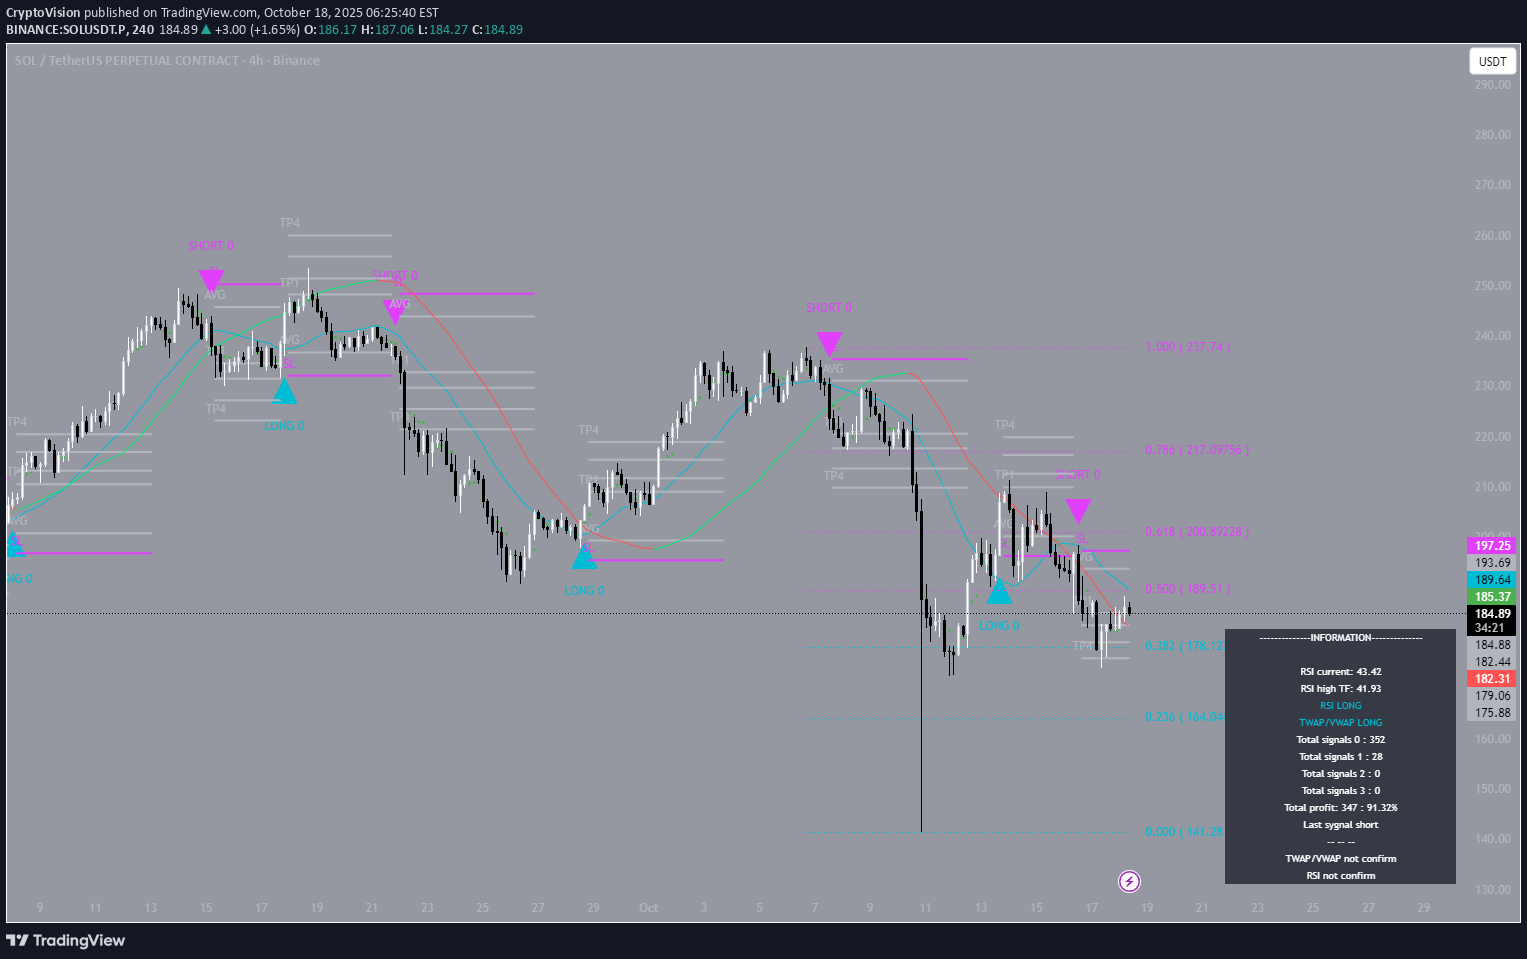
Since October 7, the Solana market has been in turbulence, with drawdowns, sharp reversals, and liquidity spikes. But it’s in periods like these that a systematic approach proves its strength. I opened the first entry on October 7 and closed it at the second take-profit level with modest 1.5x leverage. Then came a pause, and on October 13 I entered again without leverage, cautiously, locking in about 1.5% profit. It was already clear the strategy works even in a turbulent phase. When the next move began on October 16, I followed my proprietary system. The trade unfolded cleanly along the structure: four consecutive take-profit levels, about 7% profit with 2x leverage. Discipline and visual control of levels is what prevented losses. On TradingView, over 90% of successful traders use multiple indicators at the same time, but the key is always the same: the ability to spot patterns and ignore noise. This systematization makes trading deliberate rather than an emotional chase.
CryptoVision
بیت کوین آماده جهش: نشانههای پنهان بازگشت قیمت BTC
After the massive sell-off on October 10, when Bitcoin dropped, the market is gradually catching its breath. The structure is shifting — sellers’ momentum is fading, and pressure at lower levels is becoming less aggressive. My system hasn’t given a confirmed entry yet, but the groundwork for a possible upward bounce is forming. It’s interesting to see multiple indicators align — volatility is easing, RSI is exiting oversold territory, and buy volume is picking up on local dips. All of this suggests that larger players are beginning to accumulate positions in anticipation of a potential recovery. Experience teaches that markets don’t reverse out of the blue — structure forms first. And when the analytical system spots the early signs of an impulse shift, it’s important not to rush but to wait for confirmation. I prefer to hold off until the technical picture fully aligns with the strategy’s logic. Patience and discipline are what separate a trader from a gambler.
CryptoVision
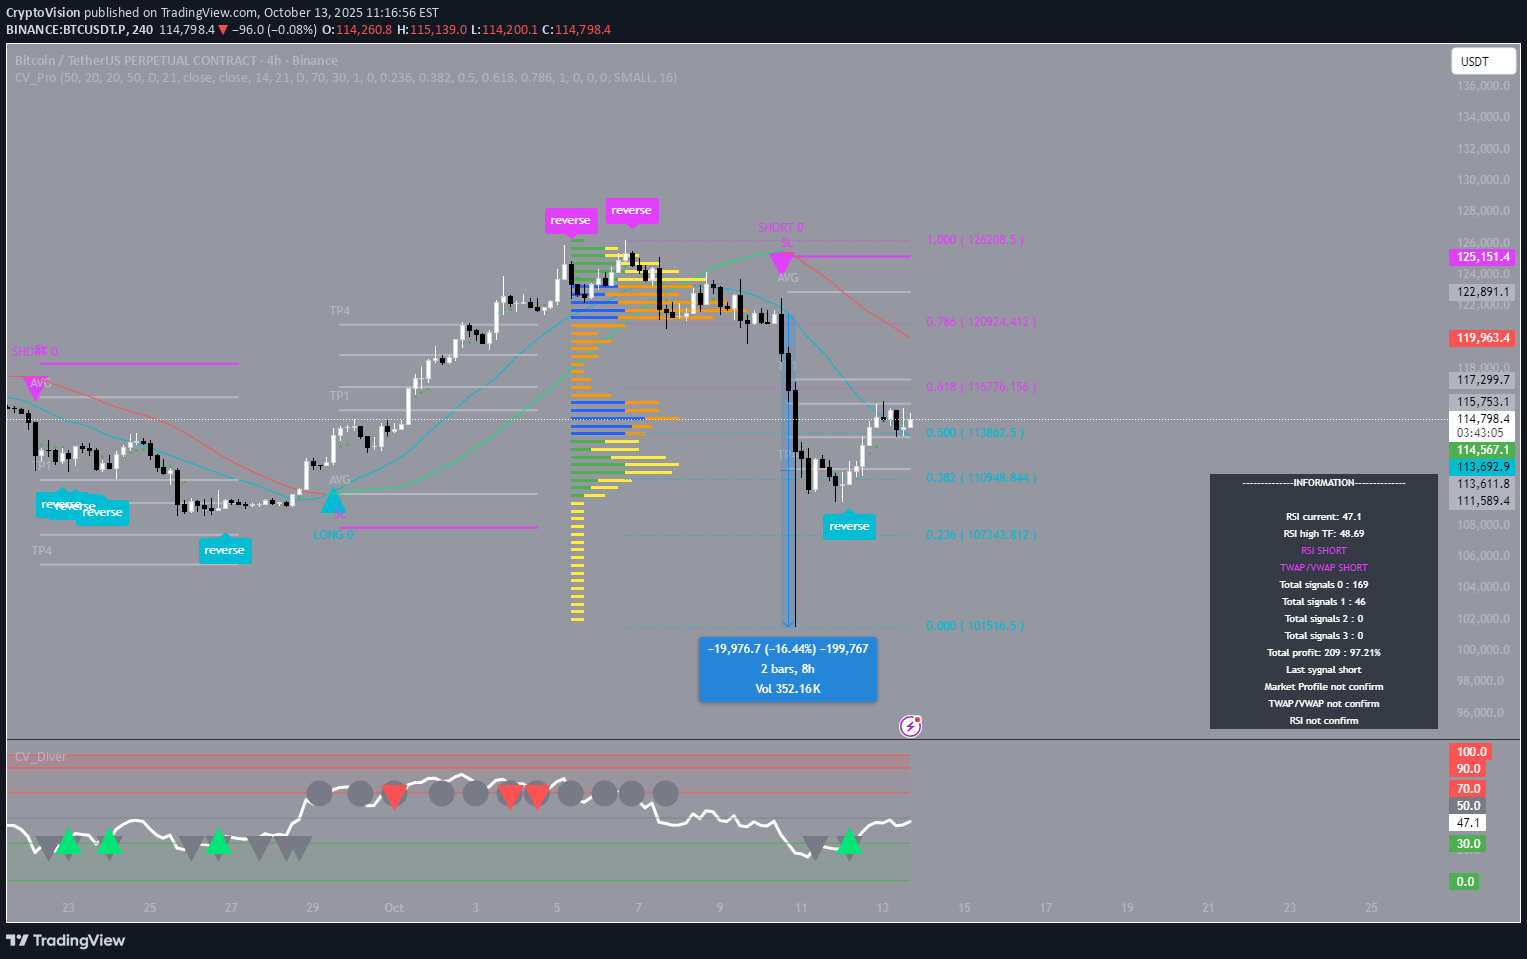
بیت کوین در آستانه بازگشت؟ درسهایی از سقوط ۲۰ میلیارد دلاری اخیر

On October 10, the Bitcoin market entered its most turbulent phase in months — price plunged from $118,994.5 to $101,505.3, and total liquidations exceeded $20 billion. I didn’t take a position, just watched, because even before the drop the structure looked suspect: the impulse was overheated and the indicator clearly highlighted a risk zone. It was a tough day for many traders. The wave of liquidations wiped out accounts even for seasoned participants — a reminder of how crucial it is to stay human and keep your composure. What happened underscored once again: strength isn’t in trying to predict the market, but in reading its signals and recognizing structure ahead of time. Analytics and discipline are the only things that help you weather such storms without panic. My proprietary strategy reaffirmed that, and I’m grateful for it. Wishing everyone successful trading.
CryptoVision
رشد انفجاری بیت کوین: معاملهگران منظم چطور ۸۶۰۰ دلار سود کردند؟

On September 29, Bitcoin initiated a confident upward move from $113,705.5 on the 4-hour chart. The price traversed all four partial-take stages and reached $122,358.9 — nearly $8,600 per coin. Trading with 10x leverage made the move notably dynamic. I followed my proprietary strategy. When the structure is clear, the market becomes much calmer. From here, there is a nontrivial probability of a pullback; it makes sense to prepare for a potential bearish signal. Net effect: the upside potential was substantial — and those who acted systematically could capture the bulk of the move. Moments like these highlight the importance of analytics and discipline. In markets, winners aren’t guessers; they are traders who execute a plan.
Disclaimer
Any content and materials included in Sahmeto's website and official communication channels are a compilation of personal opinions and analyses and are not binding. They do not constitute any recommendation for buying, selling, entering or exiting the stock market and cryptocurrency market. Also, all news and analyses included in the website and channels are merely republished information from official and unofficial domestic and foreign sources, and it is obvious that users of the said content are responsible for following up and ensuring the authenticity and accuracy of the materials. Therefore, while disclaiming responsibility, it is declared that the responsibility for any decision-making, action, and potential profit and loss in the capital market and cryptocurrency market lies with the trader.