
CryptoSeaTV
@t_CryptoSeaTV

What symbols does the trader recommend buying?
Purchase History
پیام های تریدر
Filter
CryptoSeaTV
Ascending Triangle Points to Bullish Continuation
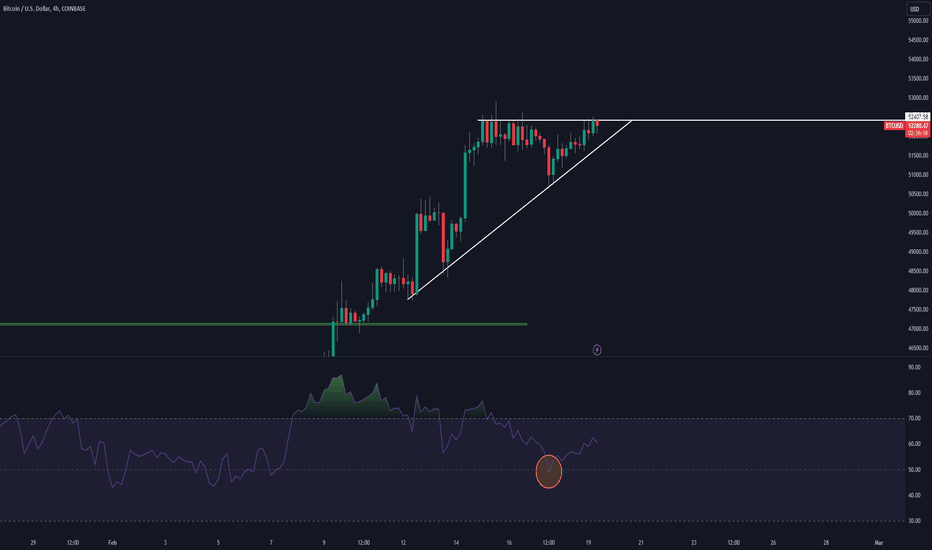
Intro BTCUSDT gearing up for a significant move today, and I'm here to break down the potential price action. Over the weekend, BTC moved interestingly, closing the CME gap and aligning with the CME's close price as we stepped into Monday. With this setup, we're eyeing an imminent breakout. Weekend Wrap-up and the CME Gap: The weekend saw Bitcoin hovering below the CME gap, but as predicted, it pulled back to around the $52,160 mark by Monday. This retest sets us up for the next leg. Ascending Triangle Formation: On the charts, Bitcoin is carving out an ascending triangle, a classic continuation pattern hinting at a bullish outcome. Given the trend's bullish nature, I'm eyeing an upward move, with immediate targets set around $54,000. Should a bearish scenario unfold, which seems less likely now, support at $50,000 will be crucial. ETF Flows and Market Reaction: The Bitcoin ETF market dynamics play a pivotal role. Although ETF flow data is typically available the next day, I'll be the first to update on Twitter. These inflows can trigger the breakout, so stay tuned. Liquidation Heatmap Update: A staggering $1.2 billion in Bitcoin short positions has accumulated above the current price level. A break above $53,000 could trigger a massive squeeze, potentially propelling BTC towards and beyond $54,000. Funding Rates and Market Sentiment: High funding rates indicate a market leaning towards long positions, a sign of bullish sentiment. Though it also suggests caution as markets could be getting overextended. But in bull markets, this is common. Technical Milestones: Bitcoin's weekly close has confirmed above the critical 0.618 Fibonacci level, a bullish signal historically leading to robust bull markets. The next resistance to watch is between $57.5k to $58,000, my target for the next potential pullback. Ethereum's Outlook and the Upcoming ETF: ETHUSD is also worth your attention as its Spot ETF looms, set to debut in about 95 days. With a lower market cap than Bitcoin, inflows could have a more pronounced impact, making ETH a compelling trade in the coming months. Remember, whether you're trading on the spot or futures, stay updated, and don't overextend your positions. Bitcoin is showing all the signs of a bull run, but as always, the markets can surprise us.
CryptoSeaTV
Bitcoin Divergence & Wallstreets ETF
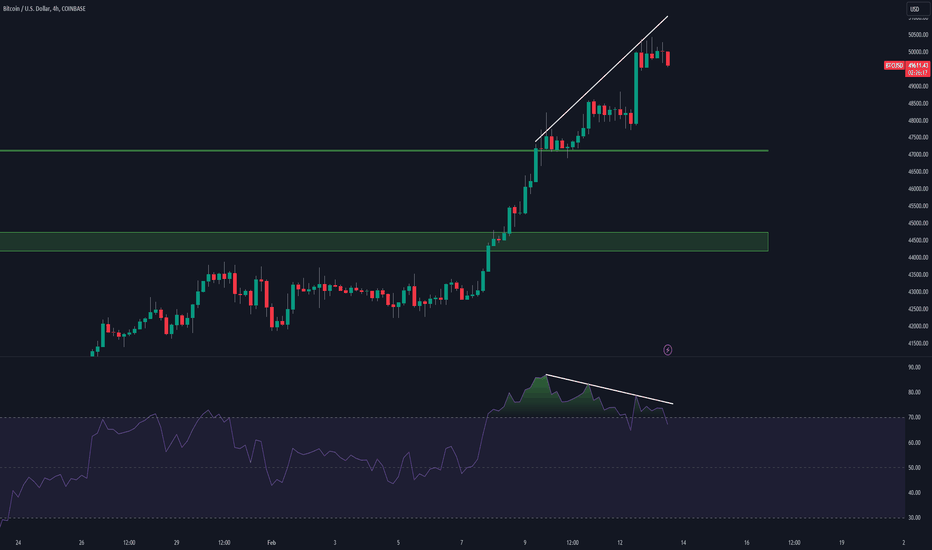
Bitcoin's Latest Price Rally Curious about the recent upswing in Bitcoin's value? It's not just your average uptick; it's a major play by Wall Street, diving into Bitcoin ETFs with substantial capital influxes. We're talking a serious $494 million boost in Bitcoin's market, indicating a strong institutional endorsement that's far beyond day-trading buzz. Bitcoin ETF Inflows: A Closer Look When you see a massive $494 million pouring into Bitcoin ETFs, it's clear that Wall Street is making a decisive move. This level of investment is a significant bullish signal for Bitcoin, often leading to heightened market activity and upward price pressure. The Divergence... Here's the deal: the 4-hour Bitcoin charts are hinting at a bearish divergence. Despite the bullish sentiment, these indicators suggest a possible reversal, with a considerable amount of liquidations looming between $40k to $48k. It's a delicate balance that could tilt the scales at any moment. Liquidation Levels Taking a glance at the liquidation heat map, we observe a substantial buildup, a clear sign that the market could be overleveraged on the long side. As the cost to maintain these positions climbs, it's a critical moment for traders to be vigilant and ready for potential shifts. In Conclusion What do we make of all this? It's a classic battle of market forces. Wall Street's hefty investment in Bitcoin ETFs is driving the price, creating a hot market. Yet, with the presence of bearish divergence and a significant stack of potential liquidations, there's a hint of caution in the air. Wise traders will be monitoring these developments closely. Over to You Agree with this breakdown? Or do you see things differently? Hit the like button, share your insights below, and follow for more market analysis that cuts through the noise.
CryptoSeaTV
Correlation between Bitcoin and Tether's Market Cap
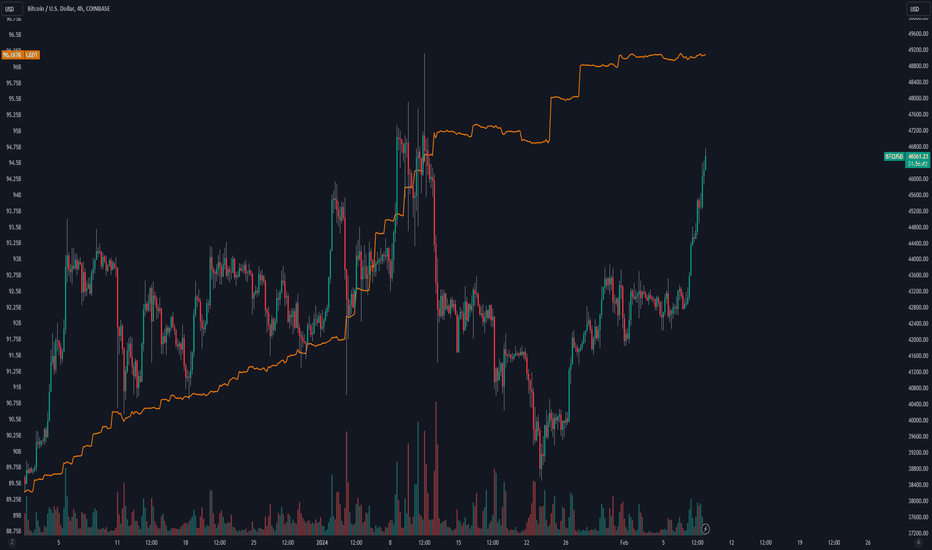
Correlation between Bitcoin and Tether's Market Cap Looking at BTCUSDT and USDT , we see a bullish pattern unfold. The market cap of USDT has been following a similar growth pattern to Bitcoin. These 2 tend to follow similar patterns but there is something else going on here too. This positive correlation hints at an underlying bullish sentiment. Traders could be converting fiat to USDT, then diving into Bitcoin, riding the wave of price increases. It's a classic case of supply meets demand—USDT's steady market cap growth fuels liquidity, easing the path for investors to move in and out of Bitcoin. But its not just that, from the 12th of Jan where Bitcoin saw a sell off, the USDT market cap remain unchanged, this suggests that investors were simply holding their USDT on the side ready to get back into the market opposed to where we normally have larger/bearish sell offs, we will see the USDT diminish with the price of Bitcoin. Will we see Bitcoin head all the way to the Highs or have we got some more consolidating to do first? With the halving coming around the corner and ETF poopularity growing, its hard to deny that we will eventually see a higher valued Bitcoin.
CryptoSeaTV
Head & Shoulders Playing out

As shared previously, we saw a potential Invrese Head and Shoulders pattern playing out on BTCUSDT , this was confirmed we the declining volume then the neckline break. If you missed it, there is still a chance. Quite often we get to see a retest of neckline breaks like this before trying to reach our target of $50,000
CryptoSeaTV
Bitcoin Breaking Out Now!
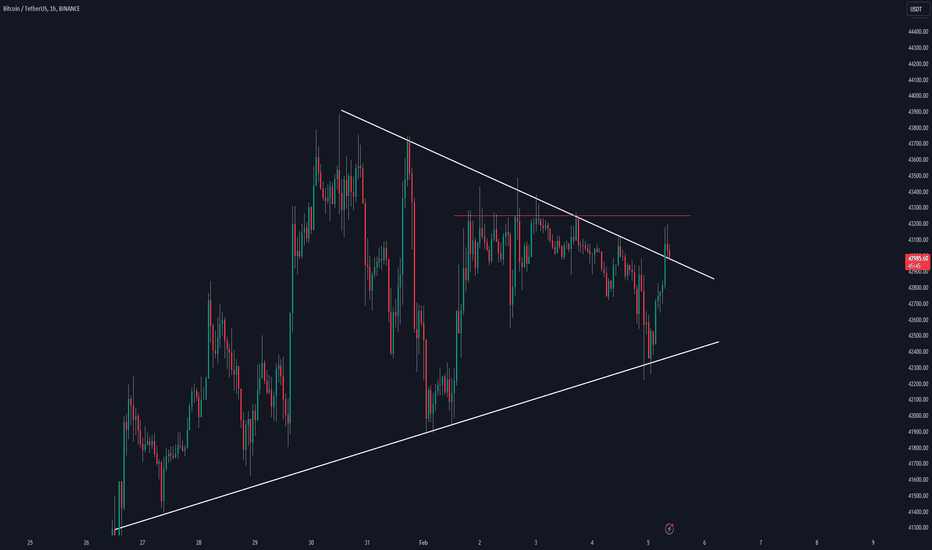
BTCUSDT has broken out of its ascending triangle, but don't just jump straight into a long position! Overview Bitcoin has been forming this triangle pattern since the 26th Jan, it has been leaning on the bullish side with only a few taps onto support but constant knocking on resistance. We have now closed above the triangle, however, there is another prominent level around $43,250 where price has rejected 8 times so far, so we need to wait and see if we can break that before we have the confirmation of more upside. Liquidity BlackRock customers are buying more than $150,000,000 in Bitcoin per day, there is $89,655,000,000 in available supply right now, that means BlackRock buys 0.17% of the available supply every day... That means if they carried on at this rate, ignoring any other factors, in 587 days BlackRock would have accumulated all remaining Bitcoin! How long can they continue at this rate? $43.5k has been a large build-up of liquidity, however, there is also a larger build-up around the lows of $38.5k. Market makers will normally try to wipe as much liquidity as possible before letting the real move happen, so one scenario we see playing out is taking the highs around $44k and then punishing the late longs by heading to the lows to wipe over $2 billion worth of liquidations before then letting the real move happen. Be patient and wait for the important closes above/below the levels mentioned above. Good luck out there!
CryptoSeaTV
BTC Head & Shoulders
This is the potential Inverse Head and Shoulders pattern which we could see playing out on $BINANCE:BTCUSDT. For this, we would want to see a higher timeframe close above the $43.5-44k regionIdea ended up playing out hitting our $50,000 target. Congrats anyone who followed.
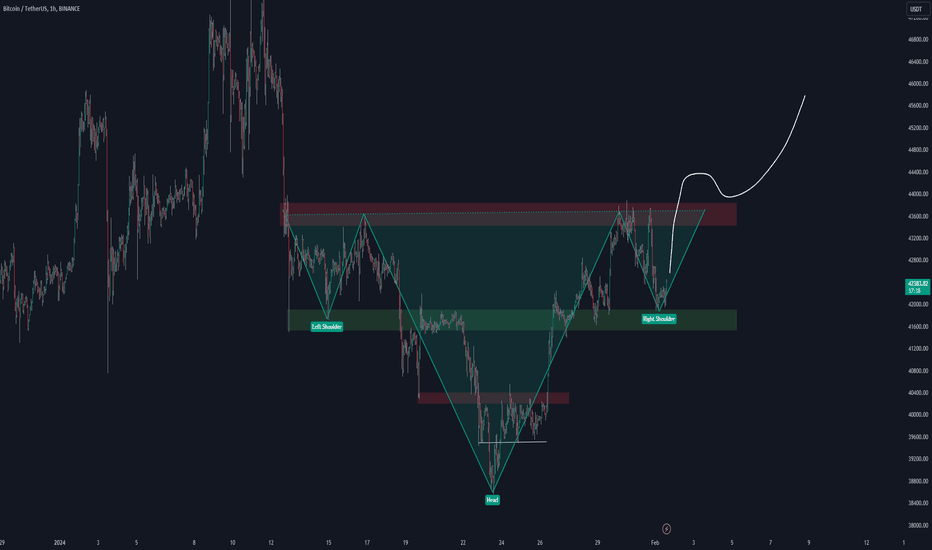
CryptoSeaTV
Nobody sees this BTC move coming
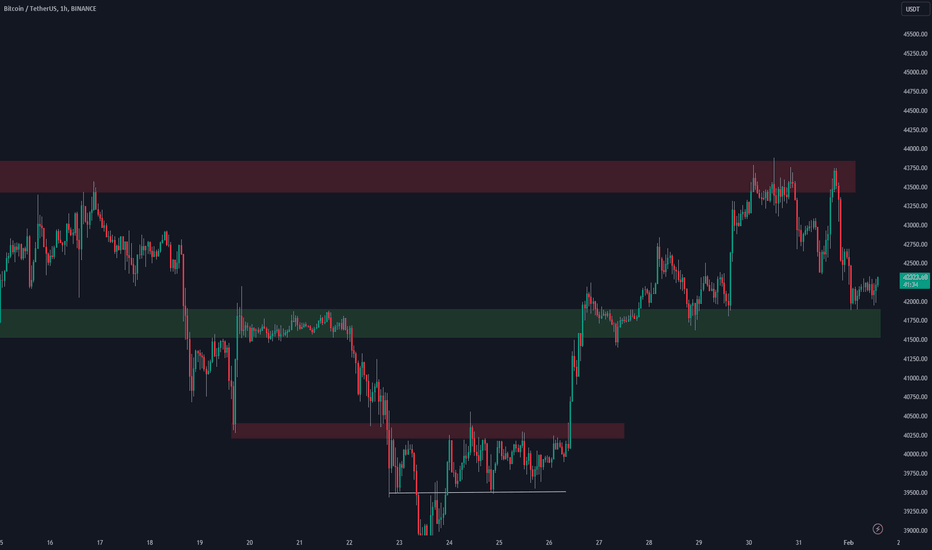
Overall Analysis BTCUSDT The $43.5k-$44k has been a key level which Bitcoin has been rejecting from, and I shared this in our last video. It had several attempts at trying to break it until we fell to the downside. There are a few levels of support which we will be monitoring. I think one of the biggest support levels is going to be around the $41-42k. We saw it act as a large support from the 12th-19th before it broke down and flipped into resistance. It then took over a week to finally break above the level again and now for it to hopefully flip back into support. Overall, this level has been respected 10+ times. There is a potential if we hold this level now that we could form an Inverse Head & Shoulders pattern which would be very bullish. Liquidity We have been having a large build-up of liquidity around the 41K as well as a lot of short liquidity up around the $43.7k level. These levels are likely going to determine which direction our next move heads to. There is also a large amount of liquidity sitting around the $39-40k level. Plan Waiting for a clear signal, still seeing a possible scenario where we lose this current support level and liquidate the build-up we have to then go and challenge the lower $39.5k liquidity build-up. However, the flip side of this is if we hold onto the current level and push up to the $43k level, we will be confirming the Inverse Head & Shoulders pattern which we would then hope for a flip and pushing to new highs!
Disclaimer
Any content and materials included in Sahmeto's website and official communication channels are a compilation of personal opinions and analyses and are not binding. They do not constitute any recommendation for buying, selling, entering or exiting the stock market and cryptocurrency market. Also, all news and analyses included in the website and channels are merely republished information from official and unofficial domestic and foreign sources, and it is obvious that users of the said content are responsible for following up and ensuring the authenticity and accuracy of the materials. Therefore, while disclaiming responsibility, it is declared that the responsibility for any decision-making, action, and potential profit and loss in the capital market and cryptocurrency market lies with the trader.