
CryptoOverseerX
@t_CryptoOverseerX

What symbols does the trader recommend buying?
Purchase History
پیام های تریدر
Filter
Signal Type
CryptoOverseerX
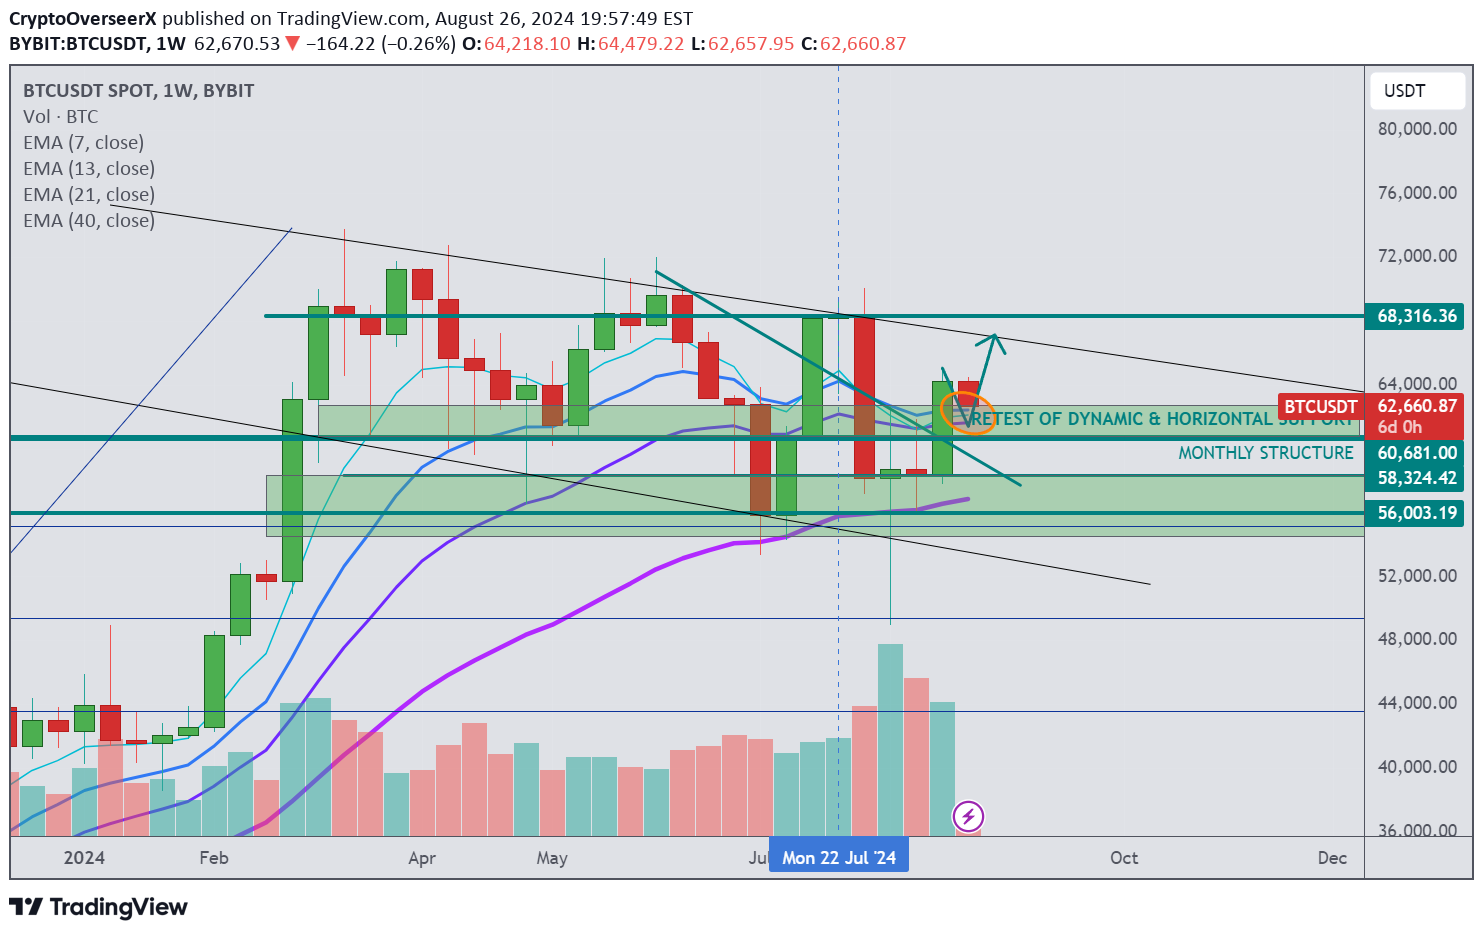
In my previous two weekly timeframe analyses, I expected a red candle close around $58K and a green candle last week breaking above the critical resistance level at $60,000-$62,000. We saw exactly that play out! Now, where do I see BTC/USDT price action going this week? We're very close to the monthly candle close, so expect some volatility. As long as we stay above $60,000, the outlook remains very bullish. I'm expecting a retest of the dynamic structure on the weekly timeframe, with a possible continuation to the upside, testing the high of the downward channel around $67,000. However, we must keep in mind that September has historically been the worst month for Bitcoin, and depending on how the monthly candle closes, we might need to reassess our view. I'm still holding the trade we took last week. PREVIOUS ANALYSIS : https://www.tradingview.com/chart/BTCUSDT/wr9aHxWc-BTC-USDT-Updated-Market-Outlook-for-This-Week-What-to-Expect/
CryptoOverseerX
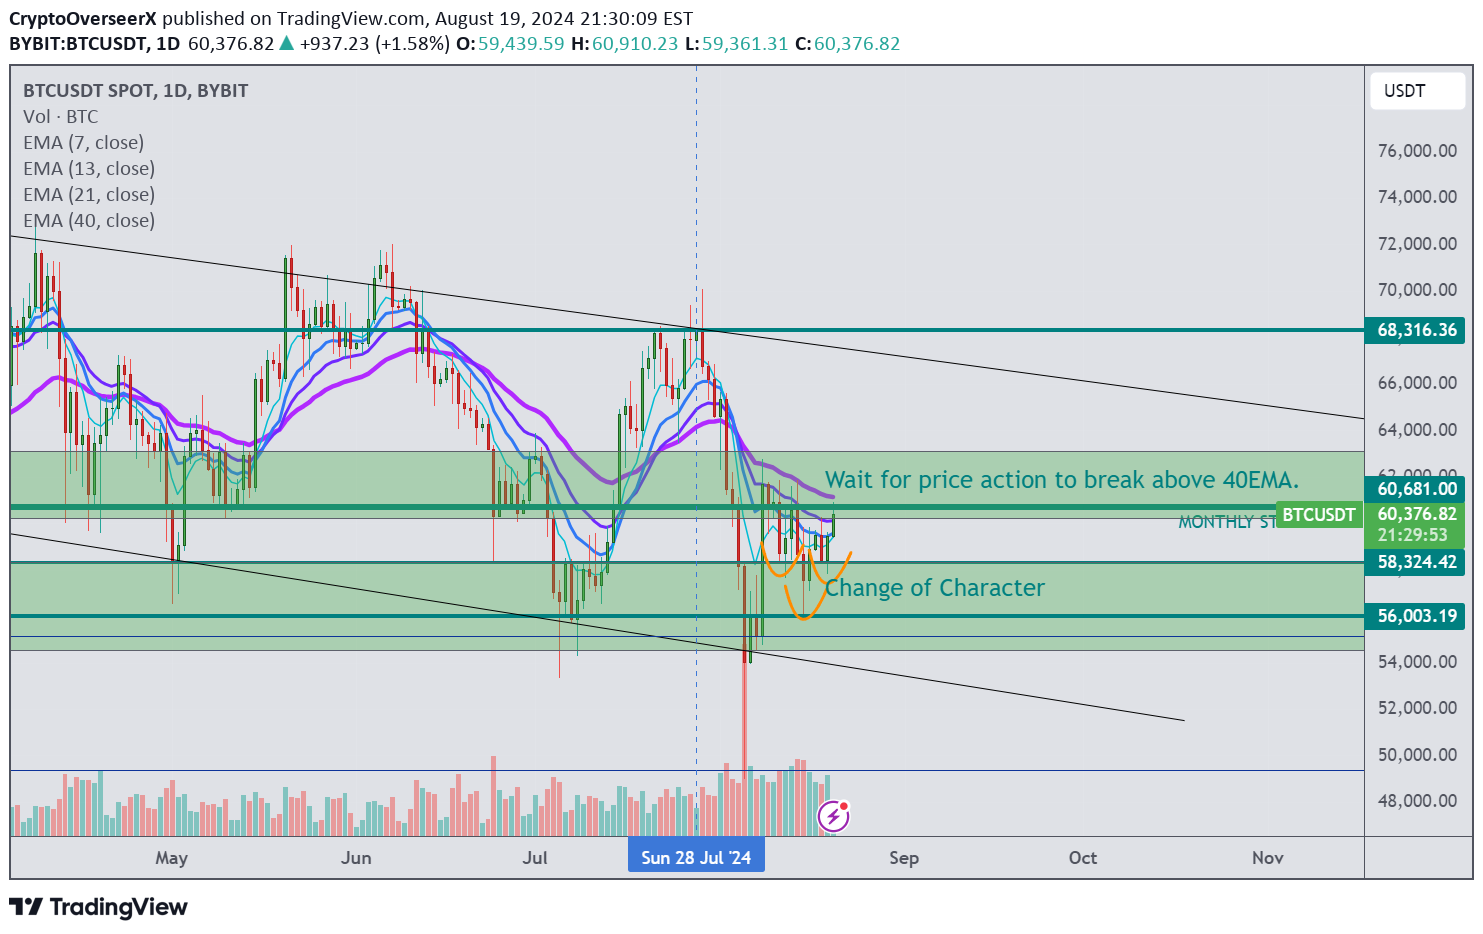
In my previous analysis, I anticipated this week to be green with a potential entry around $56,000. However, it seems we might not get that opportunity as BTC/USDT is now showing a Change of Character after printing a higher low and forming a reversal pattern on the daily timeframe. The $60,000-$62,000 range remains a crucial resistance level. Despite this, I believe we have a strong chance to break through it this week. We’ll have to wait and see whether we get a breakout or face rejection in this area. I’m currently looking for an entry opportunity if BTC breaks the 40-EMA on the Daily Timeframe. PREVIOUS ANALYSIS : https://www.tradingview.com/chart/BTCUSDT/KAo2jffZ-BTC-USDT-Market-Outlook-for-This-Week-What-to-Expect/
CryptoOverseerX

ENA looks very interesting to me. On the lower timeframe, the price has tested $0.29 multiple times and refused to go lower. With the newly developed 21-EMA on the weekly chart currently sitting at $0.67, and the expectation of BTC being green this week, this setup appears promising. ENA/USDT Entry: 0.2932 Stop: 0.2745 (optional for spot position) Target 1: 0.3681 (if using leverage) Target 2: 0.4933 (confluence of weekly structure with weekly 13-EMA)
CryptoOverseerX

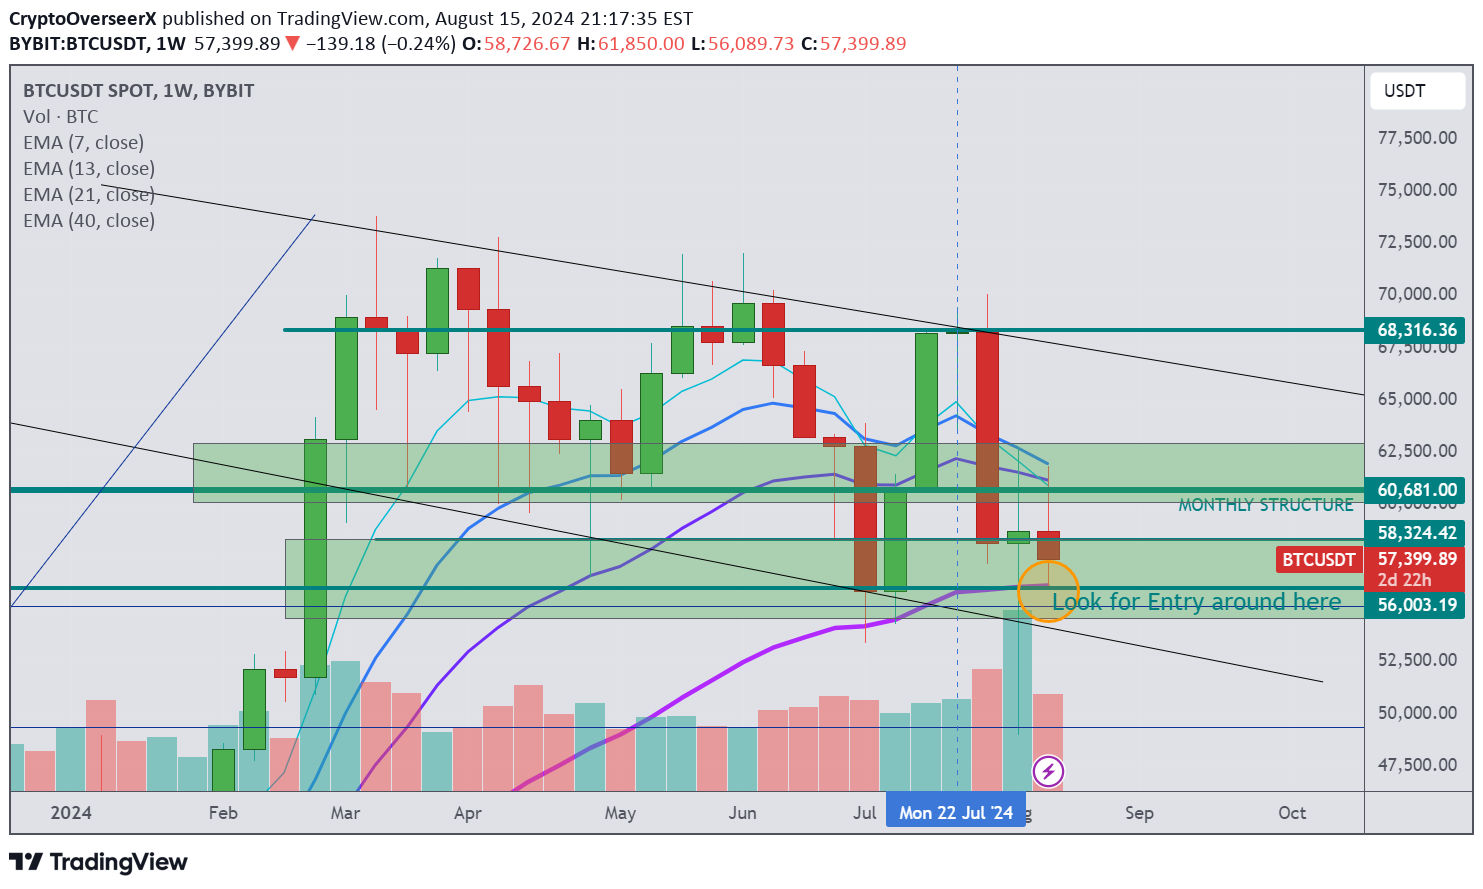
In my previous weekly timeframe analysis, I expected the price action to create a wick around $54,000-$56,000 before closing around $58,000 to end the week. And that is exactly what happened. Now that we have a new weekly candle, what should we expect for this week? I’m expecting the price action to at least touch the 40-EMA on the weekly timeframe (currently sitting at $56,264) before creating a rejection and pushing the price to possibly break $60,000-$62,000, which is currently acting as crucial resistance. Hopefully, we’ll see BTC retesting the high of the downward channel this week (around $67,000). I’m looking for opportunities to enter the market this week. Stay tuned. PREVIOUS ANALYSIS : https://www.tradingview.com/chart/BTCUSDT/wr9aHxWc-BTC-USDT-Updated-Market-Outlook-for-This-Week-What-to-Expect/
CryptoOverseerX
In my previous analysis, I mentioned that we expect the price action this week to create a wick around $54,000-$56,000 and close this week around $58,000. I'm still looking for an entry around $54,000-$56,000. However, the price action has bounced right off the 40-Weekly EMA around $56,000, so there's a chance we might not get the entry we wanted. Let's watch how the price action develops in the coming days. PREVIOUS ANALYSIS : https://www.tradingview.com/chart/BTCUSDT/wr9aHxWc-BTC-USDT-Updated-Market-Outlook-for-This-Week-What-to-Expect/
CryptoOverseerX
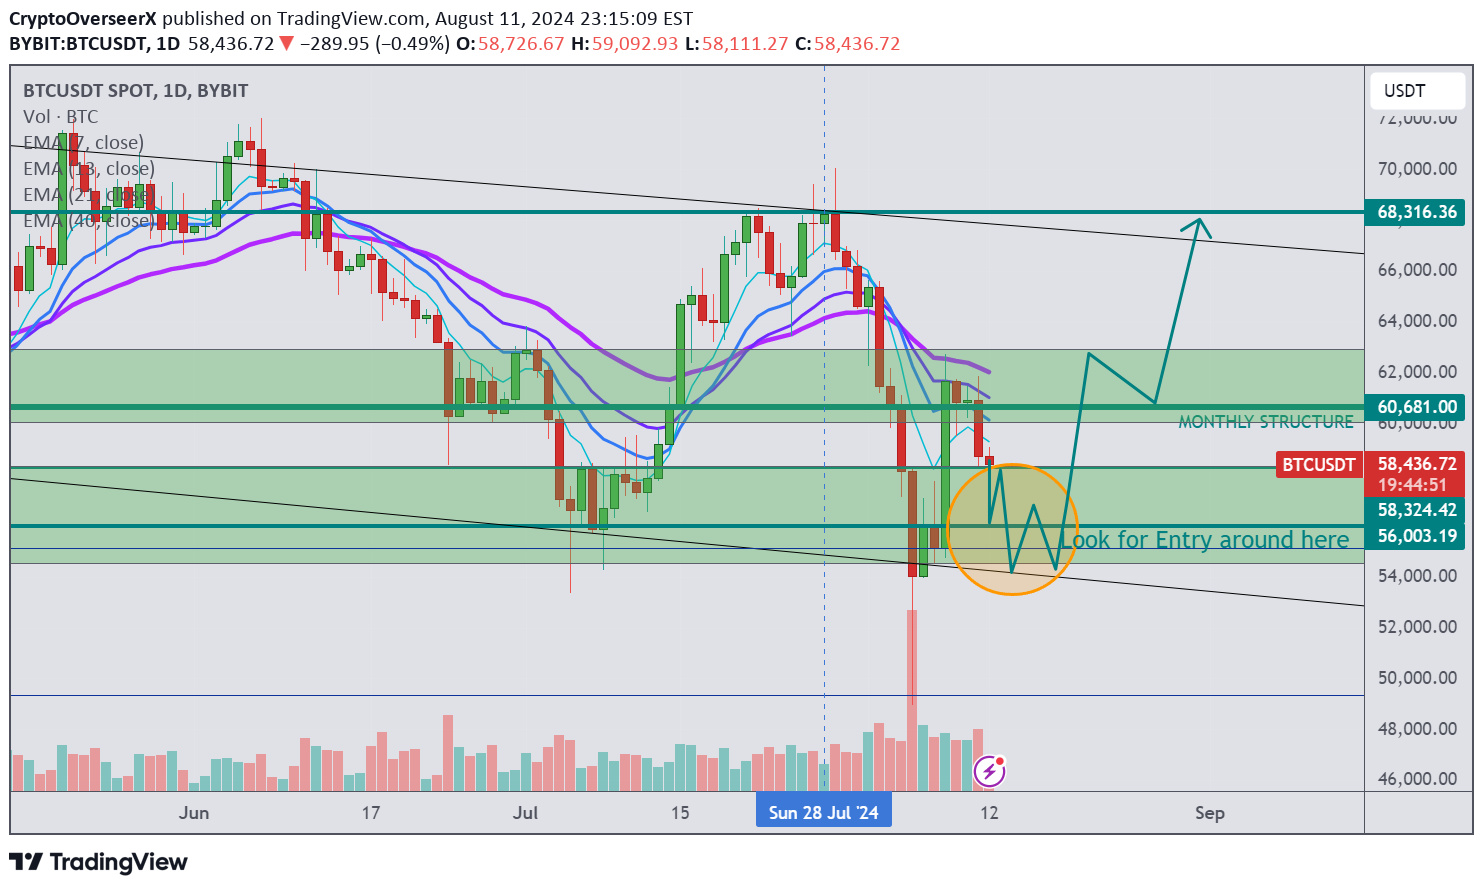
In my previous analysis, I expected BTC to bounce after retesting $60,000. However, after observing the price action, I announced that I would close the trade manually at breakeven at $61,000. Now that we have a new weekly close, I'm expecting the price action to create a wick around $54,000-$56,000 before closing around $58,000 to end this week. I'm looking to enter BTC this week around $54,000-$56,000.Expect a red candle this week and a green candle next week after a new base around $58,000 is created. CPI is coming up this week, so there's that.PREVIOUS ANALYSIS :
CryptoOverseerX

In my previous analysis, I mentioned that BTC price action on the daily timeframe showed the possibility of reclaiming $60,000 to maintain a bullish outlook for the upcoming months, especially with Q4 and the election coming up.Now that we have reclaimed this important area and maintained a bullish view on the higher timeframes, it's a good opportunity to enter the trade on the retest of structure. I'm looking to enter BTC around $60,000-$61,000 very soon.Entered at $61,000Closed at break-even. Will look for a better entry.I forgot to announce it here, but we closed this trade earlier today.
CryptoOverseerX
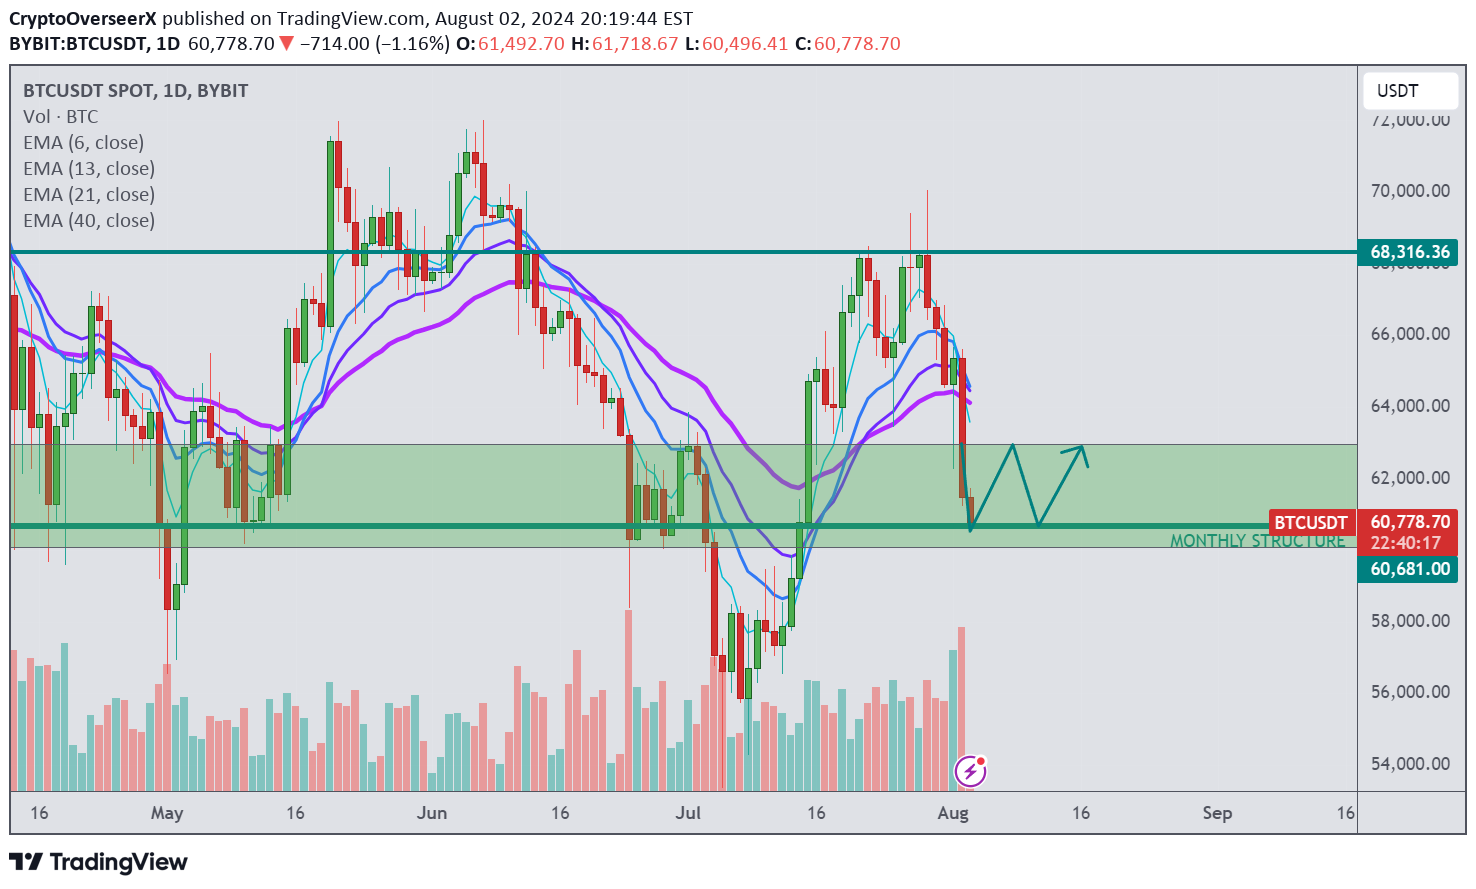
BTC/USDT Is Approaching the Key Area Mentioned in My Previous Multi-timeframe Analysis I already said that we're very bearish for this week and are eyeing an opportunity to enter the market around the monthly structure. If you're impatient, you can bid around $60,500, and it wouldn't be a bad decision. I will share my entry on my VIP channel. PREVIOUS ANALYSIS : 01:27
CryptoOverseerX

In my previous analysis, I mentioned that the better trade is to wait until the price action breaks above the $360 weekly structure and then enter on the retest. However, I see another swing trade opportunity after noticing the candlestick closed with a continuation pattern that I like, right above the dynamic support of the 40-day EMA on the weekly timeframe. My directional view remains the same as in my previous analysis. My Previous Analysis :
Disclaimer
Any content and materials included in Sahmeto's website and official communication channels are a compilation of personal opinions and analyses and are not binding. They do not constitute any recommendation for buying, selling, entering or exiting the stock market and cryptocurrency market. Also, all news and analyses included in the website and channels are merely republished information from official and unofficial domestic and foreign sources, and it is obvious that users of the said content are responsible for following up and ensuring the authenticity and accuracy of the materials. Therefore, while disclaiming responsibility, it is declared that the responsibility for any decision-making, action, and potential profit and loss in the capital market and cryptocurrency market lies with the trader.