
CryptoNoan
@t_CryptoNoan

What symbols does the trader recommend buying?
Purchase History
پیام های تریدر
Filter
$CORE $CORE BULLISH LONG
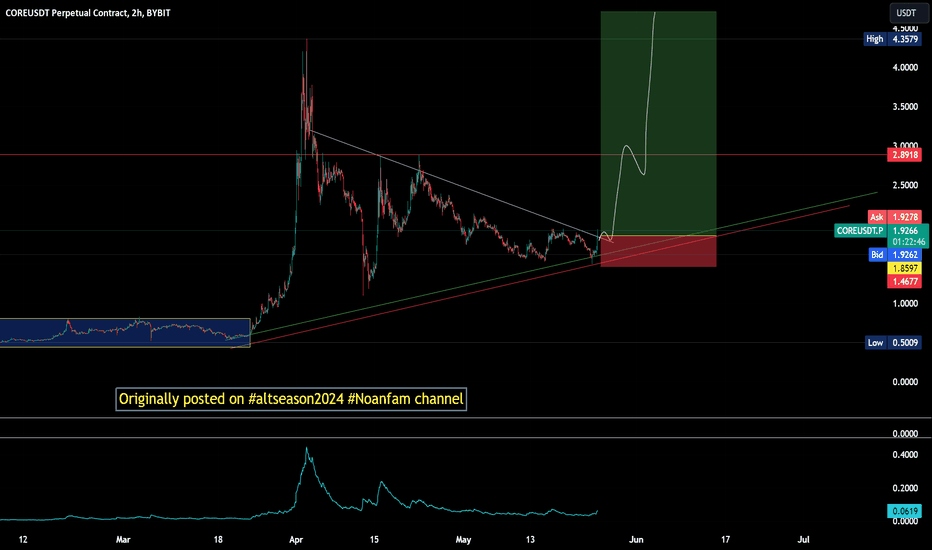
COREUSDT Perpetual Contract Analysis Current Price: 1.9092 USDT Key Levels: Support: 1.4677 USDT Resistance: 2.8918 USDT Trade Setup: Entry: Break above 1.90 USDT (descending trend line) Take Profit: Partial and LTPR Stop Loss: Below 1.4677 USDT Strategy: Enter on a break above the descending trend line with volume. Use a trailing stop loss along the ascending trend line. This setup suggests a potential bullish breakout with significant upside. Use a trailing stop loss to manage risk
#People $people chart - entry model illustration

This chart displays the price action of the PEOPLE/USDT perpetual contract on Binance over a period from late March to late May 2024. The chart includes annotations that describe various trading entries and price movements. Here's a breakdown: Support Flipped to Resistance and Range Top: Initially, a significant support level is identified, which later flips to resistance. This price level also marks the top of a trading range. Deviation: The price deviates below the support level, indicating a temporary break below the established range. Support and Range Low: The lower boundary of the trading range, which acts as support, is marked. Bullish Breakout: After consolidating within the range, the price breaks out above the resistance level, signaling a bullish trend. Retest: Following the breakout, the price retests the previous resistance level, now acting as support. Entries: Entry 1: Positioned at the range bottom/support, indicating a potential buy opportunity at the lowest range level. Entry 2: Located at the range middle, suggesting an entry as the price moves through the mid-point of the range. Entry 3: Breakout entry, placed at the point of the bullish breakout above the range top. Entry 4: Retracement entry, identified after a retracement following the initial pump. Price Movements: 66% Pump: The chart highlights a significant 66% price increase following the bullish breakout. Retracement Entry: A retracement occurs after the pump, offering another potential entry point for traders. Overall, the chart illustrates a trading strategy based on identifying key support and resistance levels, observing deviations and retests, and capitalizing on breakout and retracement opportunities.
#Blz $Blz chart Long #Noanfam

The chart for Bluzelle (BLZ/USDT) perpetual contract on Binance shows a key support zone around the 0.27-0.28 range, indicated by multiple buy signals at this level. The current price hovers around this support. Key Points: 1. **Support Zone**: The area between 0.27 and 0.28 has been bought multiple times, indicating strong support. 2. **Resistance Levels**: The resistance levels to watch are around 0.482 and 0.674. 3. **Bullish Scenario**: Reclaiming this support could lead to a significant bullish move towards all-time highs (ATH), as suggested by the yellow projection line. 4. **Volume**: Volume spikes correlate with previous price movements, indicating strong interest at key price levels. 5. **RSI Indicator**: The RSI shows a potential bullish divergence, suggesting an upward momentum might be building. Conclusion: Maintaining the current support level could confirm a bullish reversal, with potential targets at higher resistance levels. Monitoring volume and RSI trends will be crucial for confirming this move.
Significance of the $BTC Bullish Breakout:

I flipped bullish around Aug- 2023 and I am very bullish today, read more to know why👇 After hitting an all-time high (ATH), it's typical for any tradable asset to make some retracement. It's crucial to monitor the situation closely to determine whether this downturn is merely a correction or the start of a prolonged downtrend. The key difference between a retracement and the onset of a downtrend lies in whether the market shows interest in buying at lower prices. We can observe that Bitcoin declined about 24%, but the market prevented it from falling below a certain price level, around $56,580. Following this, Bitcoin began to form higher highs, indicating signs of accumulation. Today's breakout further confirms this accumulation. Looking ahead, there are three potential scenarios: 1. Continuation of bullish momentum. (bullish) 2. A minor pullback and retest of the breakout level (refer to the chart - marked by the orange dotted line) (bullish but sidelined) 3. A liquidity grab below the recent low, which could be advantageous for the market. (Cautious) I remain bullish to neutral on all three scenarios, turning bearish only if Bitcoin falls below $56,400. When extremely bullish? Above $74k, more so if it makes a retest after a break out above $74k
$xcn #xcn crypto - #NoanFam @CryptoNoan

X XCN #xcn #cryptocurrency trading with neutral bias with indication of bullish formation as shown on the chart 1) Long - entry on retest of trendline support 2) long - entry on bullish break out 3) short - entry on breach of trendline support

$btc #btc $bitcoin #bitcoin - Prediction

BTC #btc BITCOIN #bitcoin - Prediction Bitcoin (BTC) is currently forming a symmetrical triangle pattern on the price chart, characterized by equal highs acting as resistance and higher lows forming diagonal support. Key points to watch: Upward breakout: If BTC breaks out of this pattern to the upside, accompanied by strong volume, it would signal a bullish continuation. This could lead to altcoin pumps, as traders often rotate capital into altcoins during Bitcoin rallies. Downward breakout: If BTC breaks down below the lower high support, the next significant support level is as marked on the chart
$btc #btc $bitcoin #bitcon - long - bull case

BTC #btc BITCOIN #bitcon - long - bullish chart: Should the momentum continue, Bitcoin could reach its all-time high, potentially triggering FOMO and further price increases. However, each price breakthrough could be followed by a pullback, triggered by news, events, or simply technical levels (represented by the yellow lines
$grok #grok - Noan Strategy

$grok #grok - Noan Strategy $GROK #GROK Last time, we nailed the exact bottom and bottom around $0.006, and then it gained about 600% on spot, we are consistently trading every local top and bottom. Recently It has formed a wide range, and to establish a new high, it needs to break out of the range with high volume. While it lacks fundamentals, it boasts a strong community of retail investors. Every time ElonMusk tweets about his AI (though irrelevant), it pumps to the range top and then returns to the bottom. One positive aspect is that it has started forming higher lows on multiple timeframes. Continue to trade the range until you see a strong break out and retest Good luck

Disclaimer
Any content and materials included in Sahmeto's website and official communication channels are a compilation of personal opinions and analyses and are not binding. They do not constitute any recommendation for buying, selling, entering or exiting the stock market and cryptocurrency market. Also, all news and analyses included in the website and channels are merely republished information from official and unofficial domestic and foreign sources, and it is obvious that users of the said content are responsible for following up and ensuring the authenticity and accuracy of the materials. Therefore, while disclaiming responsibility, it is declared that the responsibility for any decision-making, action, and potential profit and loss in the capital market and cryptocurrency market lies with the trader.