
CryptoBrainn
@t_CryptoBrainn

What symbols does the trader recommend buying?
Purchase History
پیام های تریدر
Filter
CryptoBrainn
BTC USDT 22122023

Perhaps we can see a development in this direction. I'm not sure, I took a quick look. But that's my expectation. Due to military tensions, everyone is running away from cash. This can elevate cryptocurrencies. However, I think people will move away from cryptocurrencies for a while due to power outages that may be caused by natural disasters such as solar flares.
CryptoBrainn
BTC Monthly Future Projection

I think it's a dangerous time. If it follows a course that takes place in the future, I suggest you take a screenshot and examine every detail in the big picture.
CryptoBrainn
Doge Usdt 10/20

When we look at the monthly graph, you can see that it is at an all-time low. If you look at both the harmonic graph and the formation graph in the monthly period, you can confirm this. When we examine the data of indicators in the monthly time frame, it is possible to receive signals that they are on an upward trend. In the weekly period, you can see an internal fractal harmonic pattern that the trend will return upwards. In addition, when we examine the graph in the weekly and daily time frames, you can see that price movements are consolidated and stuck. When we look at the previous supply areas of current price movements, we can think that this area constitutes strong support and will not easily allow further declines. When we project from past to present, we can see that trend movements are now positive. With an optimistic attitude, this may be an indication that the downward trend has come to an end. However, when we examine the latest price levels, we see that we are trying to complete a harmonious pattern. However, it seems that the D leg has not yet been created. Although leg C appears to have formed, there may be back tests and the price may continue the upward trend by falling slightly lower. Based on this data, we can begin to plan resistance target levels by thinking that it will soon be on an upward trend. Regardless of the pattern that will be generated, it will be possible to determine an approximate sales area if we consider that foot D will expand to at least 1,618. When we look for a resistance zone by simulating the harmonic pattern, we can also see that the resulting price levels correspond to the previous supply levels. After approving the price increase, I expect that it will most likely reach the price levels that I mentioned in the chart above. This area is consistent with past pattern and price movements. However, if there is a strong trend, it may be possible to predict the next target price levels in this graph. When we measure Fibonacci levels by guiding the harmonic pattern, we may encounter resistance zones as follows; When we examine the index data in the daily period, the fact that the ADX is at 13 levels despite being negative gives the signal of an upward turn. When looking at Aroon, it's clear that sellers are getting weaker. The indicative level of buyers indicates that purchases will begin soon. When we look at wallet indicators, it seems that there are still no strong money flows. However, despite the lack of a cash flow, the absence of a strong downward fall is again a signal in favor of buyers. In conclusion, even if there are downward price movements that are not strong, I think that price movements will soon begin to climb upwards. Note: this is not investment advice.
CryptoBrainn
CRV USDT 08-10-2022 Technical Analysis
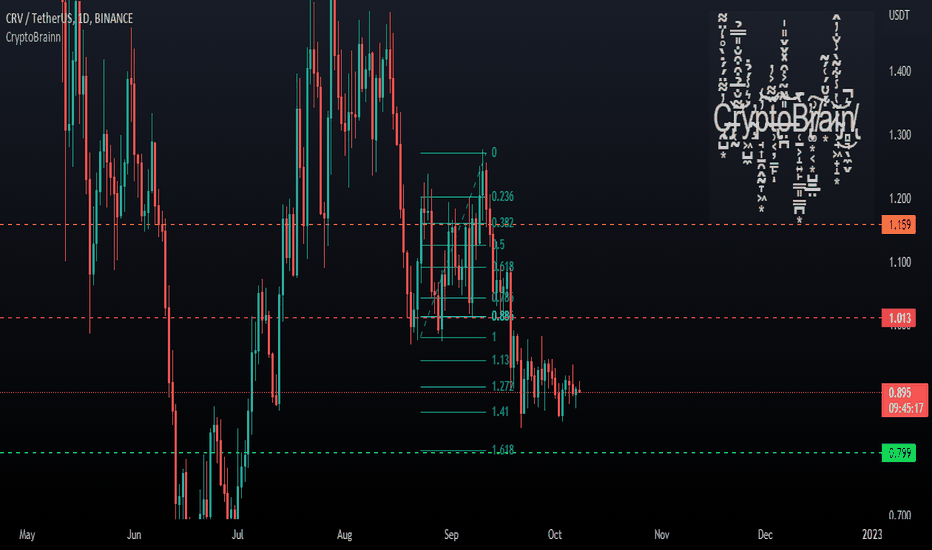
We can predict that prices will drop to 0.860 during the day. No matter which way we look at it, you can see more than one bearish pattern in the hourly time frame. I expect that in the short time frame prices may be in the range of 0.870 and 0.820. When we extend the time span a little more, we can predict that this decline is a precursor of an increase. Because instead of the descending triangle, the descending wedge formation can be seen in the graph as 4H. Things get a bit messy in the daily time frame. If we accept that the truth is the large time frame, we can accept the measurement we make in the daily time frame as a more accurate measurement. If we expect the D leg of the harmonic pattern to be completed to match the levels of 1.618 Fibonacci, prices may drop to 0.790. When we examine the graphic pattern of the region in which current prices are located, we see a descending triangle. If we calculate the depth of this triangle, we can predict that prices will remain in the range of 0.790-0.750. When you follow the downward trend within the Fibonacci channel, you can actually see that prices are close to recovery. The regression channel seems to have been crossed. In short, I expect the prices to move a bit down first. Then its upward movement will begin. Note: this is not investment advice.
CryptoBrainn
SOL USDT Price Analysis

You can easily see that the left draws a clear harmonic pattern. There is only one problem. What price will point C correspond to? Although the C leg of the pattern also seems to be complete, there still does not seem to be complete price stability. There is a possibility that the price will fall to fibonacci 1.13 and change the current harmonic pattern to shark or another harmonic pattern. Even so, we can think that the start of the uptrend will be close. But we have another problem. If you are not an experienced investor, we see that you are trying to complete a harmonic pattern of the bear market, whatever its name. So even if there is an upward movement, strong downward sales will start again in the coming times. In this case, I think it will be safe to make piecemeal trades and enter stop loss orders. When you examine the bollinger bands and solana movements in the chart below, you see that the prices are stuck between the bollinger bands. The triangle on the chart does not indicate a pattern. Just consider it a geometric shape to show that prices are shrinking. The triangle has no meaning. It just marks how the depth of the bollinger bands has narrowed. The upper line of the Bollinger bands may be in an angular downward acceleration. This may be a confirmation that prices are still not pointing to an upward trend. It's not reliable, but I wanted to say it in terms of ideas. When we examine the movements of prices in the last week, we can think that this indicates an ascending wedge. Accordingly, we can expect a decrease of the same depth. You can also observe that the levels indicated in this chart and the previous supply zones are on the same plane. The important thing here is to determine whether the C leg will be at lower levels. If the area I pointed out with the current C is crossed, you can expect prices to return from fibonacci 1.13. Because the existing marked C leg will be invalid. As a result, even if the C pillar is crossed, we can foresee that we will not wait too long for prices to start an upward trend. Because the AB areas of the formation have been formed. For C, we can predict that enough time has passed, or even that it may have occurred. I think it would be a safe trade to buy and accumulate from here piece by piece and wait for the formation of the D leg. When we measure the resistance areas where the selling reaction may come during the uptrend of the harmonic pattern with the fibonacci levels of the harmonic pattern, you can predict that it coincides with the previous supply regions and that there will definitely be a sales reaction from here. Note: This is not investment advice.
CryptoBrainn
Eth Support and Resistance Zones

Considering the pressure of BTC on other commodities that dominate the market, BTC dominance continues to fall. This means that we can think that BTC will fall and put pressure on ETH and other coins. On the chart, which we can evaluate with the harmonic chart or the ABCD formation, we can predict that the prices will retreat by the wedge depth. In this case, the price depth of the harmonic pattern, which corresponds to the fibonacci 1.618 levels, seems to be in line with the previous supply zones. The fact that MA25 broke Ma100 on the downside in the moving averages shows that price stability has not yet been achieved on the upside. We can still agree that sellers are stronger. To me, not all the signals seemed reassuring. I can't talk about a clear upside or downside. But at times like these, buying and selling fragments seems safer to me. I think it would be a smarter approach to wait for the weekend to pass and for the price to be defined. Whatever way it goes up or down, I've marked on the graph where the buy-sell reaction . These zones will work as support or resistance. Note: This is not investment advice.
CryptoBrainn
Btc 30-09-2022

In short, without mentioning the technical details, it can be far behind the prices it rises after the rise. I think it will follow an unrelated order that it has fallen while rising. Not: It is not an investment advice.
CryptoBrainn
Btc Projection

When we want to see the big picture, we see a large harmonic pattern covering the bull and bear . Although the current price levels seem to have found support at 19K levels, I predict that this decline will continue until 12K. The reason for this prediction is the internal fractal patterns. If we want to explain this on the graph; I think that the harmonic pattern, which I consider to be a shark pattern in the measurements above, has been completed and has started to form a new harmonic pattern. When we follow the existing candlestick from the CD leg of this completed harmonic pattern, we can observe that half of a new harmonic pattern emerges. It can be misleading to predict which patterns this harmonic pattern will overlap right now. However, I can say that the new pattern will climb to at least 1.27 fibonacci levels. Since I said it as a prediction, I think it would be more accurate to say that it will exhibit price movements in the range of 1.27 and 1.618 instead of saying that it will be 1.27. If our prediction turns out to be correct and a harmonic pattern is formed at our expectation levels, we can add to this prediction that the retreats of this harmonic pattern will be in the range of 11-14K. If we narrow the frame a little more and zoom in on the price movements, it seems that the current price movements draw a triangular chart. Upward jumps of the candle needles can also be clues that the triangle will break upwards. Of course, since this equilateral is a triangle, it may not be a safe sentence to say up or down about the direction until the candlesticks extend beyond the triangle. But my prediction is that there will be an upward break depending on the harmonic pattern I just predicted. When we go back to the big picture, we can see that the fractals we are talking about are more than one. It also appears that the harmonic pattern we just mentioned was in a larger fractal before it. If we take a measurement by accepting the resistance zones of these harmonic patterns as average levels of 1.618 fibonacci, we also see that these harmonic patterns correspond to the previous supply regions. But there is something else that will disrupt our plan. The 0.786 -0.886 C leg of the prices, which I think will be on the rise right now, can go down a little further to 1.13 fibonacci levels, forming a shark pattern. In such a case, prices may fall to 16400 and return from there. It is also necessary to be careful against this situation. NOTE:This is not investment advice.
CryptoBrainn
BTC HH before resetting

I think there may be a climb up to 29600 levels at most. The last wave of the Reverse Elliot will surely be completed. I believe that this escalation is the last rise before the great collapse. I am thinking of taking profit from this climb and analyzing the hh region again.
CryptoBrainn
Dot Trend
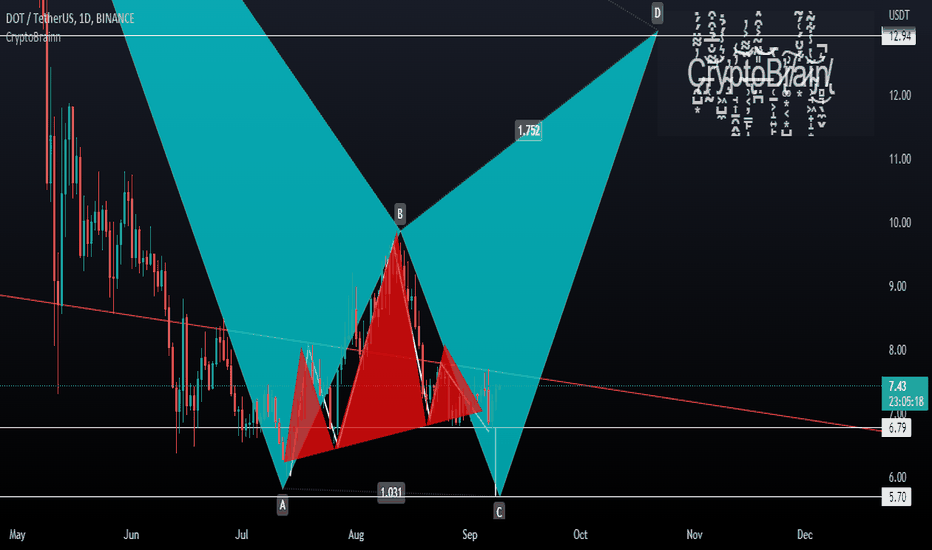
Depending on the Bitcoin movement, as in other sub-coins, seems to have completed a harmonic pattern and consolidated in the monthly period. When we look at the supply zones, I can say that when the upward trend starts in the monthly period, the first sales reaction is expected at $ 13 levels. When there is a pullback and a downward breakout, when we measure the fibonacci channel as a guide, $6 is seen as major support. I think a harmonic pattern is formed in the weekly period. This can be in a fractal pattern. There is also the possibility that the main pattern is a fractal that forms the A leg. In this case, fibonacci 1.13 and 1.618 are the levels we should pay attention to. Even if you do not understand technical analysis, be sure to consider the previous accumulation regions in your investments. Because what we call support or resistance are actually commercial psychological reactions that correspond to these supply zones. Then, respectively, the 2.618 and 3.618 fibonacci levels of the harmonic pattern in question again correspond to the supply zones of the past periods. When we look at the indicator data, I think that the cmf gives an angular negative signal. This could mean that there may be a pullback in prices. When we examine it through Aroon, I believe that there are undecided buyers and sellers. I see that there is no competition between the buyer and the seller. Aroon Up and Down are moving at a downward angle. Although Adx shows that the downtrend is weakening, I don't think there is a signal that a new trend has started yet or that the downtrend is over... In the daily period, if I am not mistaken, we see the Head and shoulders formation. According to this pattern, if there is a pullback in prices, it may suggest that the price will fall to 5.70. You should also consider this possibility as the price level it points to is also compatible with the previous supply zone. Note: this is not investment advice.
Disclaimer
Any content and materials included in Sahmeto's website and official communication channels are a compilation of personal opinions and analyses and are not binding. They do not constitute any recommendation for buying, selling, entering or exiting the stock market and cryptocurrency market. Also, all news and analyses included in the website and channels are merely republished information from official and unofficial domestic and foreign sources, and it is obvious that users of the said content are responsible for following up and ensuring the authenticity and accuracy of the materials. Therefore, while disclaiming responsibility, it is declared that the responsibility for any decision-making, action, and potential profit and loss in the capital market and cryptocurrency market lies with the trader.