
CryptoAle992
@t_CryptoAle992

What symbols does the trader recommend buying?
Purchase History
پیام های تریدر
Filter
CryptoAle992
$MKR/USDT 4h LONG Swing Setup
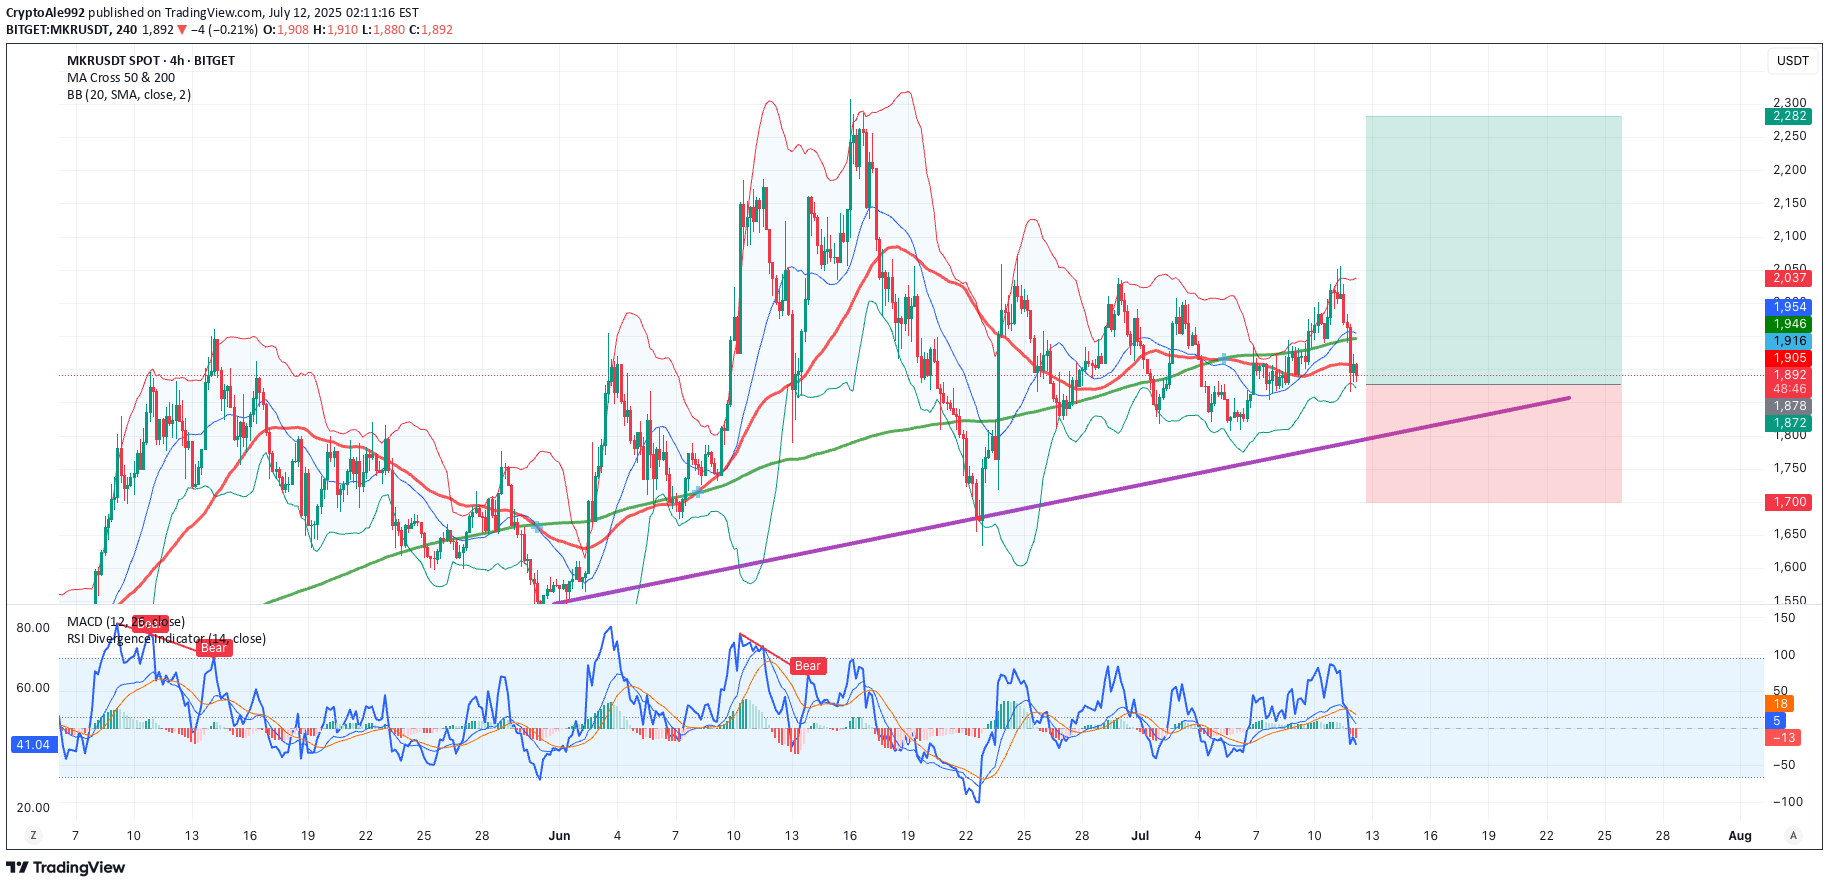
Entry: 1893 SL: 1700 TP: 2283 R/R: 2.2 Price rebounding off a strong uptrend line & 200MA support. DeFi momentum + E T H h o l d i n g ETHholding3k could fuel the next MKR leg up! Watching for a MACD reversal confirmation. 📈 Not financial advice. DYOR & good luck! 🔥 #Crypto #Trading #DeFi #MKR #Ethereum #Altcoins
CryptoAle992
Technical Analysis of the Financial Chart
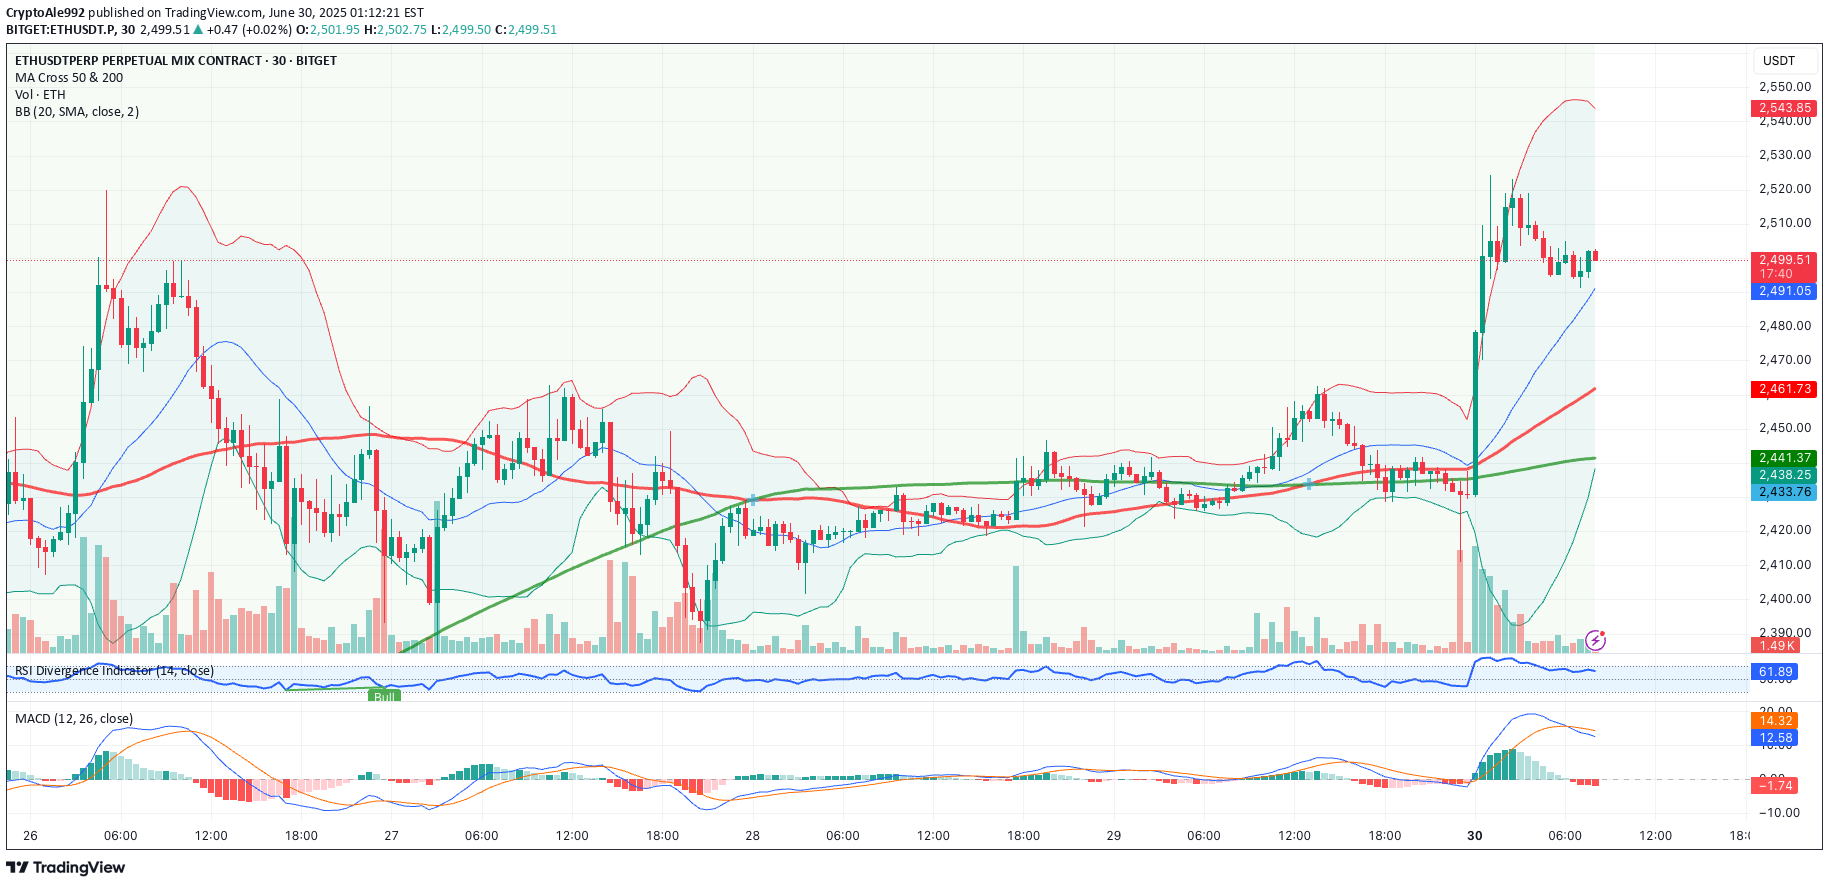
1. Main TrendThe overall trend for the ETH/USDT chart (30-minute timeframe) appears bullish, confirmed by the recent breakout above the $2,480 resistance level and price maintaining above the moving averages (MA 50 and MA 200).The latest upward momentum pushed the price to around $2,510, but the current candlestick seems to be consolidating at this level.2. Key LevelsResistance:$2,543 (next critical level).Support:$2,480 (previous resistance, now acting as a key support zone).$2,461 (aligned with the MA 50 and prior consolidation).Breakout: A breakout above $2,480 has occurred. The bullish trend is likely to continue as long as the price remains above this level.3. Technical IndicatorsRSI (Relative Strength Index):Currently around 63, indicating positive momentum but not yet overbought (70+), suggesting more upside potential.MACD:Both the MACD and Signal lines are above 0 with a recent bullish crossover. However, the lines are converging, pointing to potential consolidation.Moving Averages (MA 50 & MA 200):The price is trading well above both moving averages, reinforcing the bullish outlook.4. Risk/OpportunityEntry Point: Long above $2,505 (continuation of the bullish trend).Stop-loss: $2,470 (below the breakout level and MA 50 to reduce risk).Take-profit:Level 1: $2,543 (first visible resistance).Level 2: $2,570 (potential extension of the trend).Confidence Level: High (given the strong breakout and supporting technical indicators).RecommendationTrading Setup:Asset: ETH/USDTDirection: LongEntry: $2,505Stop-loss: $2,470Take-profit:Level 1: $2,543Level 2: $2,570Confidence: HighAdditional Notes:Monitor volatility and volume: A drop in volume may signal weakening momentum.Bollinger Bands indicate possible tightening after the breakout, suggesting consolidation.🏦 Conclusion: The current setup supports a bullish continuation strategy with a favorable risk/reward ratio.
CryptoAle992
CryptoAle992
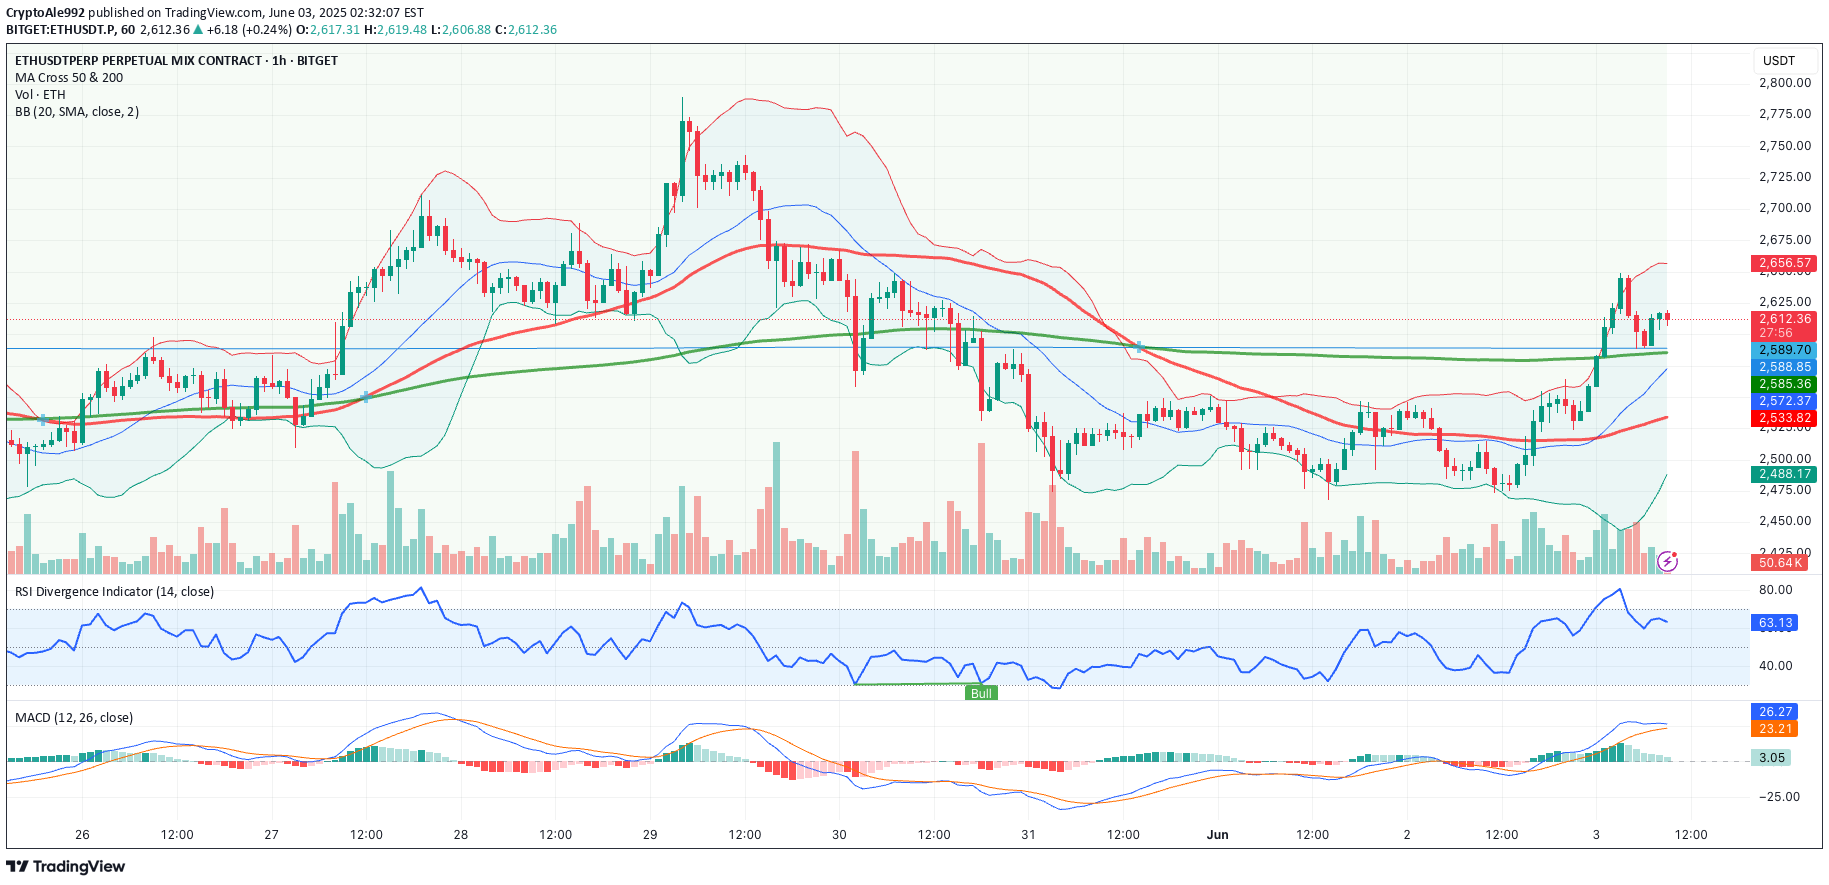
Technical Analysis – ETHUSDT (1h) – BITGET
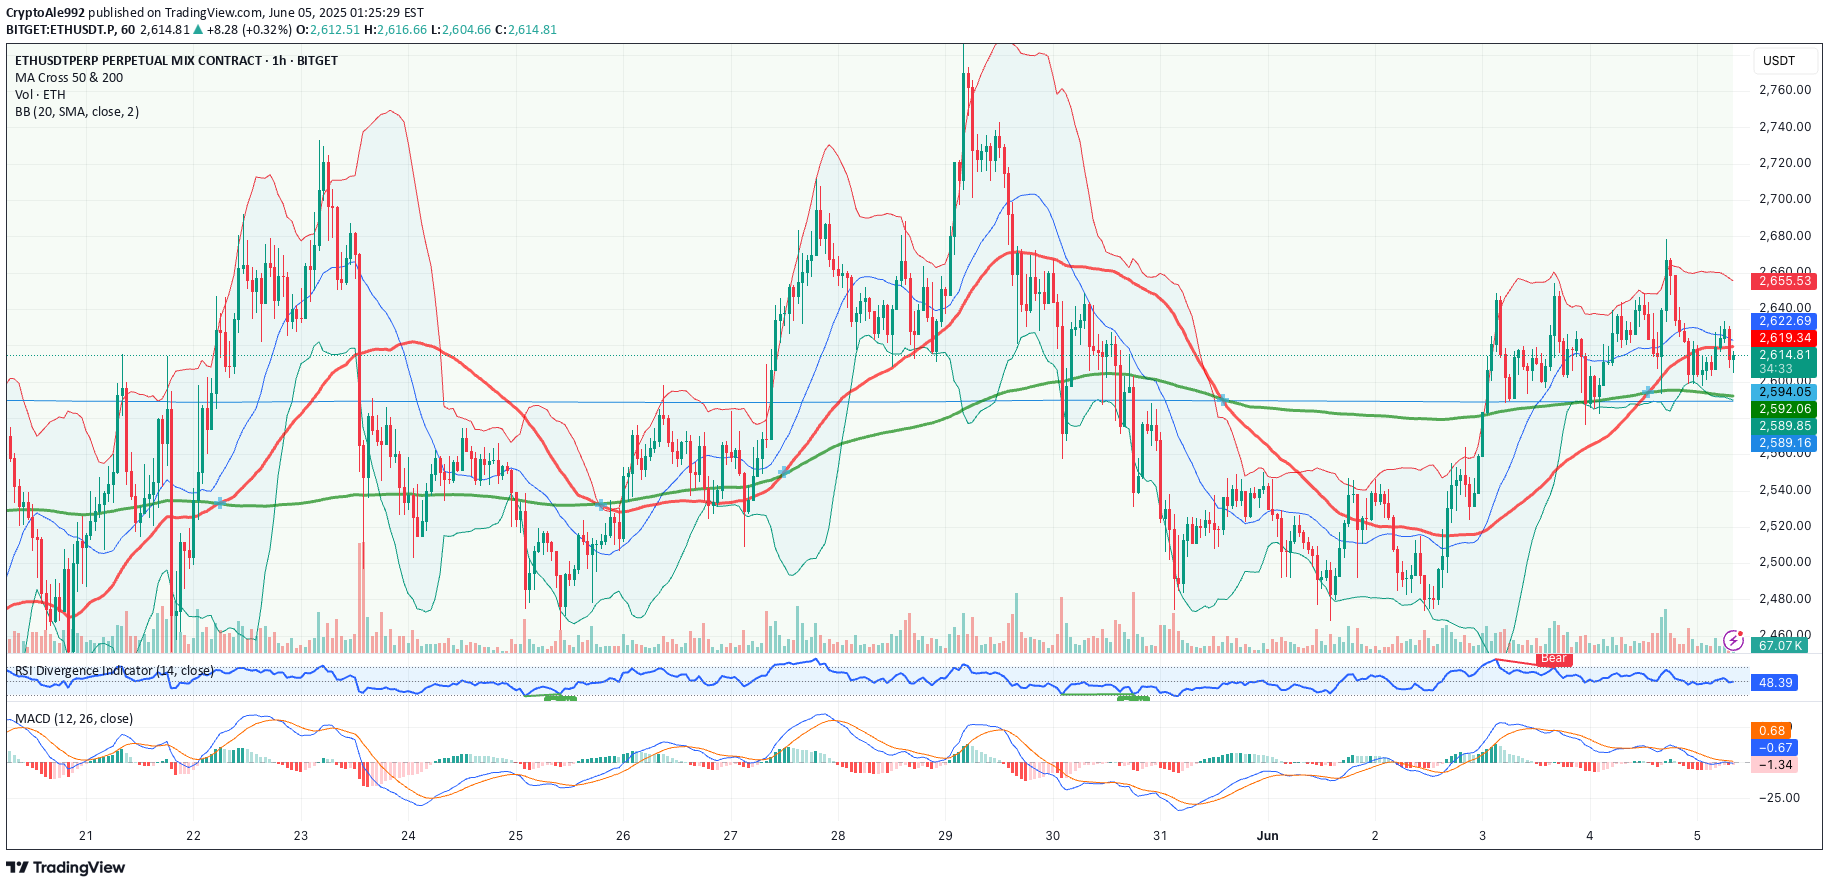
1. Main Trend:The short-term trend is currently sideways/slightly bullish. After a bearish phase, ETH has recovered above the 200-period moving average (green line), but struggles to decisively break the resistance around 2,620–2,640 USDT. The 50-period moving average (red) is close and often crossing the 200, indicating stability/uncertainty in the trend.2. Key Levels:Supports: 2,594 USDT (MA 200), 2,589 USDT (BB), 2,588 USDTResistances: 2,622 USDT (BB + recent local high), 2,655 USDTBreakdown: A clear hourly close below 2,590 USDT could open the door to declines towards 2,550/2,520 USDT.Breakout: Only a strong close above 2,622–2,655 USDT would confirm a new bullish momentum.3. Technical Indicators:RSI (45.73): Neutral, near oversold territory but without clear divergences (potential for rebound but risk of further weakness).MACD: Still negative, indecisive signal with MACD line below Signal and both flat: no dominant momentum.Bollinger Bands: Price is near the mid-band, typical of lateral phases. Bandwidth is low, suggesting the possibility of an imminent volatility spike.Trading SignalAsset: ETHUSDT Perpetual (1h)Direction: ShortEntry: 2,592 USDT(below the dynamic MA200 support and near the lower BB edge, confirming intra-hour weakness)Stop-loss: 2,622 USDT(above the central BB line and first resistance level)Take-profit:TP1: 2,555 USDT (previous lows and static support)TP2: 2,520 USDT (next key historic level)Confidence: MediumAdditional Notes:Consolidation phase; volatility likely in the coming hours.If price breaks and closes strongly above 2,622, bearish scenario is canceled; consider switching to long.Macro: watch for BTC volatility and possible knock-on effects on ETH.Pattern: no strong reversal pattern; situation dominated by uncertainty.Reasoning:The price action shows indecision and fluctuations within a tight range, but repeated tests of support without a strong rebound suggest underlying weakness. Failure to reclaim 2,622 strengthens the case for a short-term short, with a tight stop to protect against potential “fake breakouts.”
CryptoAle992
ETH/USDT Trading Signal

🔥 ETH/USDT Trading Signal 🔥Ethereum is looking strong!📈 Trend is bullish💡 Idea: Go LONG if price breaks 2,648🛑Stop−loss:2,592🎯 Take-profit: 2,700and2,740Why?Trend is upIndicators (RSI & MACD) confirmKey resistance is about to break!Like if you think ETH will pump! 🚀#ETH #Crypto #Trading #Ethereum
CryptoAle992
ETH/USDT Ready for a Bullish Rally? Key Breakout Levels to Watch
Hey Traders!Ethereum just delivered a strong move on the 1H chart – let’s break down the setup:📊 Trend:Momentum has shifted bullish! ETH has smashed through both the 50 and 200 moving averages, and price is riding above the mid-Bollinger band.⭐️ Key Levels:Support: 2,589(MA200),2,589(MA200),2,572 (Bollinger Middle Band)Resistance: 2,656 (upper band & recent high), next target 2,690🔎 Technical Indicators:RSI: 62 – showing healthy bullish momentum, not yet overboughtMACD: Bullish crossover and expanding, confirming strengthVolume: Notice the volume pick-up on the breakout, increasing conviction!🎯 Trading Plan:Direction: LONGEntry: $2,605Stop-loss: $2,572 (below recent cluster & MA200 for tight risk)Take-Profit 1: $2,656Take-Profit 2: $2,690💡 Confidence: Medium – watch for follow-through above $2,656 for extra confirmation!🔥 Extra Notes:Breakout traders, this could be the push for a new leg up. No bearish divergence on indicators; momentum is with the bulls. Watch closely for any fake-outs – a tight stop keeps risk controlled.Will ETH keep rallying or will the bears step back in?Drop your thoughts below! 👇🚀#ETH #Ethereum #Crypto #TradingSignal #Bullish #Breakout #TradingViewLet me know if you want to tweak it for an even punchier effect or add a custom hashtag!
CryptoAle992
Ethereum Trading Signal: Ready for a Rebound

Asset: ETH/USDTDirection: Long (Catching a Technical Rebound!)Entry: 2500 USDT (For extra safety, wait for confirmation above 2505–2510 USDT)Stop-loss: 2475 USDT (Just below key support—protect your capital!)Take-profit:Target 1: 2545 USDT (Right at the resistance cluster—first exit)Target 2: 2580 USDT (Bulls’ next challenge and Bollinger Band top)Confidence: Medium🧐 Why?After a strong downtrend, ETH hit a major support zone (2475–2490 USDT) and is showing signs of a technical bounce. RSI is flashing a bullish divergence, and the MACD looks ready to turn—classic setup for a short-term recovery!🚦 Trading Plan:Wait for price action to push above 2500–2510 USDT before jumping in.Tight stop just below 2475 to manage risk.Book profits at 2545 and ride the momentum to 2580 if bulls really come out to play!✨ Pro Tip: This is a tactical “countertrend” play—quick in, quick out. If support fails, step aside and let the bears run.Ready to ride the Ethereum bounce? Let’s catch this wave! 🌊🚀#Ethereum #ETH #CryptoTrading #TradingSignal #BullishRebound #CryptoCommunityLet me know if you want even more hype or a different style!
CryptoAle992
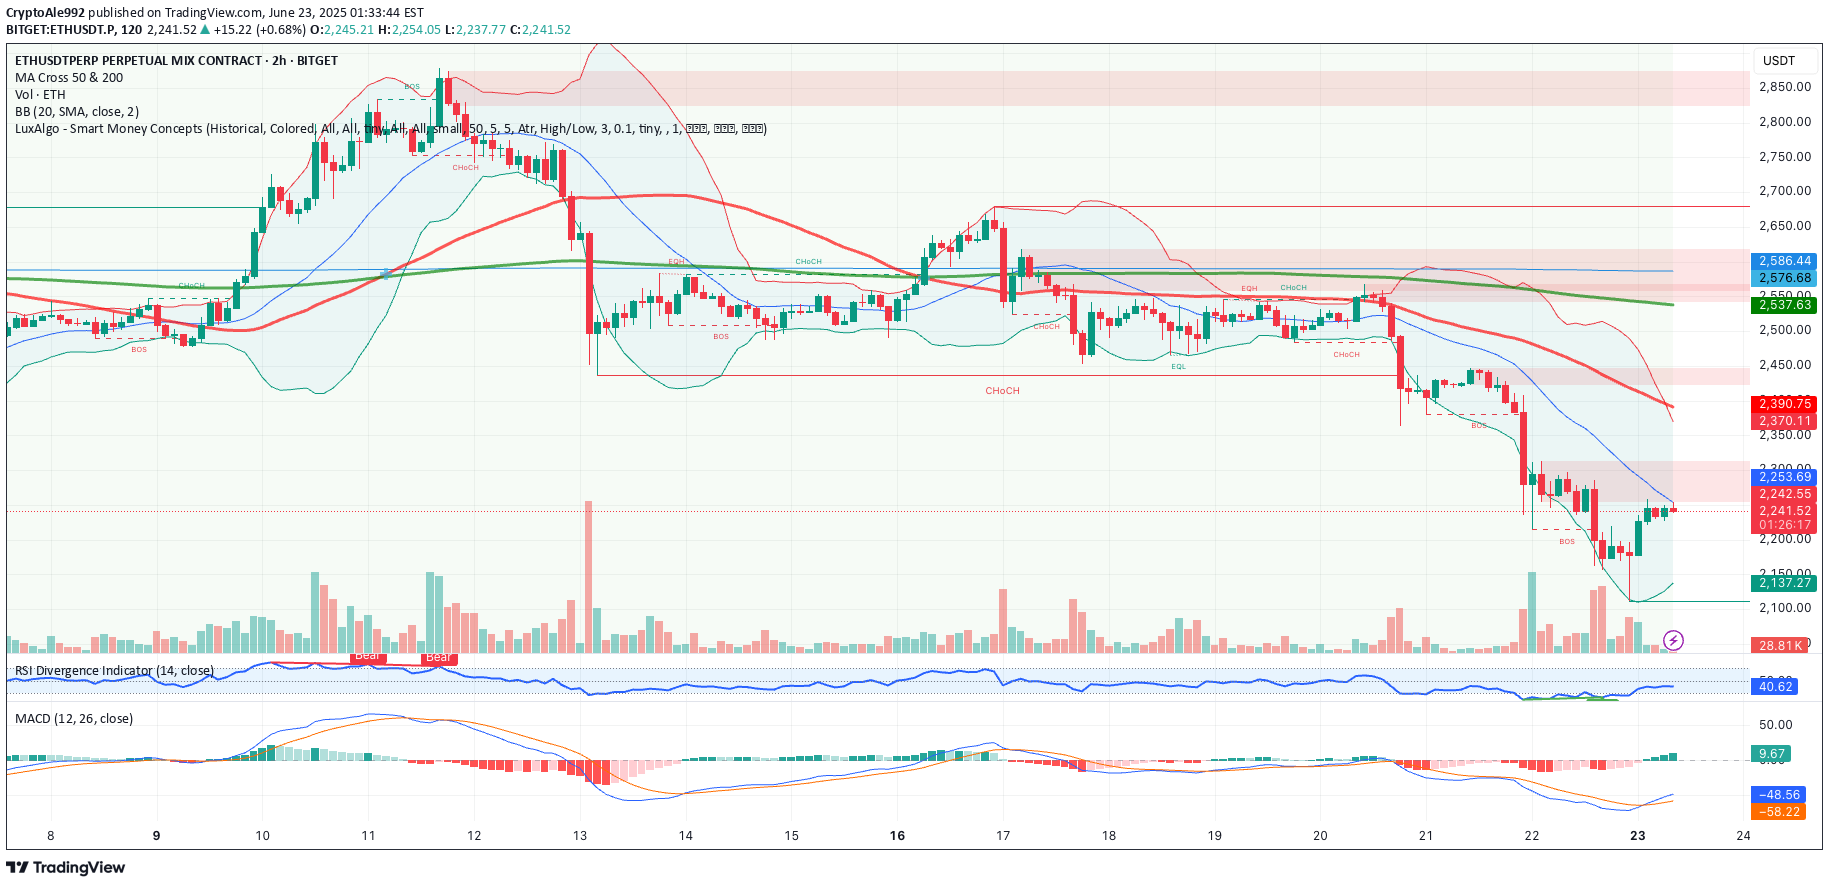
ETHUSDTPERP (Ethereum vs USDT Perpetual, Bitget, 1h)

1. Main TrendCurrently, the short-term trend is bearish:The price is below both the 50 and 200-period moving averages.The recent movement shows a clear breakdown below previous support levels.2. Key LevelsMajor support: 2,473 (evident from recent lows and corresponding to the lower limit of the Bollinger Bands).Key resistance:2,549/2,550 (coinciding with the 50-period MA and the middle BB band).2,589/2,614 (200-period MA and previous base of consolidation).Breakdown: There was a clear breakdown below 2,550.Breakout: Watch for break above 2,589/2,614 for a short-term reversal.3. Technical IndicatorsRSI: 38.83, in slight oversold territory, suggesting the selling may be slowing but with no strong bullish divergence yet.MACD: Still negative and below zero, but the distance between the lines is narrowing—potential early sign of weakening bearish momentum.Bollinger Bands: Price currently at or slightly below the lower band, indicating a possible technical bounce.4. Risk / OpportunitySuggested trading plan:Following a sell-off and with RSI in the lower range, there is a possibility for a technical rebound (mean reversion), but the overall setup is still fragile.Trading setup:Asset: ETHUSDTPERPDirection: LONG (attempting a technical bounce, a risky countertrend trade)Entry: 2,520 (current price/just below 2,525)Stop-loss: 2,473 (below the recent low, validated by the lower Bollinger Band)Take-profit:Level 1: 2,550 (test of resistance/mid BB band)Level 2: 2,589 (area near the 50-period MA and previous support now turned resistance)Confidence: LowAdditional notes:This is a contrarian trade; the main trend is still bearish.Avoid heavy exposure; consider small size or wait for bullish confirmation above 2,550/2,589 for a safer long.No strong pattern detected, only technical oversold conditions on the hourly indicators.If you prefer a trend-following setup:Short on a pullback between 2,550 and 2,589 with a stop above 2,614 and targets at 2,473/2,450.Summary: Short-term LONG setup for a potential bounce, but with elevated risk. Main trend remains bearish: be cautious and use strict risk management!
CryptoAle992
ETHUSDTPERP (Ethereum Perpetual on Bitget)

1. Main TrendCurrently, the 1-hour timeframe shows a sideways/weakly bullish trend:After a price drop, there is a recovery toward the moving average, but without clear directionality.Price is above the 200 SMA but lacks a strong momentum.2. Key LevelsSupports: 2,580 (200-period moving average and previous congestion area), 2,550 (local low and lower Bollinger Band).Resistances: 2,663 (50-period moving average and upper Bollinger Band), 2,718 (recent local high).Potential breakouts: A significant breakout above 2,663 could open the way toward 2,718–2,750; conversely, a breakdown below 2,580–2,550 increases downside risk.3. Technical IndicatorsRSI: Currently at 48, generally neutral (neither overbought nor oversold), indicating no extremes.MACD: MACD and Signal lines are very close and below zero, with no clear crossover; signals weakness/indecision.Bollinger Bands: Price has re-entered the bands after a downward extension; volatility is contracting.4. Risk/Reward & Trade SignalDirection: Long (moderate) — opportunity for a technical bounce at the support area.Entry: 2,605–2,615 (just above static and dynamic support).Stop-loss: 2,579 (slightly below the recent low and the 200 SMA).Take-profit 1: 2,663 (first target, aligns with the 50 SMA and immediate resistance).Take-profit 2: 2,718 (recent high for an extended move).Confidence: Medium (no strong signals, but a good setup for a technical rebound).Additional notes: No distinctly bullish or bearish patterns, but there is an attempt to hold support with a possible rebound. Watch for low volatility and potential “fake moves” as price interacts with the moving averages. This trade is suited for intraday/short-term strategies.Trade Signal SummaryParameterValueAssetETHUSDTPERPDirectionLongEntry2,605–2,615Stop-loss2,579Take-profit 12,663Take-profit 22,718ConfidenceMediumNotesRebound at 200 SMA and key support, watch for potential fake breakouts.If the price decisively breaks and closes below 2,579, the strategy should be reconsidered and a short position might be evaluated.
CryptoAle992
Asset: ETHUSDT (Ethereum Perpetual on Bitget)

1. Main Trend:Price is breaking upwards after a sideways phase.The 200-period moving average (green) is holding as long-term support, while the 50-period (red) has just been crossed decisively to the upside, confirming a potential bullish reversal in the short/medium term.2. Key Levels:Main support: 2,550 USDT (at 50 MA, just broken to the upside).Immediate resistance: 2,660–2,700 USDT (previous high). A breakout above this range would confirm a trend continuation.Breakout: The move is confirmed by increasing volume on the latest green candle.3. Technical Indicators:RSI: Currently at 65.82, close to overbought (70), but still has room to rise. No bearish divergences.MACD: MACD line is above the signal line, and the histogram is increasing—bullish signal.Volume: Rising during the breakout, indicating genuine participation.4. Risk/Opportunity — Suggested Trading Signal:Direction: Long (bullish)Entry: 2,630 USDT (current price or slight retracement to 2,600–2,615 USDT)Stop-loss: 2,545 USDT (below the 50 MA and last support, to avoid false breakouts)Take profit 1: 2,700 USDT (first key resistance)Take profit 2: 2,780 USDT (previous highs on the chart)Confidence: Medium–HighBoth the technical breakout and confirmation from the main indicators support the signal. Watch for RSI approaching overbought.Additional notes:Basic pattern: Bullish breakout from sideways consolidation.No bearish short-term formation.Macro factors: Monitor crypto market volatility; risk of retracement if traditional markets weaken.Summary (required format):Asset: ETHUSDTDirection: LongEntry: 2,630 USDT (or minor pullback to 2,615 USDT)Stop-loss: 2,545 USDTTake-profit: 2,700 USDT (TP1), 2,780 USDT (TP2)Confidence: Medium–HighAdditional notes: Breakout confirmed by high volume, bullish MACD, watch for short-term RSI overbought. For a more conservative strategy, wait for a confirmation above 2,660 USDT before entering.
Disclaimer
Any content and materials included in Sahmeto's website and official communication channels are a compilation of personal opinions and analyses and are not binding. They do not constitute any recommendation for buying, selling, entering or exiting the stock market and cryptocurrency market. Also, all news and analyses included in the website and channels are merely republished information from official and unofficial domestic and foreign sources, and it is obvious that users of the said content are responsible for following up and ensuring the authenticity and accuracy of the materials. Therefore, while disclaiming responsibility, it is declared that the responsibility for any decision-making, action, and potential profit and loss in the capital market and cryptocurrency market lies with the trader.