
Crypto-Swing
@t_Crypto-Swing

What symbols does the trader recommend buying?
Purchase History
پیام های تریدر
Filter
Crypto-Swing

While the world plunges into a complex array of issues that threaten social destabilization across multiple fronts, Bitcoin has shown an unexpected level of resiliency. Through the past two weeks is has climbed from $53.4k to $67.4k and in so doing has confirmed a large Inside Bar in the weekly timeframe (orange circle). This is a bullish formation, typically demonstrating a trend reversal and in this case, comes after 16 weeks of a 3-3-5 Flat Correction. What’s more, when we look at the daily chart, one can see a pretty clear impulsive 5-wave pattern to the upside from the low, demonstrating a notable change in sentiment. However, through the corrective period a well defined Head and Shoulders pattern has completed, with confirmed resistance of the neckline through July 6-12. That projects a deeper correction down below the $45.4k level, or towards the 1.618 projection of the A-wave from B (the top of the H&S pattern), which target also happens to be coincident with the S3 support level of the weekly pivot. The inside bar is strong though, and price moved quickly back to test the 0.236 level of the declining channel. In doing so, BTC has reclaimed many critical levels including the 1W 12MA, the 1W 20MA, and the weekly Pivot point all now offering support. And as I’ve pointed out in my last post, historically, between a Halving and the next market top, the BTC price has never closed below the lower level of the weekly Bollinger Band, which now currently sits at $58.4k and has only dipped below 52.85 on the RSI once before (from which it launched strongly to a new market top). In fact, even when one looks at the Wychoff model for Accummulation/Distribution, we can make a strong case that we are only just completing the Accumulation stage in preparation for significant price appreciation, with Distribution phases still well into the future. So, what do you think? Was the break of the neckline a false signal and we are about to take a moon shot, or is this rally just a bull-trap and a deeper correction will follow?
Crypto-Swing

Well, it’s a week after my previous post on the directional prospects for Bitcoin and it was the bearish case that won out. I noted a 3 Black Crows pattern in the weekly candlesticks had formed and bearish momentum in the MACD, which overwhelmed the levels of support that were in play. This week we can see the bearish momentum has continued with a large (16%) drop from $63.8k down to $53.4k at the bottom of the wick. And it is the nature of this wick that catches my attention. Here I’ll list a few of my observations: (1)We can see that the lower wick is long, indicative of strong buying off the $53k low. (2)A level of support has been confirmed at $52.9k. (3)This buying pressure has resulted in a false break of the declining channel. (4)Price found support back above the S1 level of the weekly pivot. (5)The lower Bollinger Band was temporarily broken, a first for the history of Bitcoin. So, while price has bounced back strongly from the weekly low, is there more momentum to the downside? Well, certainly the MACD is widening showing momentum in this time frame is downward and the RSI has broken a critical support level at 52.85. Most notably, the break of this level in the weekly RSI, between the Halving and next all-time high, has only happened once before . That was in July 2013, following a multi-week correction, after which price took off on its path to greatness. In fact, this was coincident with a widening MACD It would seem that, despite bearish momentum, price declines could be exhausted if history is a guide. Looking at the daily chart and we see a very interesting occurrence of a Dragon Fly doji followed by a strong bullish candlestick. Indicative of a trend reversal confirmation. The lower BB has offered support and price is only $500 off reclaiming the support of the 1D 200MA and the 0.786 of the declining Fibonacci channel. In Elliot Wave terms there is an apparent completion of a 3-3-5 Flat Correction (red ABC wave), that resolves at the 1x projection of A from B, and a rising RSI from over bought territory and along bottoming MACD. If price can reclaim the 1D 200MA and the RSI break back above its declining trendline, then there could be cause for bullish optimism. What do you think? Is pricing falling further to $50k (S2 & 1.236 Fib projection for C) or maybe even 48K (the 1.382 projection of the C-wave)? Or has price turned around and we’ll shoot back above 64K after reclaiming the 200MA?
Crypto-Swing
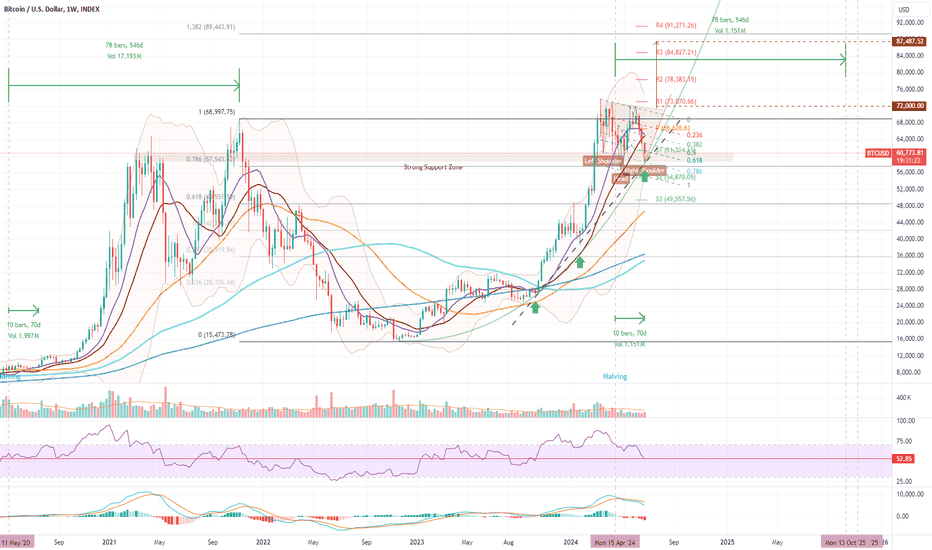
As we prepare to roll into the 11th week after the Bitcoin Halving event, we can see that the typical price oscillations creating fear, uncertainty and doubt in the new investors have been playing out. However, there are many indicators that suggest that the BTC price is well supported and is setting up for a nice rally into OCT-NOV 2025, but of course, there are some bearish concerns also. Here are some of my observations: Reasons to be Bullish Lines of Support – Price has bounced nicely off a convergent area of support, where we see a strong raising support line (Black dotted), converging with the 0.786 fraction of the declining Fibonacci channel, coincident with the lower wick of this week’s candle. Zone of Support – this week has also seen price continue to test a strong zone of support between $58k & $61k, which it has been bouncing off since March. This also aligns with S1 support level of the Monthly Pivot. Fibonacci Retracement – Support is also seen at the 0.786 level of the Fibonacci retracement from the previous all time high also sits just under the wick of the weekly candle. A climb back about $61.4 will reclaim both the S1 Monthly Pivot level as well as the 0.618 level of the declining channel. Just $550 above the current price. Bollinger Bands – Here we also see the lower Bollinger Band rising to support the price as the upper band is falling to squeeze the range. It’s worth noting that the lower BB has never been broken between a halving event and the next all time high. Moving Averages – the 100MA is rising toward a bullish cross above the 200MA. RSI – we see a pivotal line of support being touched, from which has operated as a floor for previous post-halving bull runs. Inverse Head & Shoulders – The price action since march has traced out what could well be an iH&S pattern, which will be confirmed if price doesn’t fall back below $56,522k and can rise back above $72k. Given the above setup of supports, such an event would see a pretty quick run towards c.$90K, the 1.382 retracement level of the previous bear market. Reasons to be Bearish MACD – Here we see that short-term MACD demonstrates is still accelerating to the downside. 3 Black Crows – the past 3 weeks have seen successive lower lows in overlapping candlesticks. This can be a bearish setup indicative of a significant corrective period beginning. What do you think? Are we about to see an extended correction, perhaps to $48.5k at the 0.618 retracement level of the previous bear market? (This would be a nice setup for a large Cup & Handle pattern.) Or, are we about to turn the corner on this correction and drive back up over $72k for a rally to new all-time highs?
Crypto-Swing

Looking across the Altcoin market, wondering whether we have capitulated or not, I notice DOGE presents a very useful example of the perilousness of the Alt-coin situation. Looking at the standard daily chart, let’s consider the bearish and bullish cases: Bearish Case Firstly, we see a multi-month Head & Shoulders pattern, with pricing sitting just above the neckline. If price confirms a break below that neckline, the H&S pattern projects a potential decline to $0.01094. Let’s call it 1 cent. That’s over a 90% loss in value from the current price. Price has broken support of all the Moving Averages, is not supported by a weekly Pivot line, and is desperately clinging to the 50% retracement (of a prior A wave). In this scenario, there are also attractors pulling the price lower: The C-wave – is usually broken into a 5 wave movement down, and could be considered complete, except that it typically reaches a 0.618 or greater Fibonacci projection to the downside (of A from B), although not always. Untested Support – clearly visible are two lines of Untested Support, at $0.10716 and $0.09046. The lower value which is coincident with the 0.786 projection of the Fibonacci Retracement. Indicators – the MACD has not eased its decline, even steepening in the last few days, showing momentum is down. Bullish Case I admit this is not as easy to argue, however, while price remains above $0.115, there is hope! So, we can say that as long as price holds the 0.5 Fibonacci Retracement level, there's a chance that we could pivot higher and reclaim support of the 200MA (dark blue), and the S1 Pivot line. XABCD - Supporting that is the XABCD Gartley harmonic pattern, with all lines sitting in Fibonacci proportions and a broad XD base at 0.786.What’s more, the low of today at D, came down to touch perfectly the 0786 retracement of the XA move. Indicators - The RSI is just entering overbought territory, which is usually a sign that a low is close or has occurred. Volume – is as low as it was before price began moving in March, with a little selling spike which seems to precede a reversal in trend. Moon Phase – there is 3 days to the Full Moon, which seems to follow an upswing by a couple days, meaning we could be touching a bottom now. So, it’s all about that neckline. A confirmed break below $0.115 and we could see the floor give way. Or if it holds, we could see a major bullish reversal after price reclaims a few support levels. What do you think? Is a post-halving collapse of the Alt-coin market likely? Or is Alt-season about to kick off?
Crypto-Swing

Observation After 58 weeks of price rising within a well-defined channel, Bitcoin has hit the top of that channel, while tracing out an almost perfect Cup formation. Considering the sustained over-bought conditions of the weekly RSI and a MACD that is rolling over, it seems that BTC is ready to correct and build a Handle to complete the Cup formation. Correction Target With unconfirmed support at around $30.5k, coinciding with a 50% retracement of the move from $15.4k, and the 1W 200MA, it would seem a minimum correction to around $30.5k is in order. Below that we see the 61.8% ($27.0K) Fibonacci level coinciding with the bottom of the rising channel, with strong support demonstrated around $25.2k. So, it would seem like a safe bet for a target in the price range from $30.5k to $25.5k over the next 6 weeks or so. Other considerations Other lines of convergence – Just above the 78.6% Fibonacci retracement level is where two lines of support (black dashed) converge with the 1W 300MA at around $23k. Unconfirmed Support – below all else is an level of unconfirmed support at $18.4k where price was rejected on Dec 12, 2022. Bitcoin does not typically leave these levels untested, so in the case of some geopolitical black swan event, this level could come into play.
Crypto-Swing

BCH – an interesting setup Looking at the recent interest in BCH and the short-term strength being displayed in BTC, I notice there is the potential for BCH to continue to out-perform BTC in the next move. In this chart we see what appears to be a wave 4 correction and a bullish pennant that looks to be breaking to the upside. All this is occurring above the weekly pivot point with the next level of resistance around $390, just above the 1.618 projection of the wave 4 correction. Could this portend a 38% gain? It’s a possibility, as long as BTC continues to show some strength. But will that exhaust the recovery rally? A lower high in the RSI and MACD on this move could manifest a strong bearish divergence so we will have to wait and closely watch how things play out. In the short-term, however, it looks like a burst higher might be on the cards.
Crypto-Swing

In this study, I take a close look at the Elliot Wave structure of the movement since March 10 to make sense of this crazy consolidation we have been witnessing since March 23, in the 4-hr chart, refining the wave count of the previous study. Currently sitting on the weekly pivot of $28k, I see a corrective wave structure that has developed, that not only includes two successive symmetric triangle formations, but both being part of a complex irregular Double Three (WXY) correction with a price target of c. $24k. Approximately a $14% correction from the current price. A break below the bottom of the triangle support line could be the trigger for a deeper drop. A confirmed break above the upper resistance line of the triangle will invalidate this scenario. What do you think? Will we see a breakdown towards $24k, or a continuation of the rally up over $30k?
Crypto-Swing

With the Price Divergence growing stronger in the RSI, MACD and Volume, the recent peak to $29.1k in BTC looks like a point from which to correct. In this study, I show the convergence at the $25.5 zone of the 0.5 level of the rising channel, the 1W200MA, the 1D50MA, the 0.618 level of the rally to $29.1k and the Unconfirmed Support level at $25.2k. What do you think, are we in for a 10%+ correction to test the unconfirmed support level around $25.2k? Seems so to me.
Crypto-Swing

As the number of newly transacting Bitcoin addresses continues to surge in the wake of the SVB Bank Run and failure, the price of Bitcoin is showing a clear Sign of Strength in Wyckoff terms, by rallying strongly through the $25k zone of resistance. In more general TA terms, we can see this as a move above the neckline of a large Inverse Head and Shoulders pattern. A confirmed close above this neckline will be a major trend reversal signal projecting a price move to around $36k and possibly eventually even higher towards $40k, $43k, or even $48k. In the weekly chart, the Hammer candlestick, finding support on the 1W 20MA, followed by large, green engulfing bar also looks decidedly pivotal. This is all predicated on a close above the neckline in both the daily and weekly views, but there appears to be strong reasons for the Bulls to be confident here. What do you think? Where will Bitcoin stop on its movement higher? Or is it all just another bull-trap and MtGox coins are about to flood the market, driving prices to new cyclical lows? 😊
Crypto-Swing

In this study, I show the Rising Wedge that has broken down, driving the recent drop, with price finding the support line of the Bullish Megaphone structure for a 3rd time. The current challenges in this chart for bulls to overcome are: The break of the Wedge projects a movement below the support of the Megaphone; A Bear Flag is formed The downward Elliott Wave count is 4, with a 5th leg to go; A break below $21,351 means we are going lower; Once $21.3k breaks, the next support levels are $20.4k and $18.4k. On the other hand, if price can find support above 21.4k and rally, then we could be in for an explosion toward $40K. This is because the Wave 5 (marked in Green) would suddenly transform into a minor Wave 1 and indicate a commencement of a wave 3 leg higher. The good news is, whether it’s a rally from $21.5k, $20.4k, or $18.4k, it certainly seems like the trend is up. What do you think? Are we going towards $40k in quick time, falling back towards $18k before rising higher, about to break down completely and sink back into a continuation of the bear market?
Disclaimer
Any content and materials included in Sahmeto's website and official communication channels are a compilation of personal opinions and analyses and are not binding. They do not constitute any recommendation for buying, selling, entering or exiting the stock market and cryptocurrency market. Also, all news and analyses included in the website and channels are merely republished information from official and unofficial domestic and foreign sources, and it is obvious that users of the said content are responsible for following up and ensuring the authenticity and accuracy of the materials. Therefore, while disclaiming responsibility, it is declared that the responsibility for any decision-making, action, and potential profit and loss in the capital market and cryptocurrency market lies with the trader.