
Cousin_Fat_Fat
@t_Cousin_Fat_Fat

What symbols does the trader recommend buying?
Purchase History
پیام های تریدر
Filter
BTC Rally to $100K

BTCUSD In 2023, Bitcoin: Rallied off the lows Broke through the ML Retested and put in a base along the top of ML Now in 2024, Bitcoin is breaking out from that base. Hopefully, volume will confirm over the coming weeks. (Screenshot below) But... there is no sense in waiting if you aren't "in" already. Near perfect long setup as it is, plus BTC halving is about to take place sometime in April. Get Long. Take profit at the upper ML-H or move your stop up right below upper ML-H once it gets there. Fat_FatHopefully, volume confirms over the coming weeks. When/if it does, BTC may start going exponential. Especially as we get closer to the halving.
Decentraland 100 Bagger (Boom or Bust Lotto Ticket)

MANAUSDT This isn't an investment idea, it's a lotto ticket. No real analysis here.... I'm just hoping that a combination of a crypto bull market and Apple's VR headset launch in 2024 throw this silly Metaverse coin into the stratosphere. Technically, it just needs to match the previous cycle's run on a percentage/time basis. (Market Cap would be somewhere around $100 Billion or more if this works out, which is insane and demonstrates how unlikely this is) Obviously, this is a boom-bust play and odds are that it goes to zero. However, if you are a gambling man/woman and accept the boom-bust odds, maybe it's worth a flyer? Fat_Fat
Long Algorand

ALGOUSD Long Algorand Targeting the intersection of the trendline and median-line. which also coincides with the 1.0 Fib Extension. Price Target = $2.30 - $2.50 Time Target = Feb '25 - May '25 Fat_Fat
Coinbase Breakout
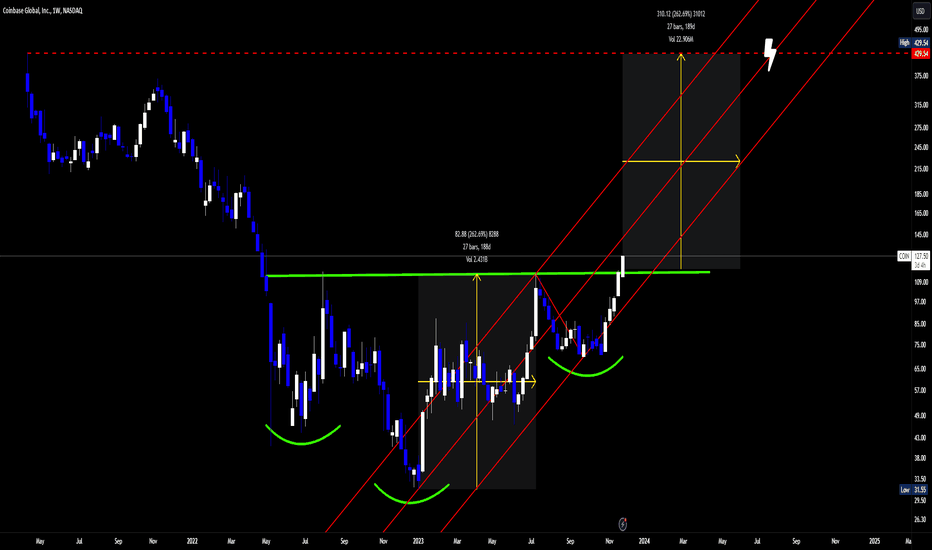
COIN Coinbase Weekly chart is breaking out of an inverted head & shoulders pattern. The move from the lows to the neckline of the pattern is about 262%. A 262% move starting from the neckline will take Coin right back to the ATH from the IPO, $429. Fork intercepts the ATH in late July 2024. Staying long if the price stays within the fork. Fat_Fat
Bitcoin: Last Leg of the Bear Market

BTCUSD BTC has put on an impressive rally from the November ’22 lows. (+105%) Now, it looks like it’s about to start turning over again for what I believe is the leg of the bear market. The Red Median Line set is drawn from major pivots: Dec ’17 high, Dec ’18 Low, and the Nov ’21 High. I plotted a (yellow) minor fork on ’22-’23 price action to show a potential path to the major (red) Median Line. Other Factors: -RSI Bear Div -Ichimoku Cloud Bearish -VWAP from the highs holding resistance. -Strong Dollar -Continued bearish price moves in equities/risk assets *Screenshots Below* I’m expecting a final flush for BTC to approximately $9,000 - $10,000, or a 65% decline from the current price level. This is also roughly in line with previous cycles. 2015 - 2018 Bull/Bear Cycle: (Bull Market High = $19.8K, Bear Market Low = $3.1K, 84.3% decline) 2018 - 2024 Bull/Bear Cycle: (High = $SWB:69K , Low = X, 84.3% decline) X = $10.8K = Low Fat_FatWeekly Ichimoku CloudWeekly Bear DivergenceAnchored VWAP from the ATH9/20/50/200 Weekly EMA Ribbon
SPX/NDX Double Play
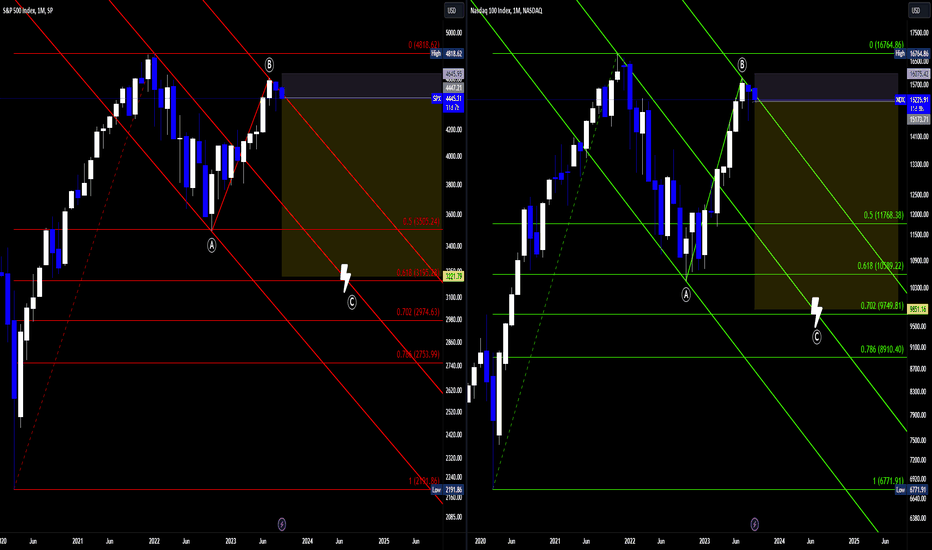
NDX SPX 1:6 R/R Shorts C Wave en route Short it Fat_Fat
SOLANA DUMP INCOMING

SOLUSD SOLANA DUMP INCOMING Why? - USD Strength - Weekly uptrend line broken - Leaving Mod-Schiff Fork - Weekly MACD Bearish Cross - Weekly DMI Bearish Cross (Pending) Don't let the log-scale chart fool you. We're looking at a return to $8 (December '22 low), or an even larger decline to $5 (the Aug '20 high) That's a 50% - 70% drop from current levels. Short it. Fat_FatWeekly MACD Bearish CrossWeekly Ichimoku Cloud is looking bearish50-70% percentage declineThere are rumors circulating about a potential liquidation of FTX SOL holdings....Approximately $128 Million USD value in Solana currently owned by FTX.
SPX Elliot Wave Roadmap
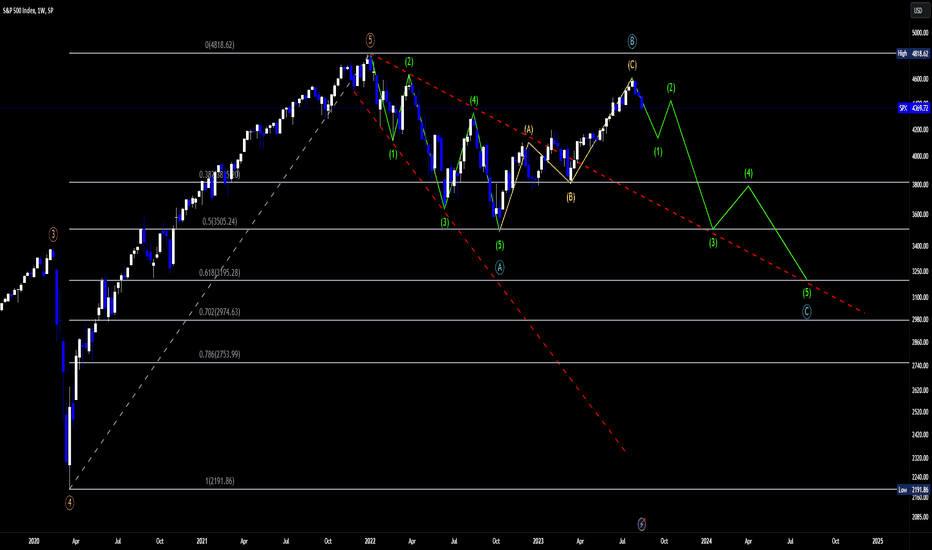
SPX Overall ABC Corrective Pattern = Zig-Zag Wave A: Leading Expanding Diagonal *Important* Wave B: Zig-Zag Wave C: 5 Waves down In my opinion, if you don't have the initial downtrend from January '22 - October '22 labeled as a leading expanding diagonal, you are going to miss a lot of context for the rest of the correction. (See Screenshots below for explanation from pg 40 of Elliot Wave Principle) Leading Expanding Diagonals are either five sets of 3-wave sequences, or a less typical formation of 5-3-5-3-5 overlapping waves that extend outward in an expanding diagonal formation. I believe Jan '22 to Oct '22 was the less typical 5-3-5-3-5 variety. Leading Expanding Diagonals are typically followed by deep retracements. To support this, Wave B was a bear market rally that extended to the deepest retracement level that maintains zig-zag structure (0.854) Now I believe, we are finally entering Wave C to complete the Zig-Zag. Wave C typically extends 61.8%, 100%, or 123.6% of Wave A (Can go further but typically not past 161.8%) Sticking with a 100% A:C extension as a baseline; I'm expecting Wave C to get down around 3200. This conveniently lines up a few points above the .618 retracement level measured from the Covid Low to Jan '22 ATH. SHORT IT. Screenshots Below. Fat_FatLeading Expanding Diagonal - Pg 40 - Elliot Wave Principle85.4% Retracement - Wave BWave A = Leading Expanding Diagonal (5-3-5-3-5)If Wave B top is maintained, Forks, Fibs, & Waves point to an August/September 2024 finale at 3200 SPX
Gold Wave 2 Correction (Pre-Moonshot)

GOLD Gold dropping back here. Completing Wave 2 down. RSI Bear Swing Rejection/Bear Div. Short now, but I'll eventually look to buy the bottom of Wave 2. Fat_Fat

Disclaimer
Any content and materials included in Sahmeto's website and official communication channels are a compilation of personal opinions and analyses and are not binding. They do not constitute any recommendation for buying, selling, entering or exiting the stock market and cryptocurrency market. Also, all news and analyses included in the website and channels are merely republished information from official and unofficial domestic and foreign sources, and it is obvious that users of the said content are responsible for following up and ensuring the authenticity and accuracy of the materials. Therefore, while disclaiming responsibility, it is declared that the responsibility for any decision-making, action, and potential profit and loss in the capital market and cryptocurrency market lies with the trader.