
Consistent_Trades
@t_Consistent_Trades

What symbols does the trader recommend buying?
Purchase History
پیام های تریدر
Filter
Consistent_Trades
طلا در آستانه سقوط خطرناک: تحلیل تکنیکال برای خرید زیر ۳۲۰۰!
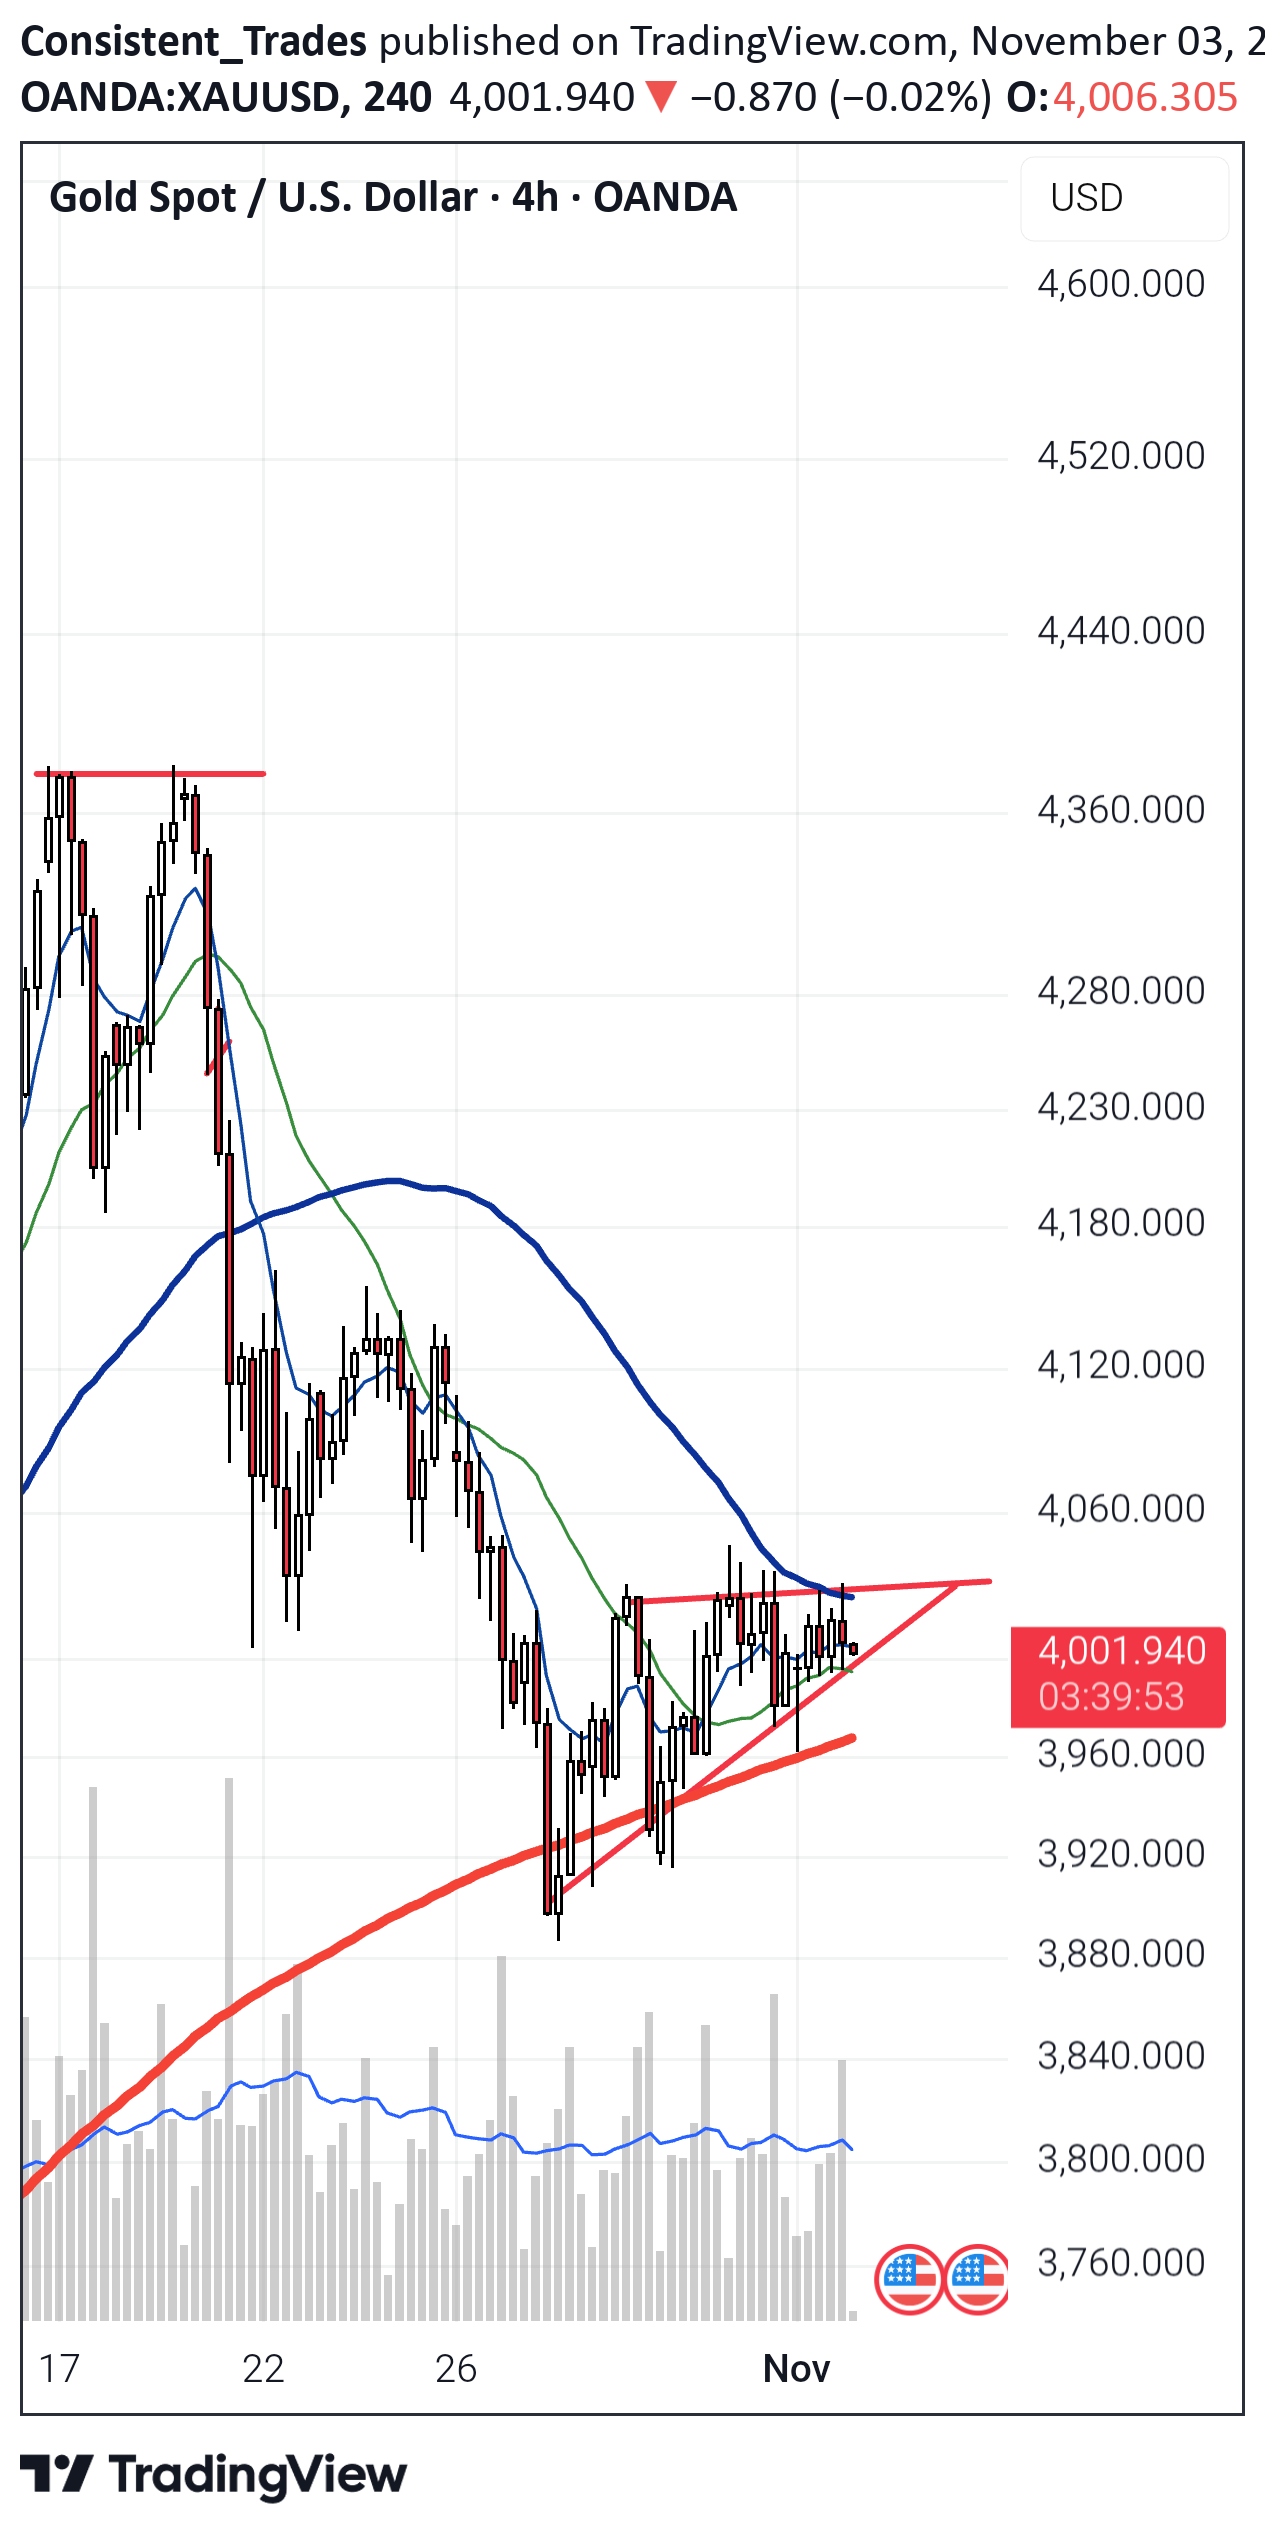
After massive drop, gold recover litle bit but now is in dangerous bear pull back formation. Chart is on 4 hour. With break below down trening Line, gold will be infocus due to the 200 4Ma, which if break drop will be strong and fast. Zone where gold is buy is just above Ascending triangle breakout at 3200
Consistent_Trades
بیت کوین در آستانه سقوط بزرگ: والهالا یا جهنم؟ (تحلیل کلیدی 200 روزه)
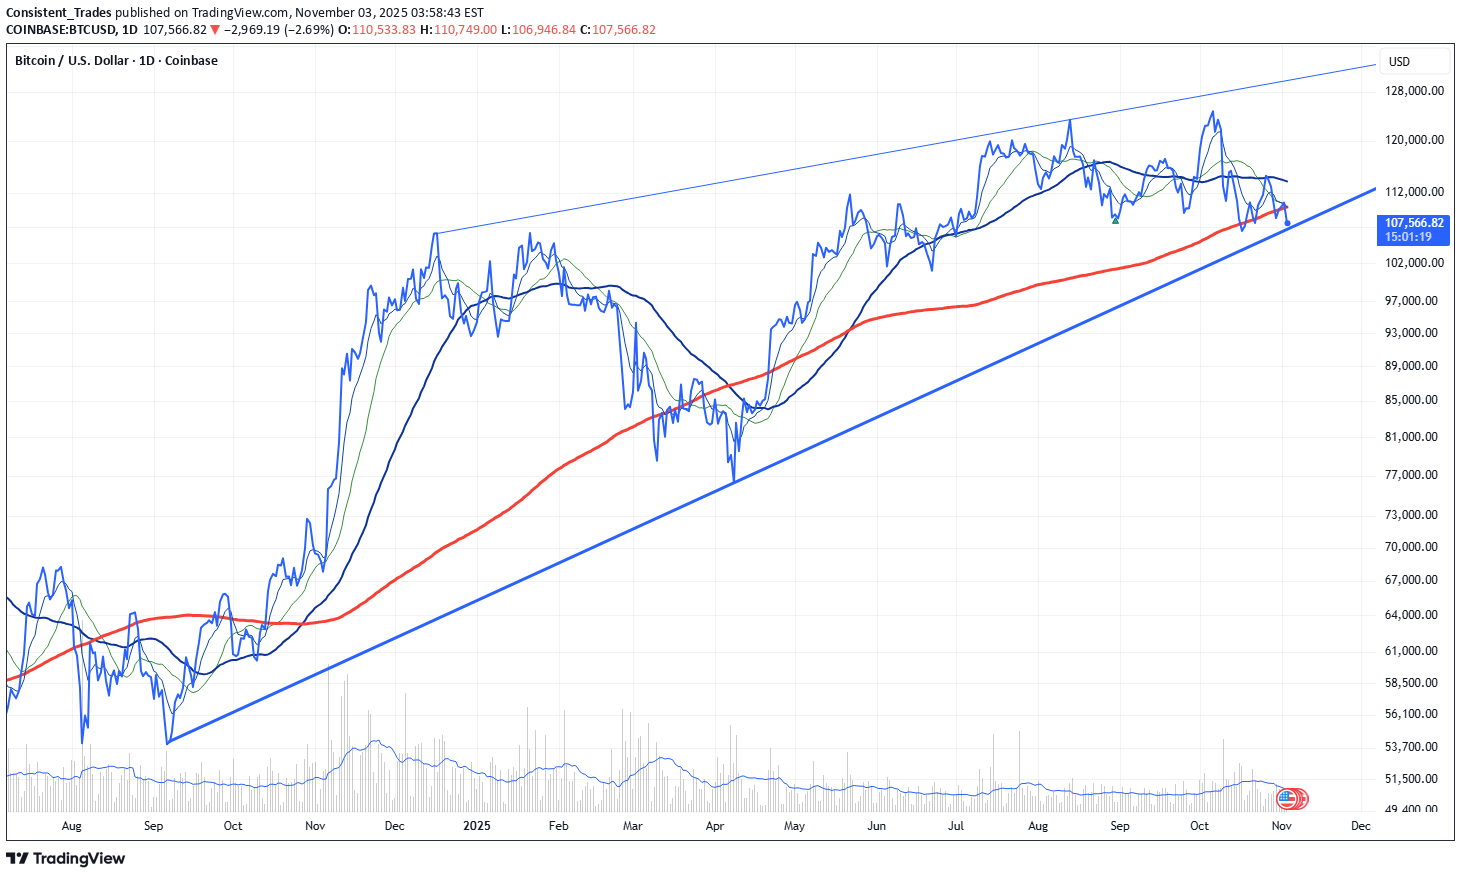
Bitcoin (BTC) is currently trading within a rising wedge, which is a bearish pattern—but only if it breaks below the lower trendline. Crucially, we are currently trading below the 200-day Moving Average (MA), which is a very dangerous signal. If we break below the rising wedge's support line and confirm that breakdown, we could see a massive and fast drop in the BTC price. Hell could open up, with the price dropping to $85k in just a few days. We urgently need a bounce, and we need it now!
Consistent_Trades
اتریوم در آستانه انفجار: تحلیل تکنیکال قوی و پایان افسانه چرخه ۴ ساله!
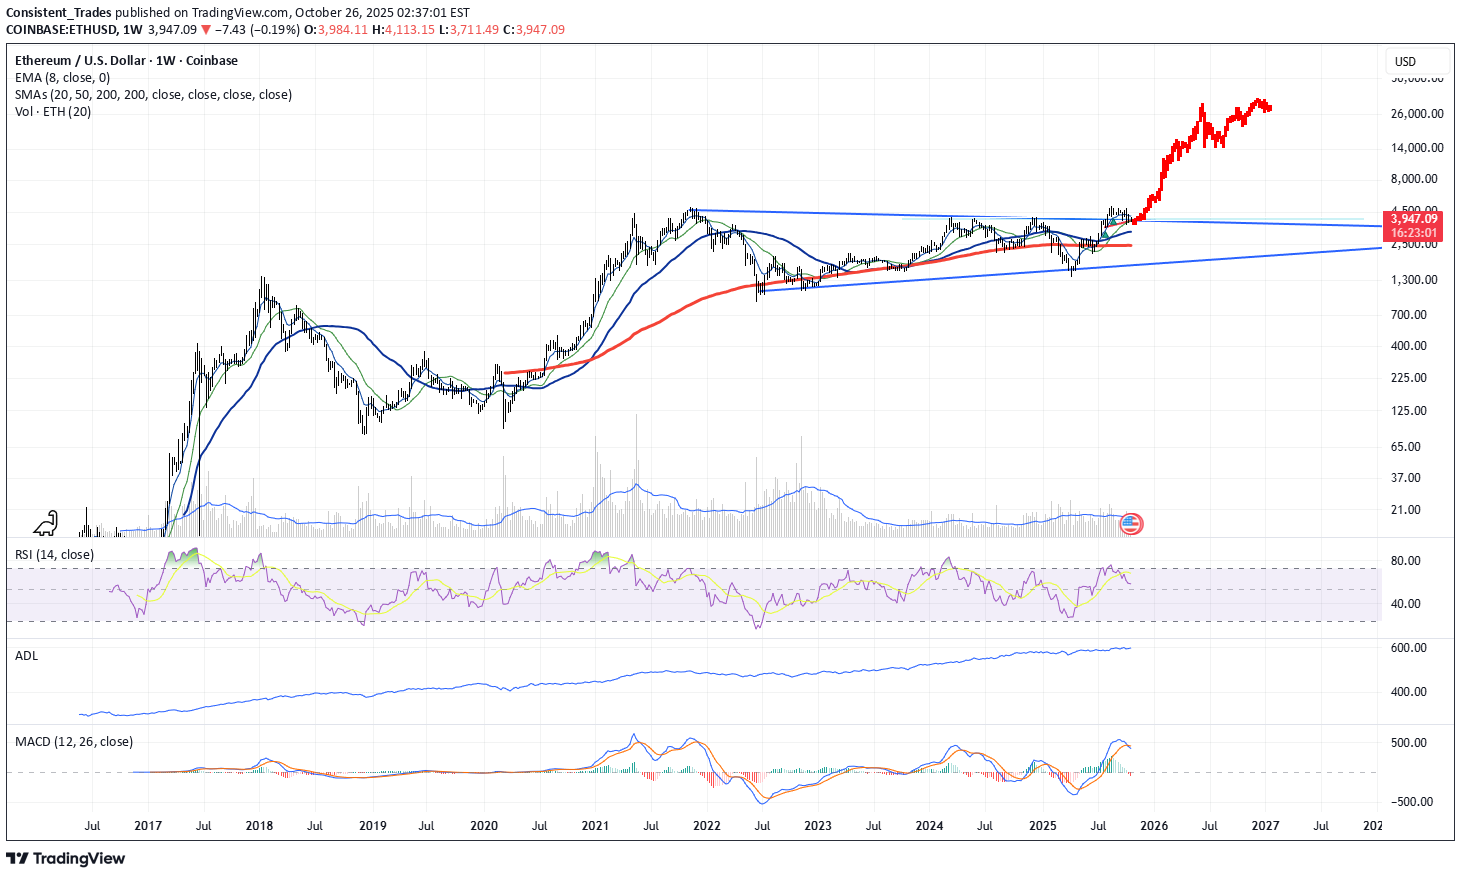
TA view ETH successfully broke resistance in July and retested that line. The line is now holding perfectly as support. This line represents a huge symmetrical triangle, which is one of the most bullish patterns in TA, especially when followed by a confirmed retest. The RSI has cooled down and is ready for the next move up, suggesting there is momentum room for a sustained rally. Interestingly, the Advance/Decline Line is moving up while the ETH price is currently dropping, which is an extremely bullish divergence. The MACD (Moving Average Convergence Divergence) is showing slight negativity, but it will "heal itself" as soon as the price starts moving up. It is possible that the move will be similar to 2021. Macro Outlook The End of the 4-Year cycle. The most important point is that the talk of a 4-year cycle is a lie; it does not exist. The current environment is different from 2021 and 2017. In 2017 and 2021, we had significant issues with the stock market, inflation, and rising interest rates; now, the opposite is true. Therefore, forget the 4-year cycle. Crypto will move like the stock market from now on, forever. People will finally accept this once Bitcoin (BTC) breaks its All-Time High (ATH) this year and definitively proves the cycle narrative is dead.Same chart, only on a daily basis. It's amazing how it respects the support line. This is tell tell story for ETH bullish scenario. Turbo bullish if you ask me. That is for the TA. What about other news? Rate cuts, QE starting in 4 days, money printer go brrrr, China USA deal is on the table... Jesus, this will move faster than 2021. Guys, you won't be able to catch it once it starts to move.
Consistent_Trades
Consistent_Trades
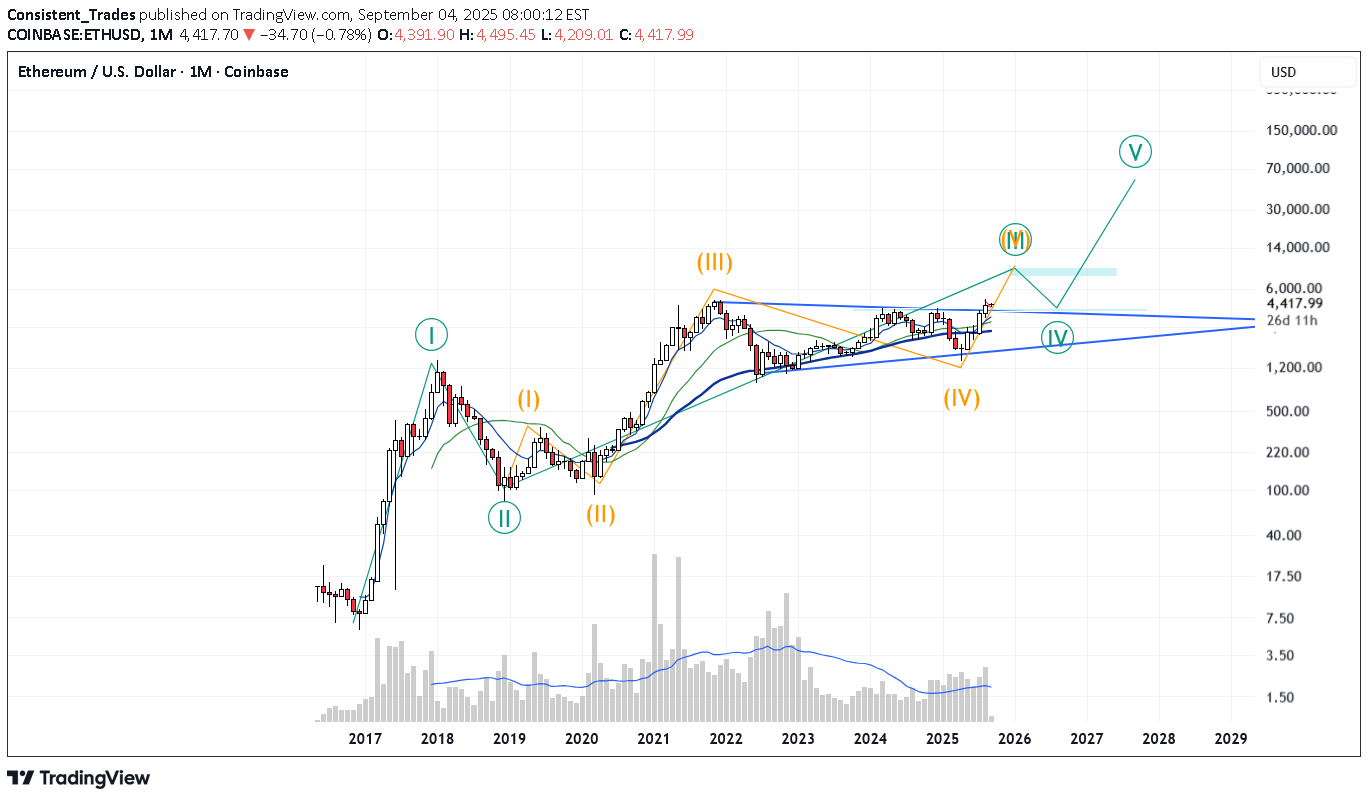
ETH Textbook Retracement Before a Mega Pump and Huge Alt Season
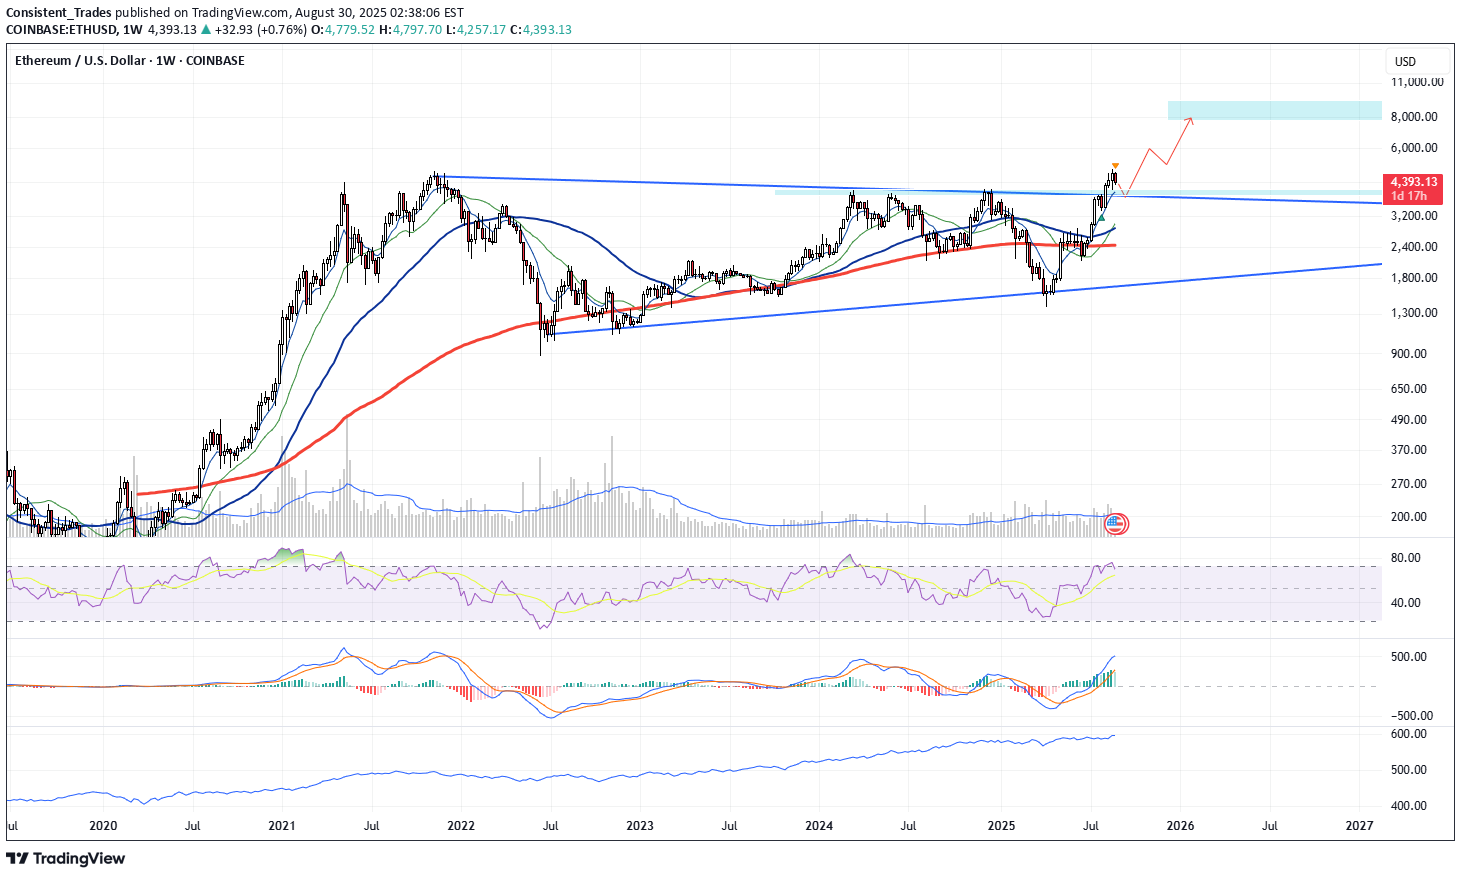
ETH made a very strong breakout when it broke through the main trendline. It broke out of the symmetrical triangle and reached a new ATH, which is extremely bullish. The breakout also happened on higher volume, which is another very bullish signal. However, since charts usually retest the breakout level, it’s realistic and even healthy to expect ETH to correct down to around 3800 — where the trendline it broke lies, along with the multi-year symmetrical triangle, and the triple top from 2024. After that correction, it’s realistic to expect a strong move upward, with more than an 80% probability that ETH will rally toward 8000. My analysis is based on the fact that there is massive support at that level, and 3800 is likely to hold, after which ETH will very likely take off together with BTC, SPY, and the broader market. Interestingly, my analysis of BTC and SPY also shows that all three indexes need a small correction before entering a huge new rally.Anything else to said? Now ETH has to hold 3700-3800 and we will see 6k in 30 days.Jesus, this is the biggest and badass ascending triangle on the Total market cap without ETH and BTC. This will be the best and strongest altseason ever.
Consistent_Trades
BTC Close to the Top, but not yet reached
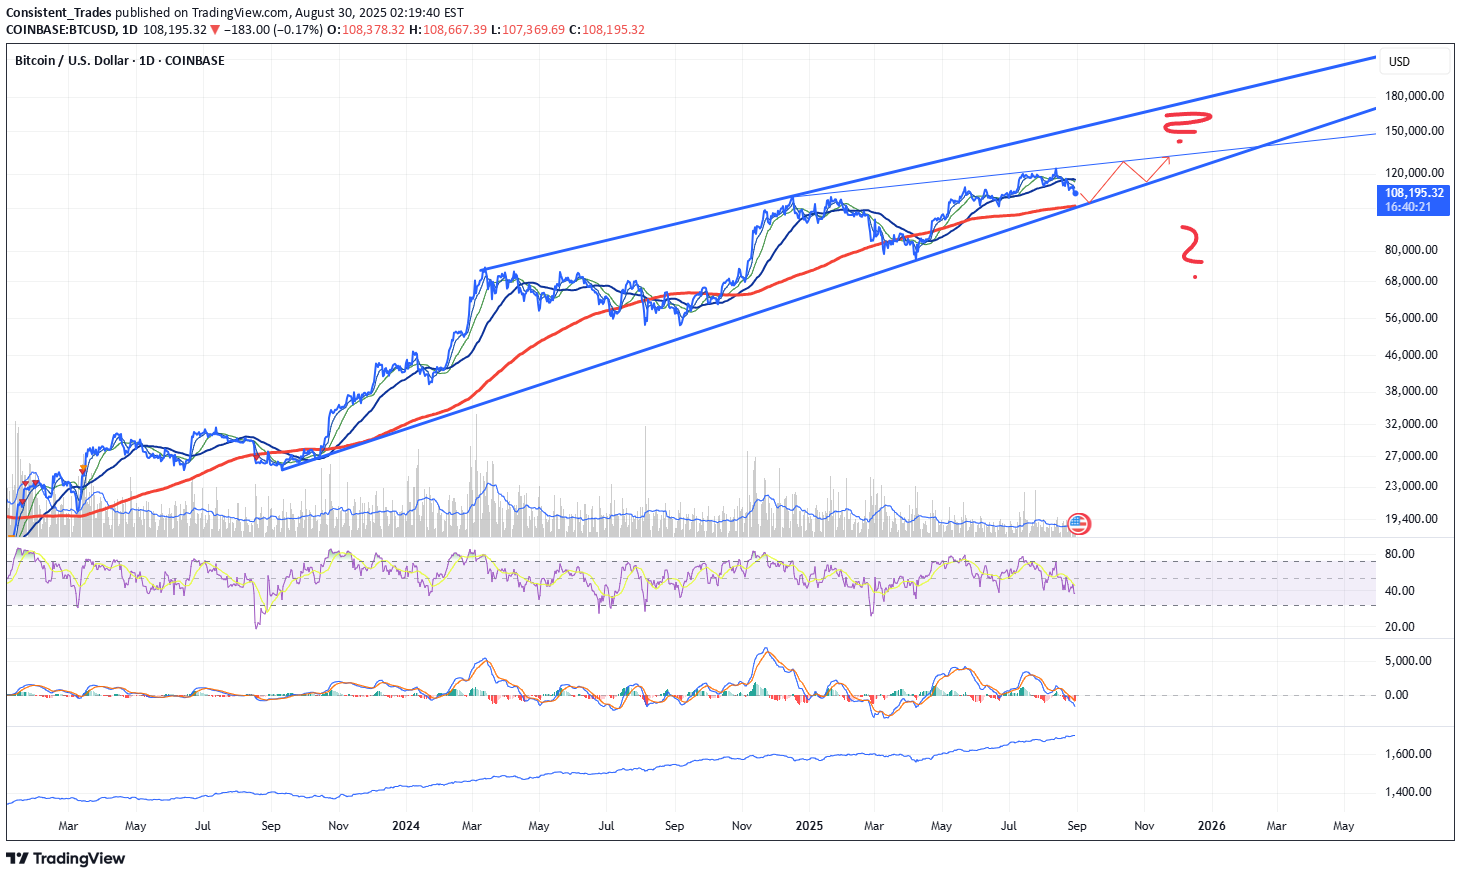
BTC is currently in a corrective phase and will very likely continue its correction toward 100k. There’s an 80% probability that 100k will hold as support because that’s where the big red line (200-day moving average) lies, alongside a very strong trendline, and by then it will most likely already be in oversold territory in RSI. All of this would enable Bitcoin to start a new move toward a fresh ATH. However, momentum is slowing down, and Bitcoin is not showing the same strength as before. This is evident because this time it failed to reach the strong upper trendline (the “thick blue line”) and instead stopped earlier. A rise by the end of the year is probable, but BTC is currently trading within a large rising wedge formation. A breakdown below the lower trendline would signal a move to at least 75k, if not lower. For now, the outlook remains bullish. We’ll continue analyzing and see what happens after the upcoming bounce and the attempt at a new ATH.
Consistent_Trades
ALT season is here - this is huge, huge
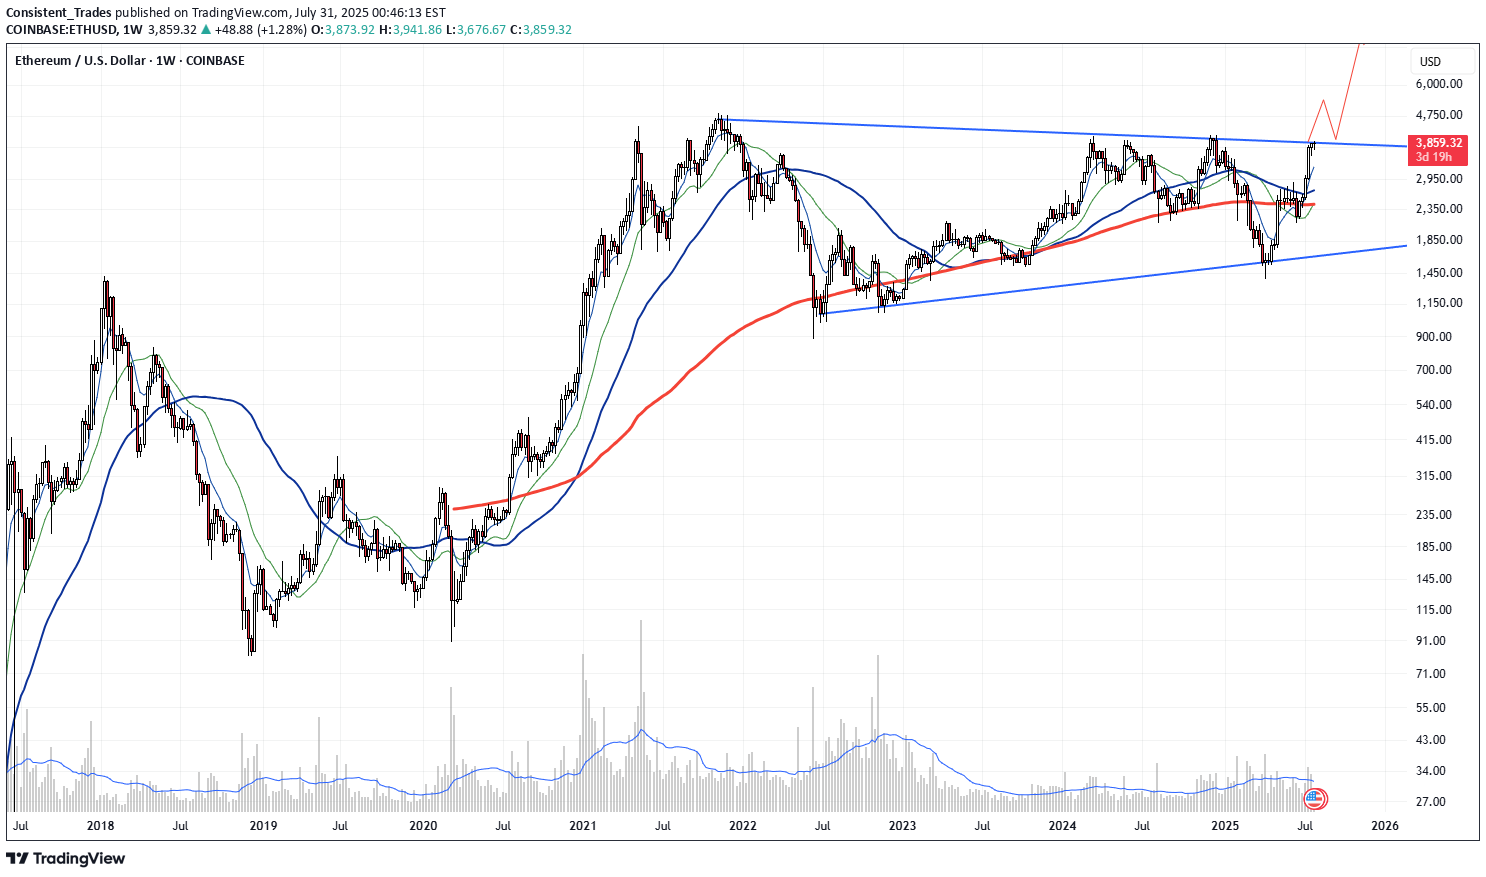
ETH is in an enormous symmetrical triangle on the weekly chart and its crossing upper line. If the week finishes above 4000, nobody can stop this. Running to 6000 without stopping is almost certain. After it needs to relax and the alt season will explode. This seems to be just a new life opportunity.And boom — ETH pumped above the resistance line. There’s no resistance at all now. It’s time for margin calls, shorties bye-bye, and then the epic alt season will start.
Consistent_Trades
ETH is security!

ETH is security according to SEC and that will be announced pretty soon. ETH finished the cycle from an early start to Dec 21 ATH and didn't reach it anymore. Now ETH is in huge ABC correction which needs to correct the whole move from its beginning to ATH. Having in mind the power that SEC has, having in mind what they did yesterday to Coinbase and what they are doing to Ripple, it is expected for Rripple to reach 200 at the end of correction. After ABC is finished, ETH will start its monster move up towards 10k and more. Short to mid-term is very bearish, in the long term it is very bullish. Trading is the best option or monthly buying with the same amount of money.
Consistent_Trades
Running flat or expended flat

Bitcoin is likely finished his B sucker rally and now is ready for C from or Running flat correction or expended flat. Having in mind that BTC didn't retest support formed from JUN 2019 till SEP 2020 I am more toward it will be nasty expended flat correction with targets from 7 to 11k. I understand BTC has ETF now, and I understand we have Blackrock now. Still, we also have to understand the economy, the rising USD dollar, Yield inversion, recession in front of us, inflation, etc. IN the end, even though I'll have hundreds of attacks from perma bulls now, don't forget this is a very bullish count with a target above 500k in a few years!!!On weekly BTC looks horrible. If we close like this or even lower, I could say 90% chances are we had top! A huge bearish reversal candle shooting star doesn't look good.Perma Bulls, rather buy now because the monthly chart looks very very sick and sad. Bulls, if you see anything close to this candle at the end of the month sell and go away. After FED FOMC tomorrow BTC could see from well below 55kIf BTC confirms the reversal candle from last week, the target will be at the blue box. This doesn't look good for bulls in short to mid-term, but again in long term just relaxIts over. Bitcoin is going towards my target from several months ago. Guys and girls prepare for massive drop
Consistent_Trades
SOL thunder in the distance, be careful bulls.

SOL is forming a huge rising wedge, and a breakdown could trigger massive sell-offs and short positions. RSI is indicating there is no power in this upward move and is ready to cool down, signaling a potential strong drop. MACD is way overbought, similar to RSI, and also shows strong and powerful negative divergences, as does RSI. Histograms are ticking lower, indicating a lack of power. All in all, bulls are safe if the price continues to rise and stays within the pattern. However, if and when the price breaks down, a significant sell-off will occur, leaving many retail bulls on the wrong side. Watch out.Saved by the bell for now! Nice bullish return in pattern.Less and less time for SOL to move up. SOL just can not bounce of from the trend line which is bearish as it is a sign of weakness. RSI and MACD still have powerful negative divergences which are very bearish. However, small and last chance for bulls. SOL is also forming some kind of high base or ascending triangle, and if SOL found power and volume to break up it could be nice move. But it needs to do ASAP.Bull greetz on breaking out from the ascending triangle. Strong move indeed.
Disclaimer
Any content and materials included in Sahmeto's website and official communication channels are a compilation of personal opinions and analyses and are not binding. They do not constitute any recommendation for buying, selling, entering or exiting the stock market and cryptocurrency market. Also, all news and analyses included in the website and channels are merely republished information from official and unofficial domestic and foreign sources, and it is obvious that users of the said content are responsible for following up and ensuring the authenticity and accuracy of the materials. Therefore, while disclaiming responsibility, it is declared that the responsibility for any decision-making, action, and potential profit and loss in the capital market and cryptocurrency market lies with the trader.