
Christian_coin7
@t_Christian_coin7

What symbols does the trader recommend buying?
Purchase History
پیام های تریدر
Filter
Signal Type
Christian_coin7

This chart is simple. However there are some interesting points that i want to share with you. FIRSTLY In every bear market the drop from the top to the bottom was: - First Bear Market, Top-to-Bottom -87.19%, - Second Bear Market, Top-to-Bottom -83.97% and lastly, - Third Bear Market , Top-to-Bottom -77.49% It looks like in every new bear market the drop isn't as big as the previous ones. SECONDLY As we can see from the chart when Bitcoin was breaking out of this big orange triangles it was never coming back down again. - First Bear Market, lasted for about 426 days, - Second Bear Market, lasted for about 365 days and lastly, - Third Bear Market, lasted, surprisingly the same days as the second bear market, 365 days. You can say here that it might take more time as the first bear market which was 426 days but if you see the chart bitcoin is know high enough to avoid this situation. LASTLY Before Bitcoin starts to move into higher levels we always had a big drop. The last big drop of the.. -> First Bear Market was: -52.35% -> Second Bear Market was: -52.40% -> Third Bear Market was: -50.83% PERSONAL OPINION To sum up all i want to say with this data in the chart is that the Bitcoin is not going to move to 12K level area as the bears were saying. Moreover, as you can see in the chart there is an orange line that starts in 01/Feb/2013 until today. I believe that if Bitcoin jumps above this orange line the price is going to go in much higher levels. Do you think BTC can go to 12K? Thank you, Best Regards ChristianUPDATE: - From 1st of November/2022, when i posted my first (Newbie Idea as it was my first Chart), i was trying to explain how important role the biggest trendline of BTC plays. (Which is the Chart above, is the big diagonal Orange Line that BTC most of times is above it). - TODAY: 04/12/2023 we can clearly see and understand why all this time i was mentioning this Orange Line. (I was trying to alert everyone about it also in my Twitter account). Around $40400 was the area that we had to broke and when this area reached 41k came so fast as well as 42k. - NOW: At this point it's all in the hands of the Bulls - how hard are going to fight in order to protect this level of Bitcoin above this orange line. I hope now everyone sees what am seeing in the BTC/USD Chart and will understand how important this line is. - LASTLY: Are you still waiting Bitcoin to go to 12K?;) Kind Regards, Christian
Christian_coin7
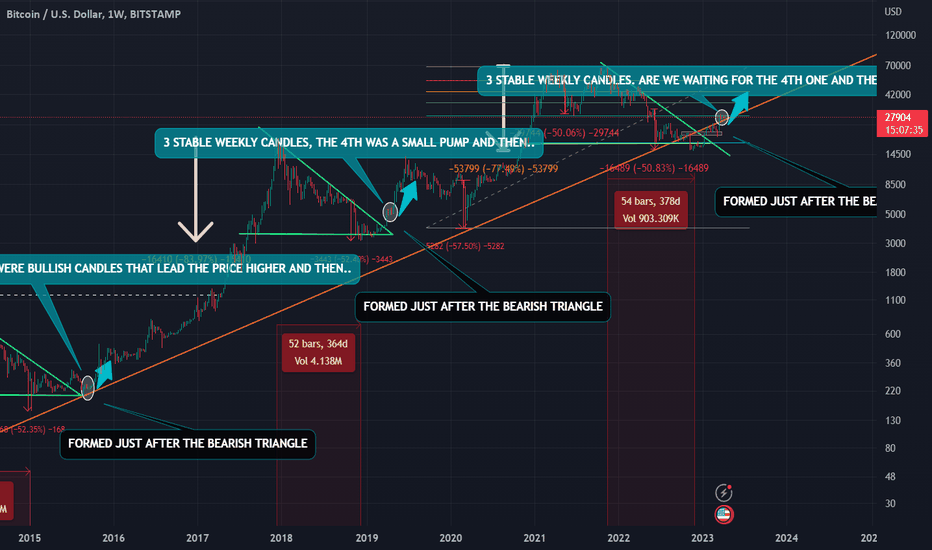
Dear Bitcoin - Crypto friends, Today i would like to share with you my personal idea on how Bitcoin is going to move. TO BEGIN WITH: We can clearly see the big triangles which show the path that Bitcoin followed during the bear market. What i want you to see here is that after we broke out of this triangles we had weekly stable candlesticks which i point them out with (WHITE CIRCLES). Through the data that we have in the Bitcoin chart, everytime we were in this situation the next weeks we had a price pump which it were leading us to higher prices. RIGHT NOW: We are at this point again. And the question is.. Is Bitcoin going to do the same thing as the previous times? MY POINT OF VIEW: Bitcoin is at a crucial point right now forming cadlesticks above the biggest trendline in the chart which is the (ORANGE LINE). I have a feeling that bears are going to get the price of Bitcoin lower than the ORANGE LINE for a little and this is going to make people stay out of the market because they will afraid that we are going down again which i personally dont think so due to the facts in the chart. TO SUM UP: I personally believe that Bitcoin is going to head to higher levels of prices however before this we might have some red cadles in order to wipe out the ones that afraid that BTC is going to head to the lower levels again. ***This is my personal opinion and not financial advice*** Thank you for taking time to read my chart, Best Regards and good trades to everyone, Christian
Christian_coin7
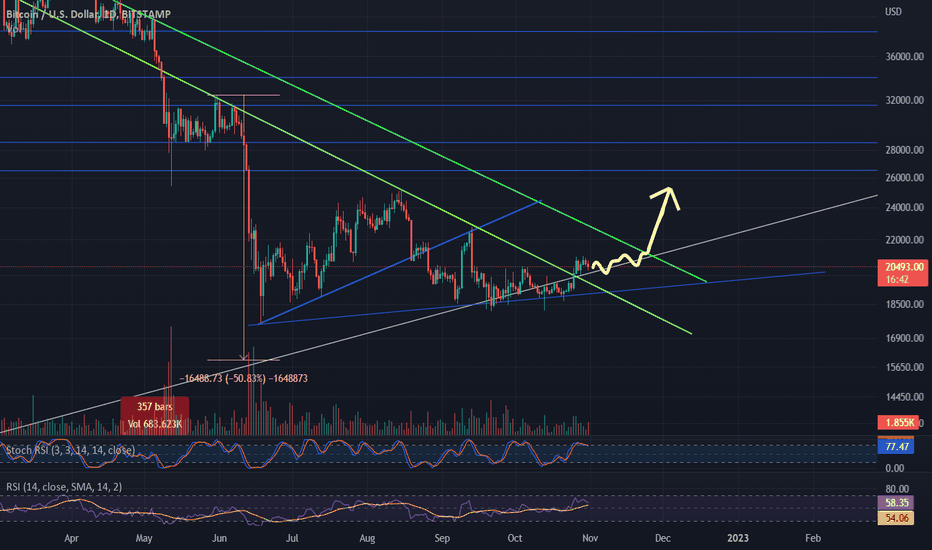
Hello Trading View, this is my first chart for BTC and i want to share with you my thoughts on it through my idea. - So to begin with on 19/Sep until 25/Oct, BTC was traiding lower than the big main support line which was holding on from the beggining(YEAR-2013). (WHITE LINE) - On 26/Oct BTC was already above the WHITE LINE and now is still trading above it. My though here is that this WHITE LINE is very important for BTC and despite the negative news around the world BTC clearly showed that it wanted to stay above it. If this is the scenario then i believe that it will continue to trade sideways with some fake break outs under the WHITE LINE and by the time that will reach the GREEN LINE it will go on higher trading levels because of the bullish break out that it will have. (AS I DRAW WITH WITH WHITE PENCIL-ARROW) I know that negative news are coming but Bitcoin always likes to suprice everyone. For long term investment i believe its a good time to DCA some BTC. Thank you for taking time to read this. Please feel free to comment down i really want to hear your thoughts on this. Best Regards, Christian
Disclaimer
Any content and materials included in Sahmeto's website and official communication channels are a compilation of personal opinions and analyses and are not binding. They do not constitute any recommendation for buying, selling, entering or exiting the stock market and cryptocurrency market. Also, all news and analyses included in the website and channels are merely republished information from official and unofficial domestic and foreign sources, and it is obvious that users of the said content are responsible for following up and ensuring the authenticity and accuracy of the materials. Therefore, while disclaiming responsibility, it is declared that the responsibility for any decision-making, action, and potential profit and loss in the capital market and cryptocurrency market lies with the trader.