
CheatCode_Wealth
@t_CheatCode_Wealth

What symbols does the trader recommend buying?
Purchase History
پیام های تریدر
Filter
Bearish rising wedge on bitcoin
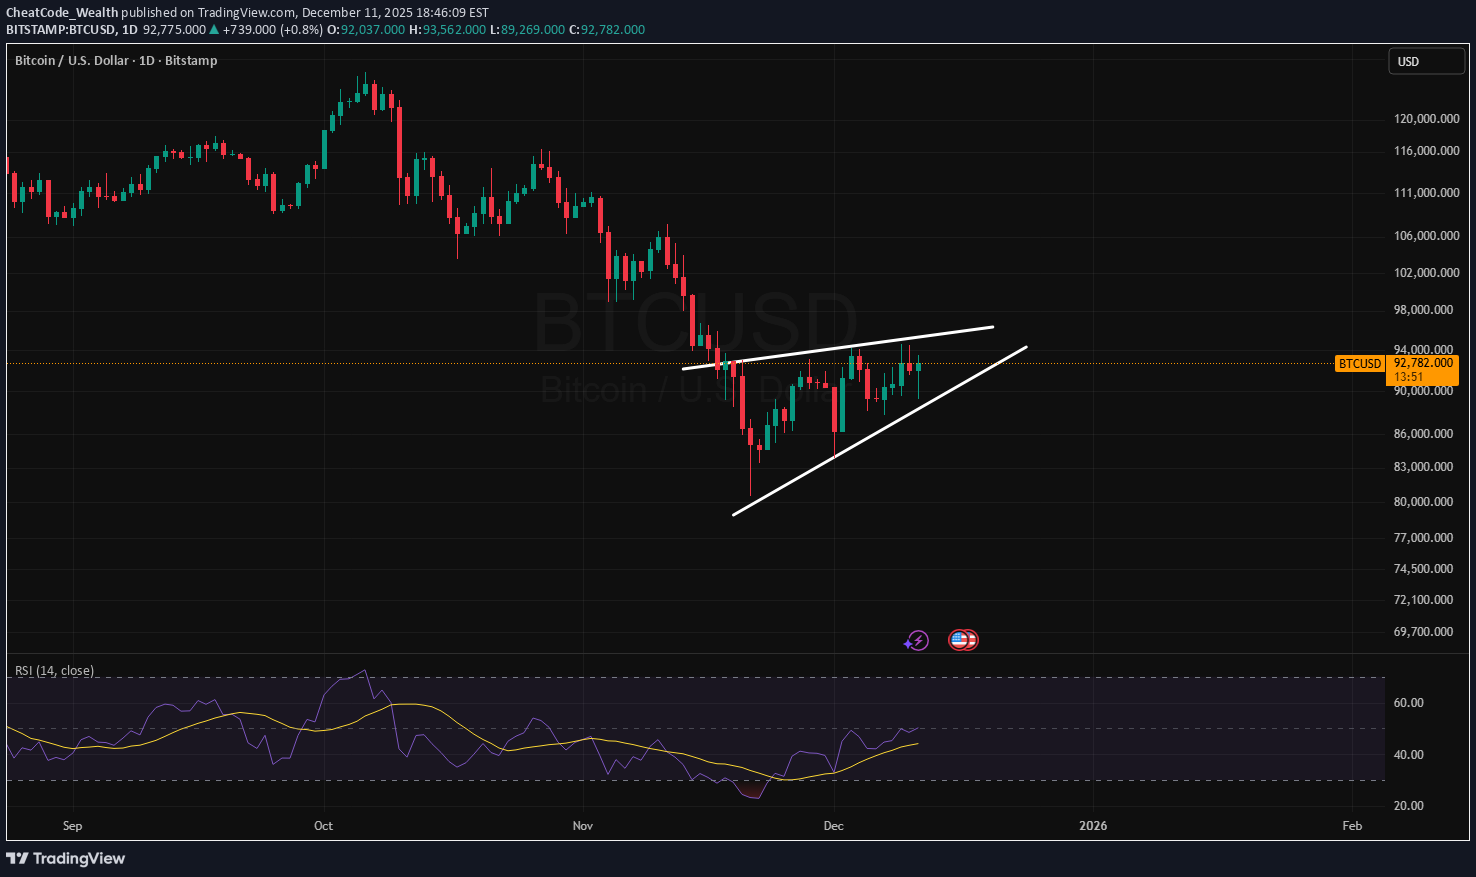
Bitcoin is forming a bearish rising wedge on the daily. RSI is at 50. A break of the 90,000 level would be a sign of a breakdown.
زمستان کریپتو فرا رسید؟ نشانههای قطعی پایان تب ارزهای دیجیتال
اوج سیکل 4 ساله بیت کوین گذشت؟ پیشبینی ترسناک برای بازار ارز دیجیتال تا 2029
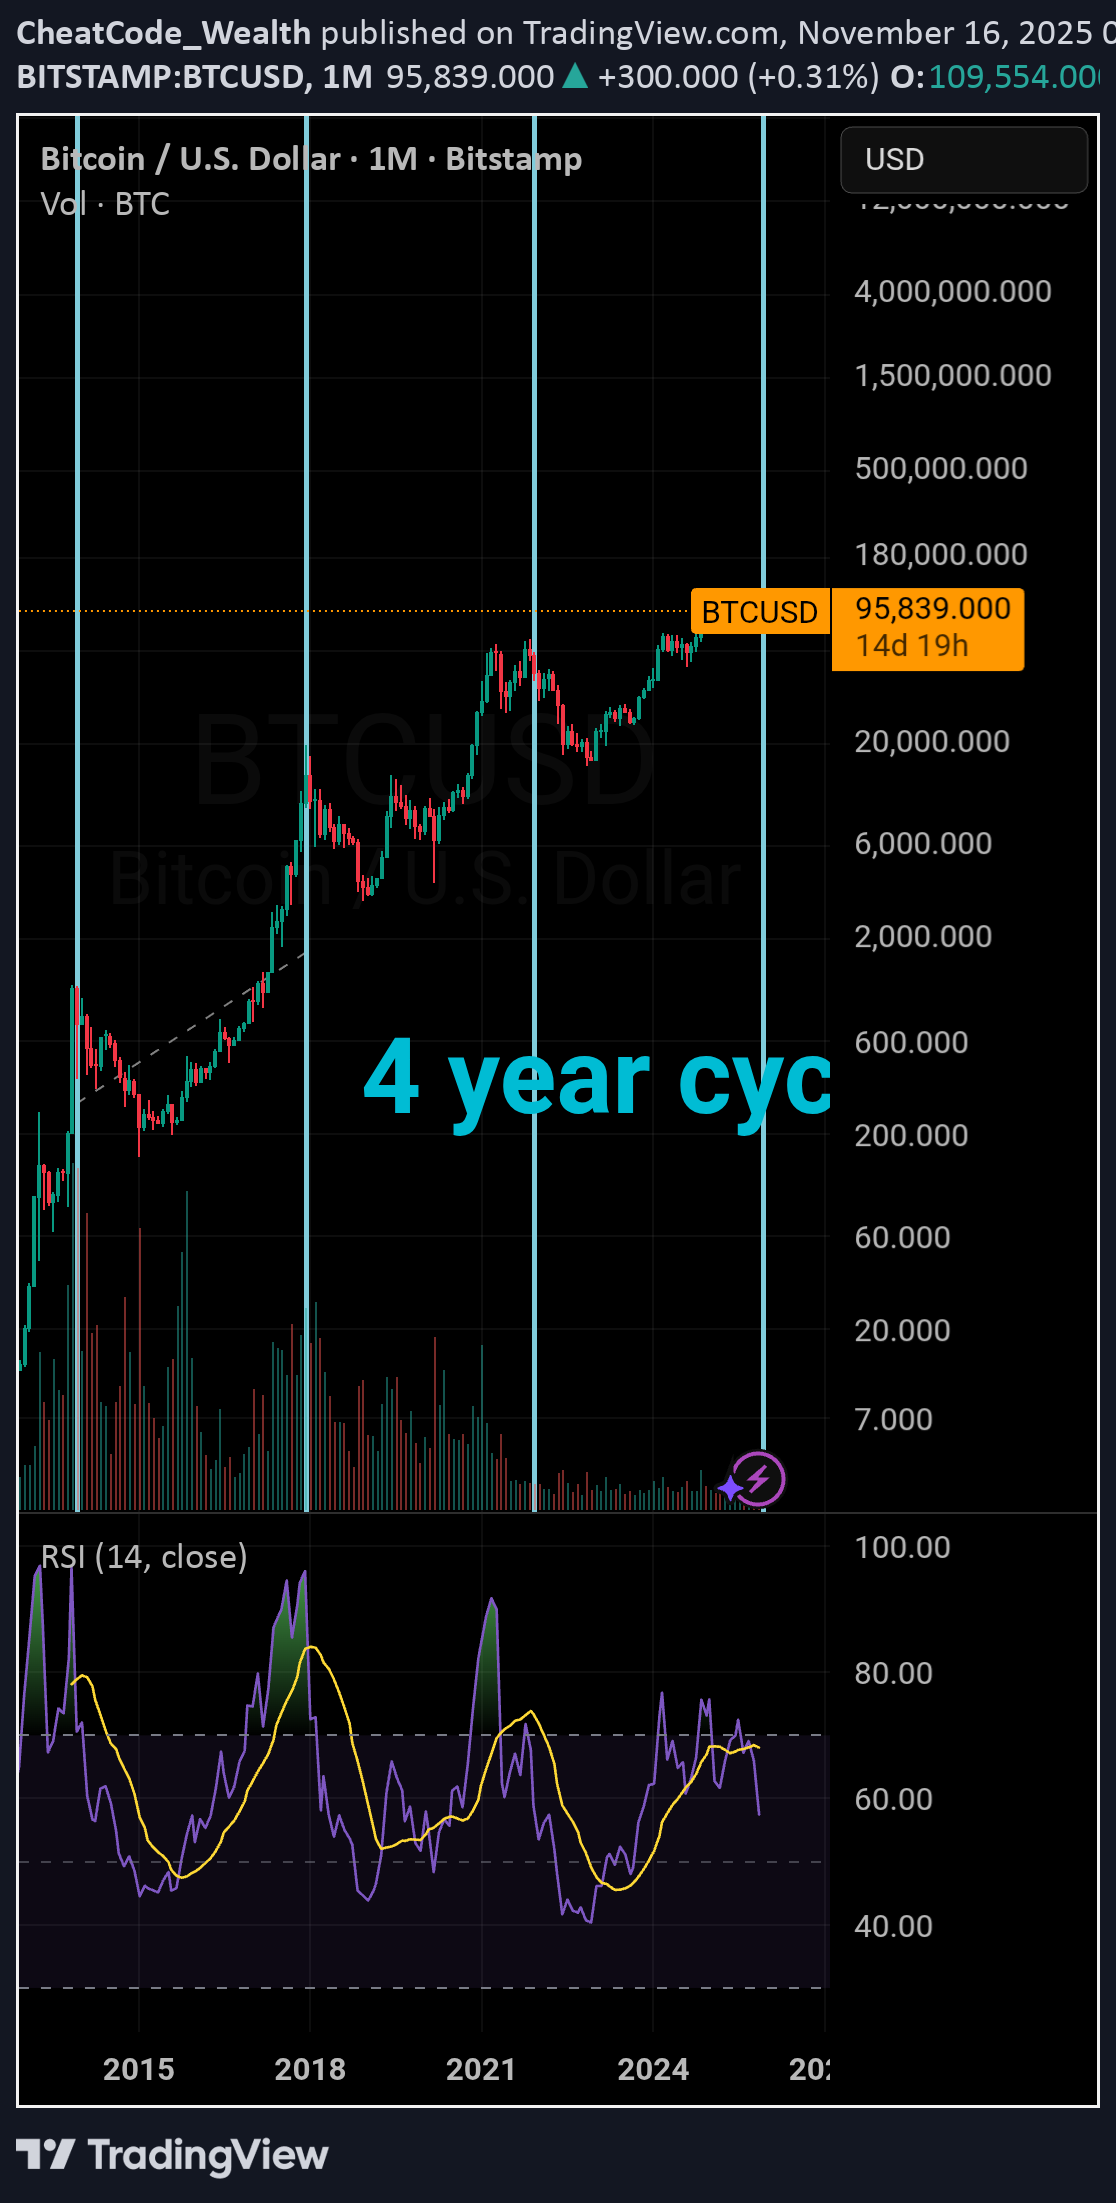
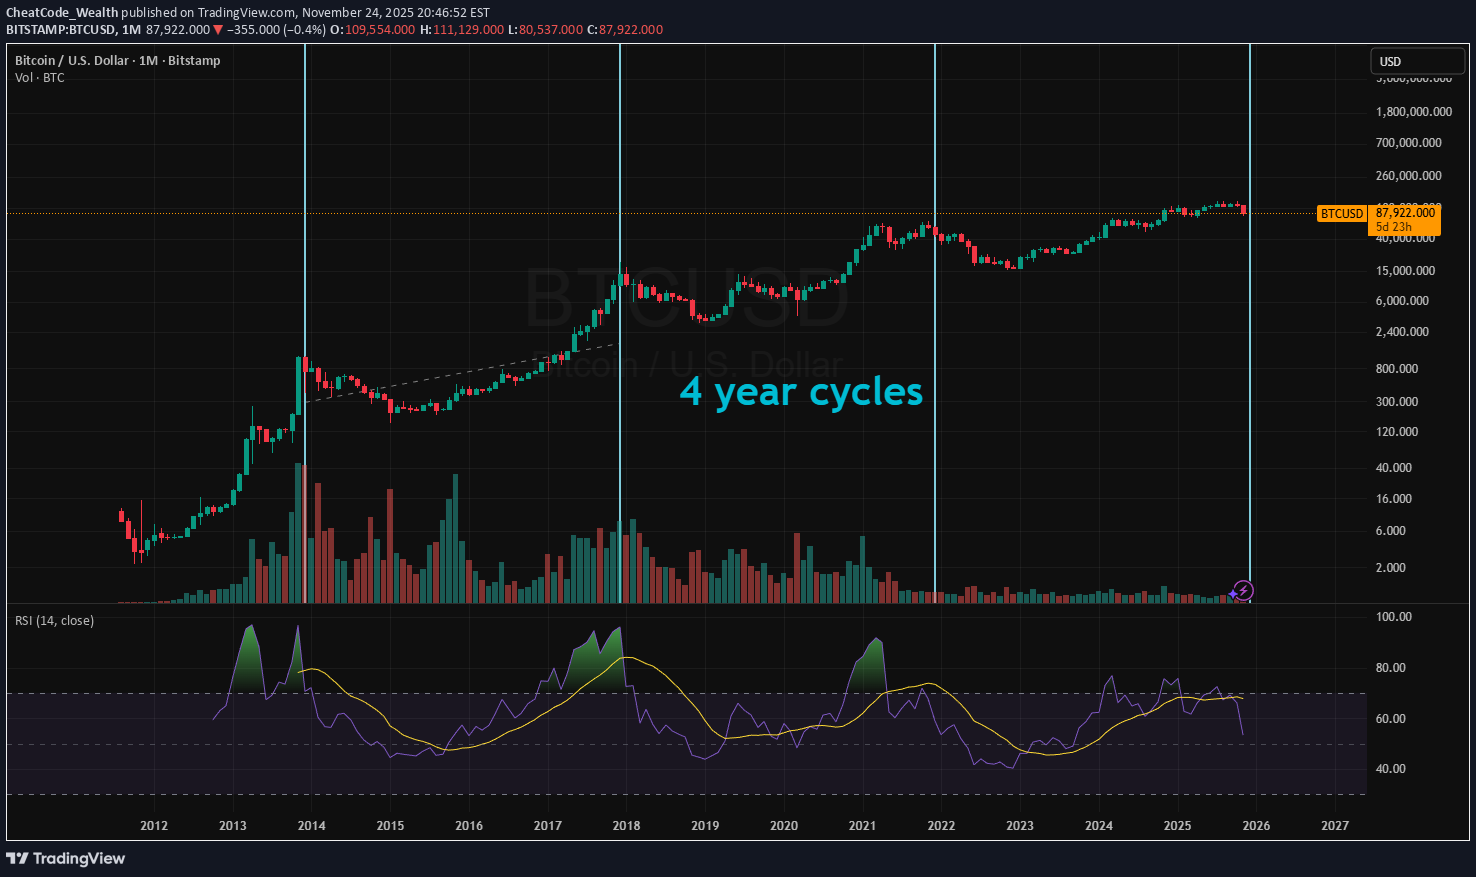
It's plausible that we have now passed bitcoins 4 year cycle top this year, given the time band and RSI change in momentum. If so, it would be expected that the year ahead will be bearish and the next cycle top would not be expected until 2029.
طلا پس از جهش بزرگ، به کجا میرود؟ پیشبینی کف قیمتی و سطوح کلیدی اصلاح
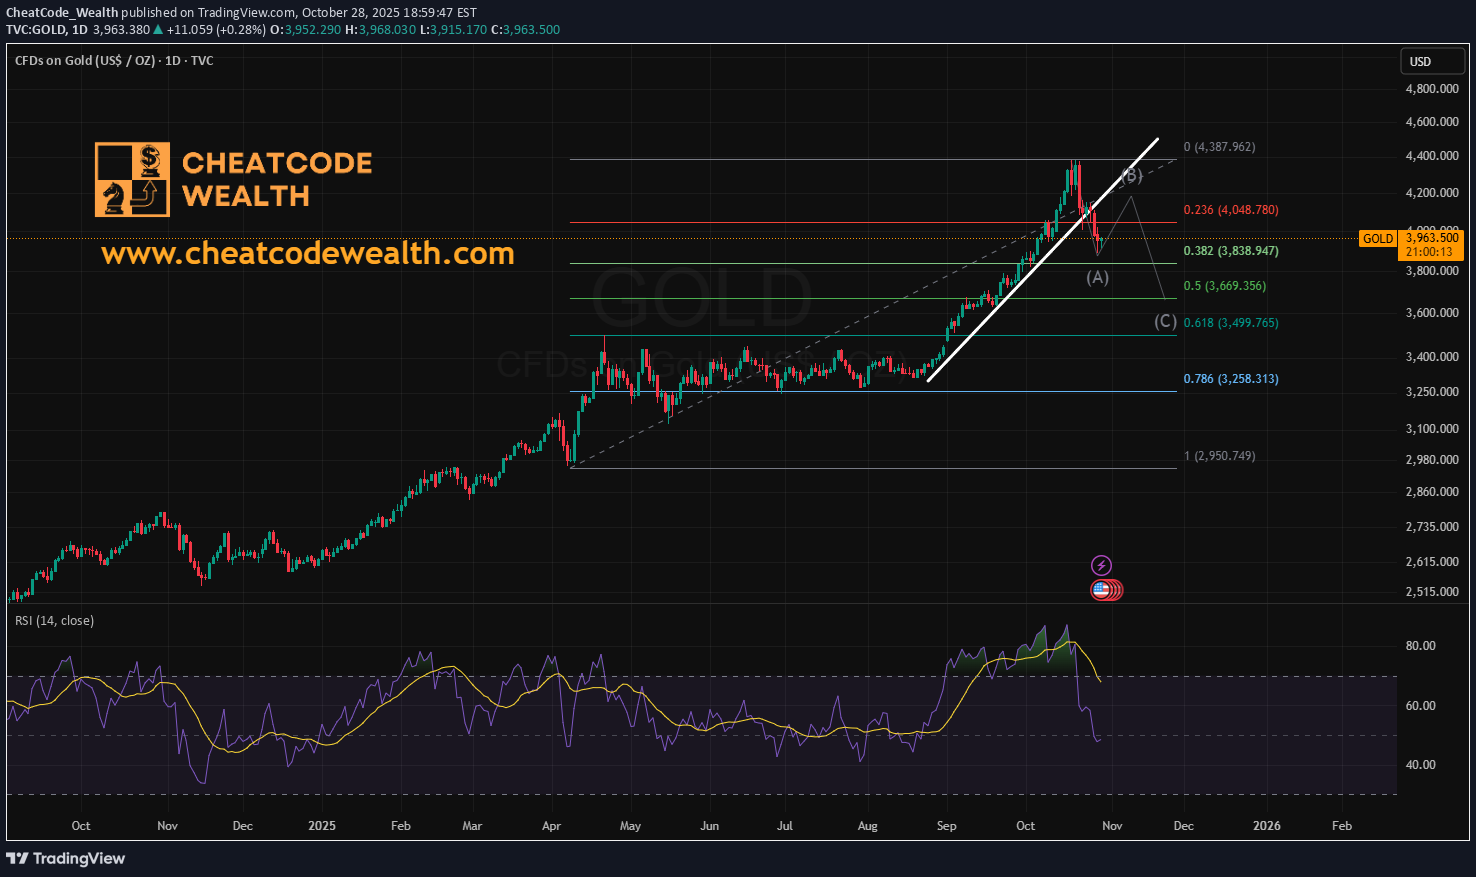
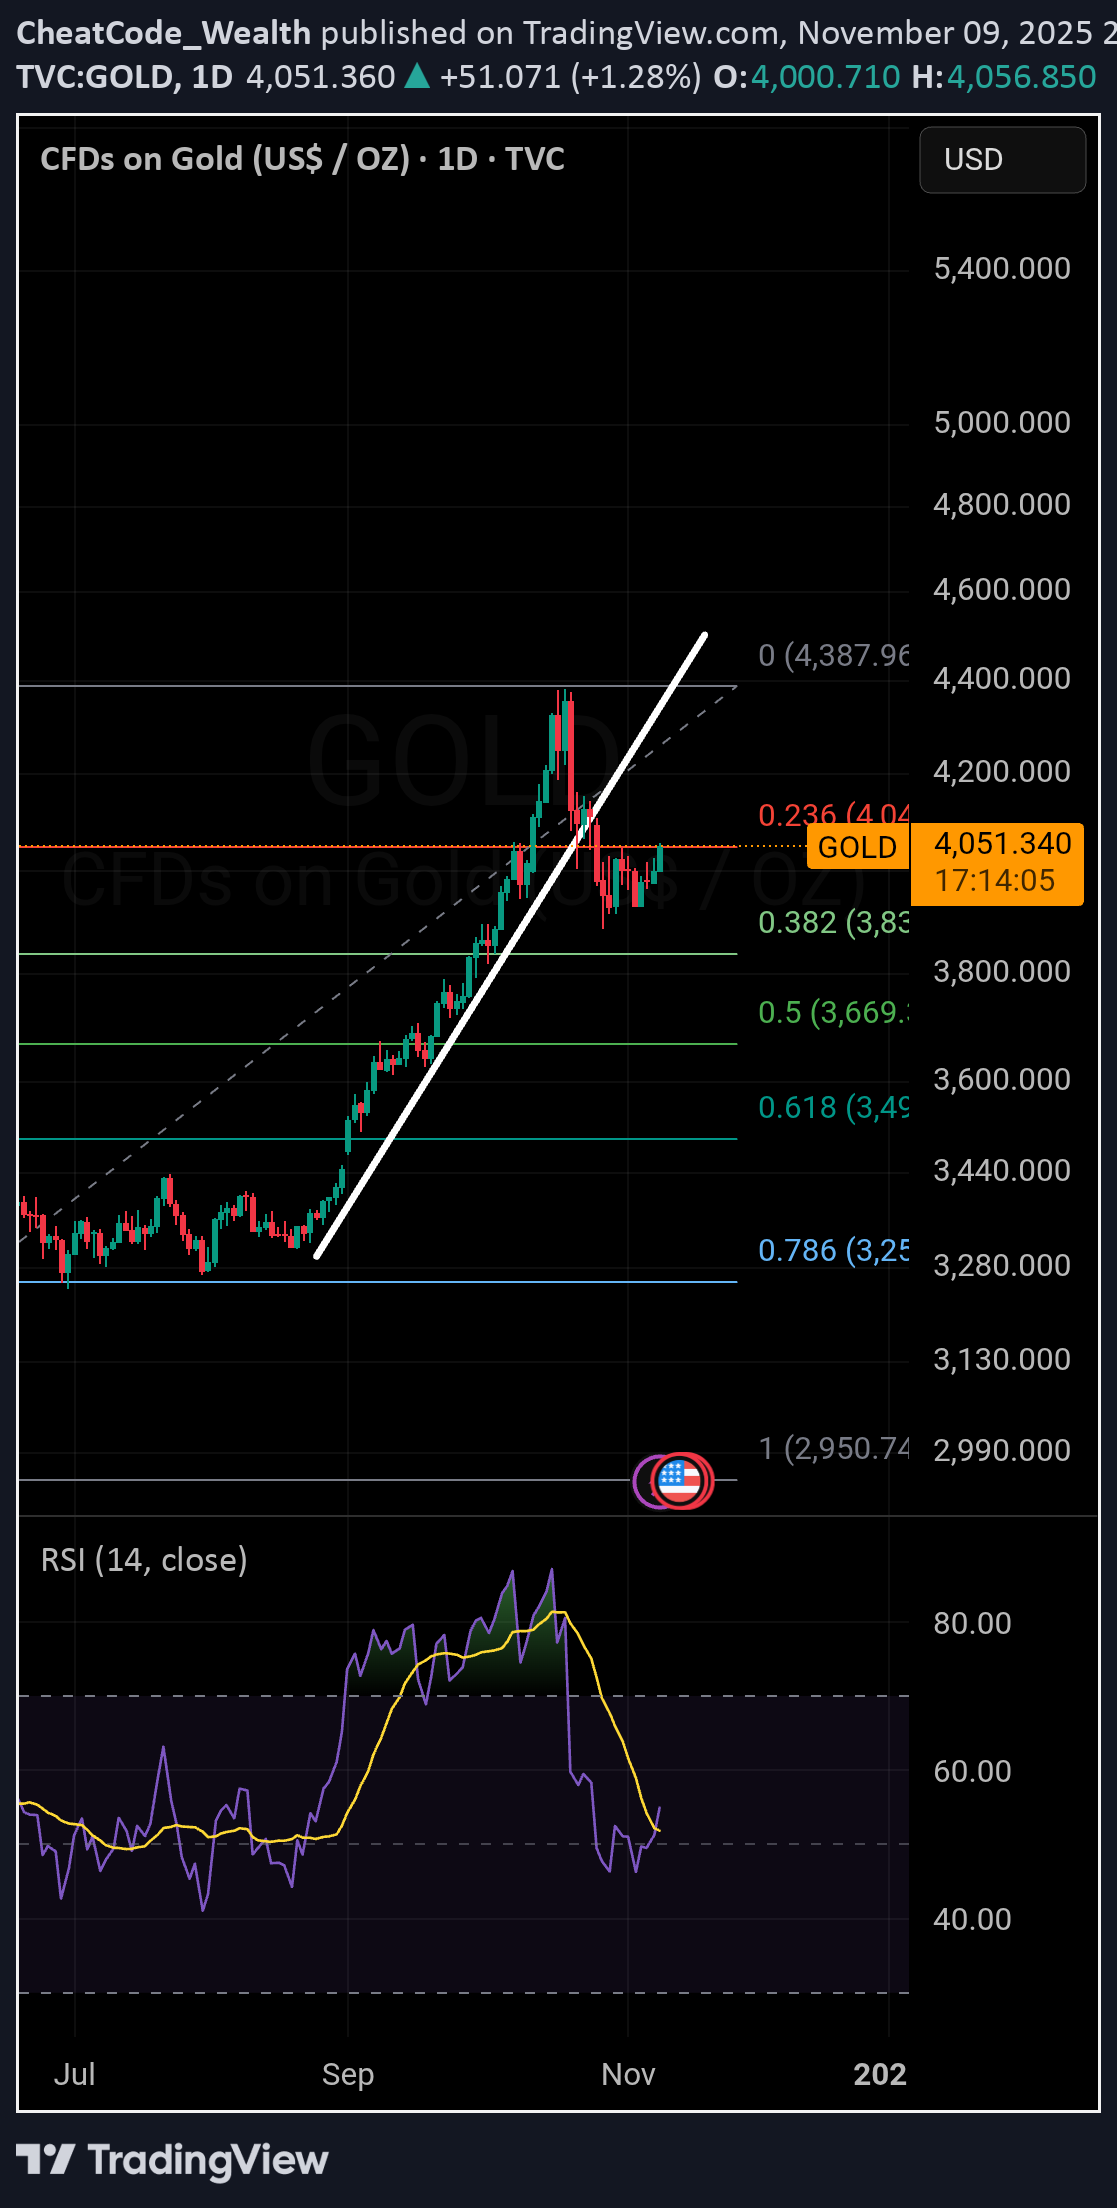
Gold has pulled back from a parabolic rise, a healthy and expected condition. We are now looking for a possible intermediate cycle low. Fib retracement level of 0.382 is next, followed possibly by 0.5 at $3,669. The trendline is broken and RSI has cooled off. Looking for an A-B-C correction to develop.
هشدار جدی RSI به بیتکوین: آیا چرخه صعودی به پایان میرسد؟
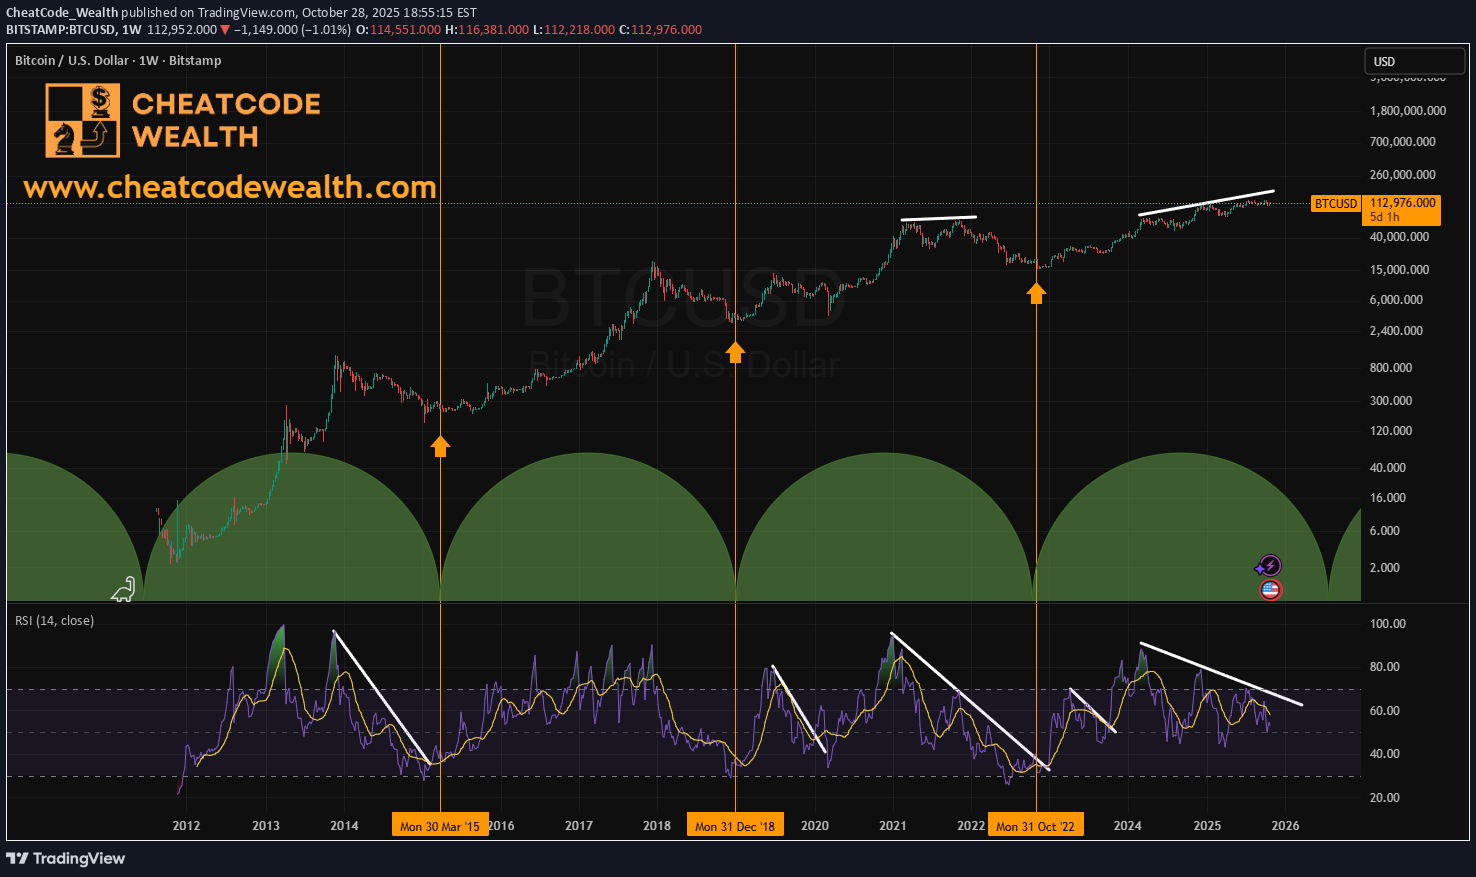
The RSI divergence on Bitcoin is not constructive. Previous episodes of declining RSI, with or without price divergence, has been bearish. Momentum is slowing and the cycle is getting long.
نقطه عطف مهم S&P 500: آیا قله قبلی دوباره آزمایش میشود؟
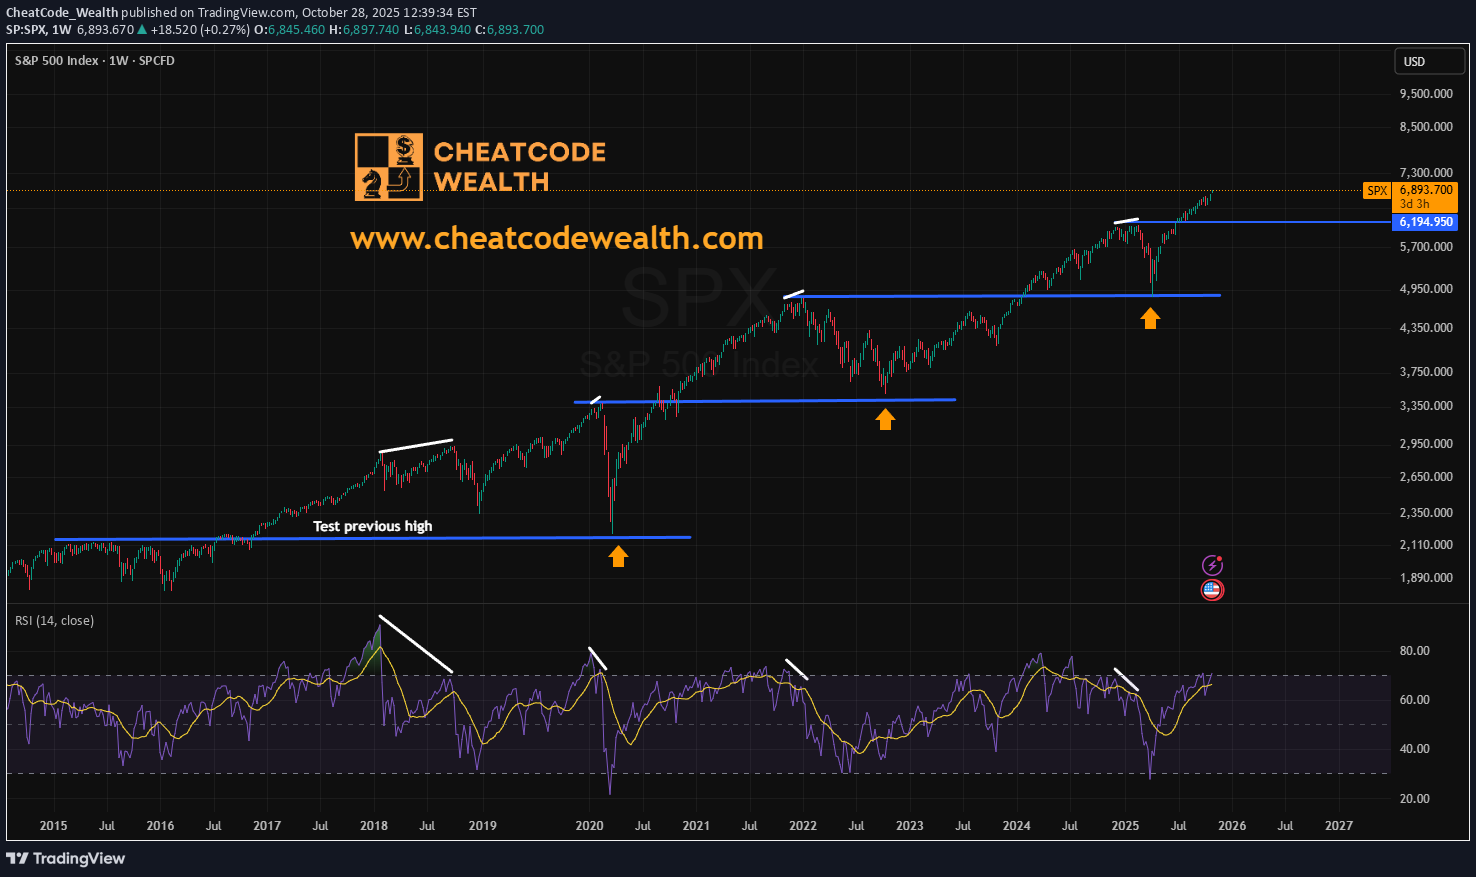
The S&P 500 is following a pattern of retesting previous highs, with the previous high around $6,194. The retest usually starts when RSI is overbought and shows bearish divergence with price. Although there isn't a divergence with RSI yet, it is entering overbought territory, so it’s important to watch this closely.
جریان نقدی قوی آمازون: آیا سرمایهگذاریهای سنگین ریسکساز است؟
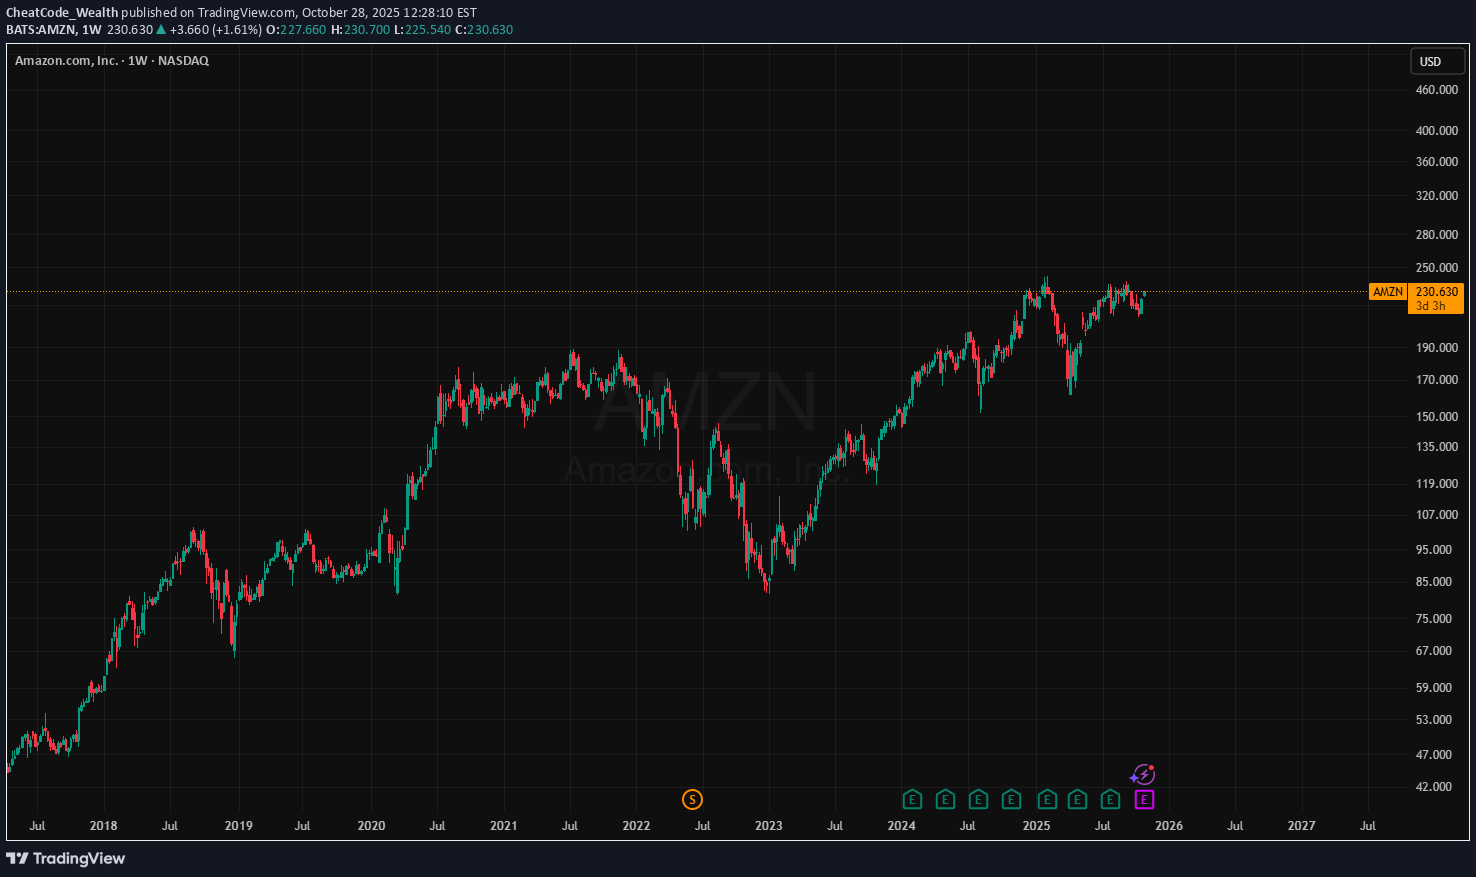
AMZN is valued not on earnings but on operating cash flow. Cash flows are strong with FCF and net operating income remaining robust. Capital expenditures are high in 2025 as the company invests in infrastructure needed for future competitive edge. This may be temporarily leaning on valuations.
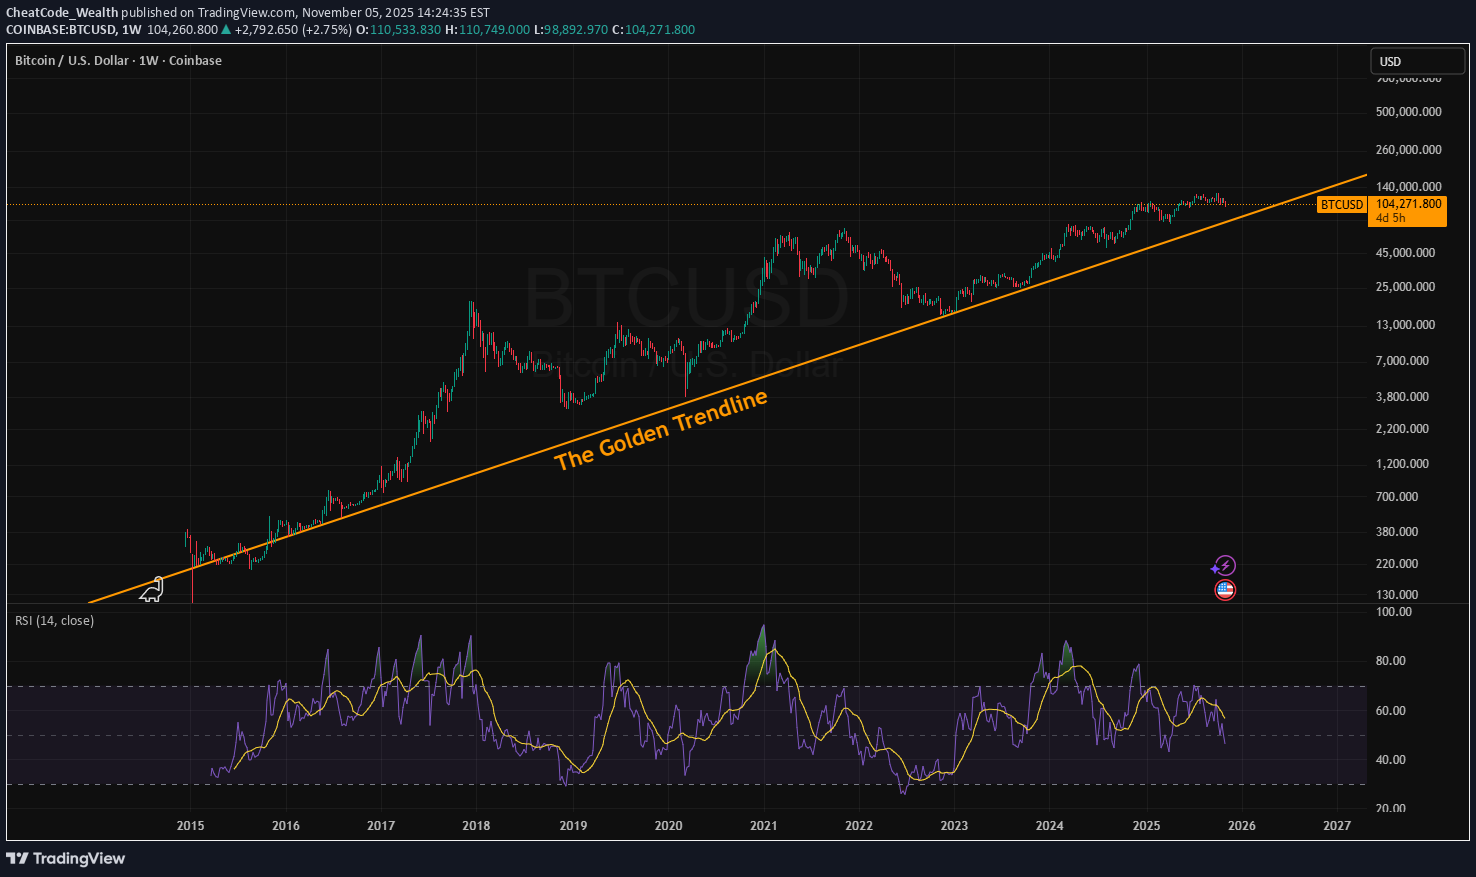
کاهش بازده بیت کوین در بلندمدت: آیا سقف کانال قیمتی محقق میشود؟
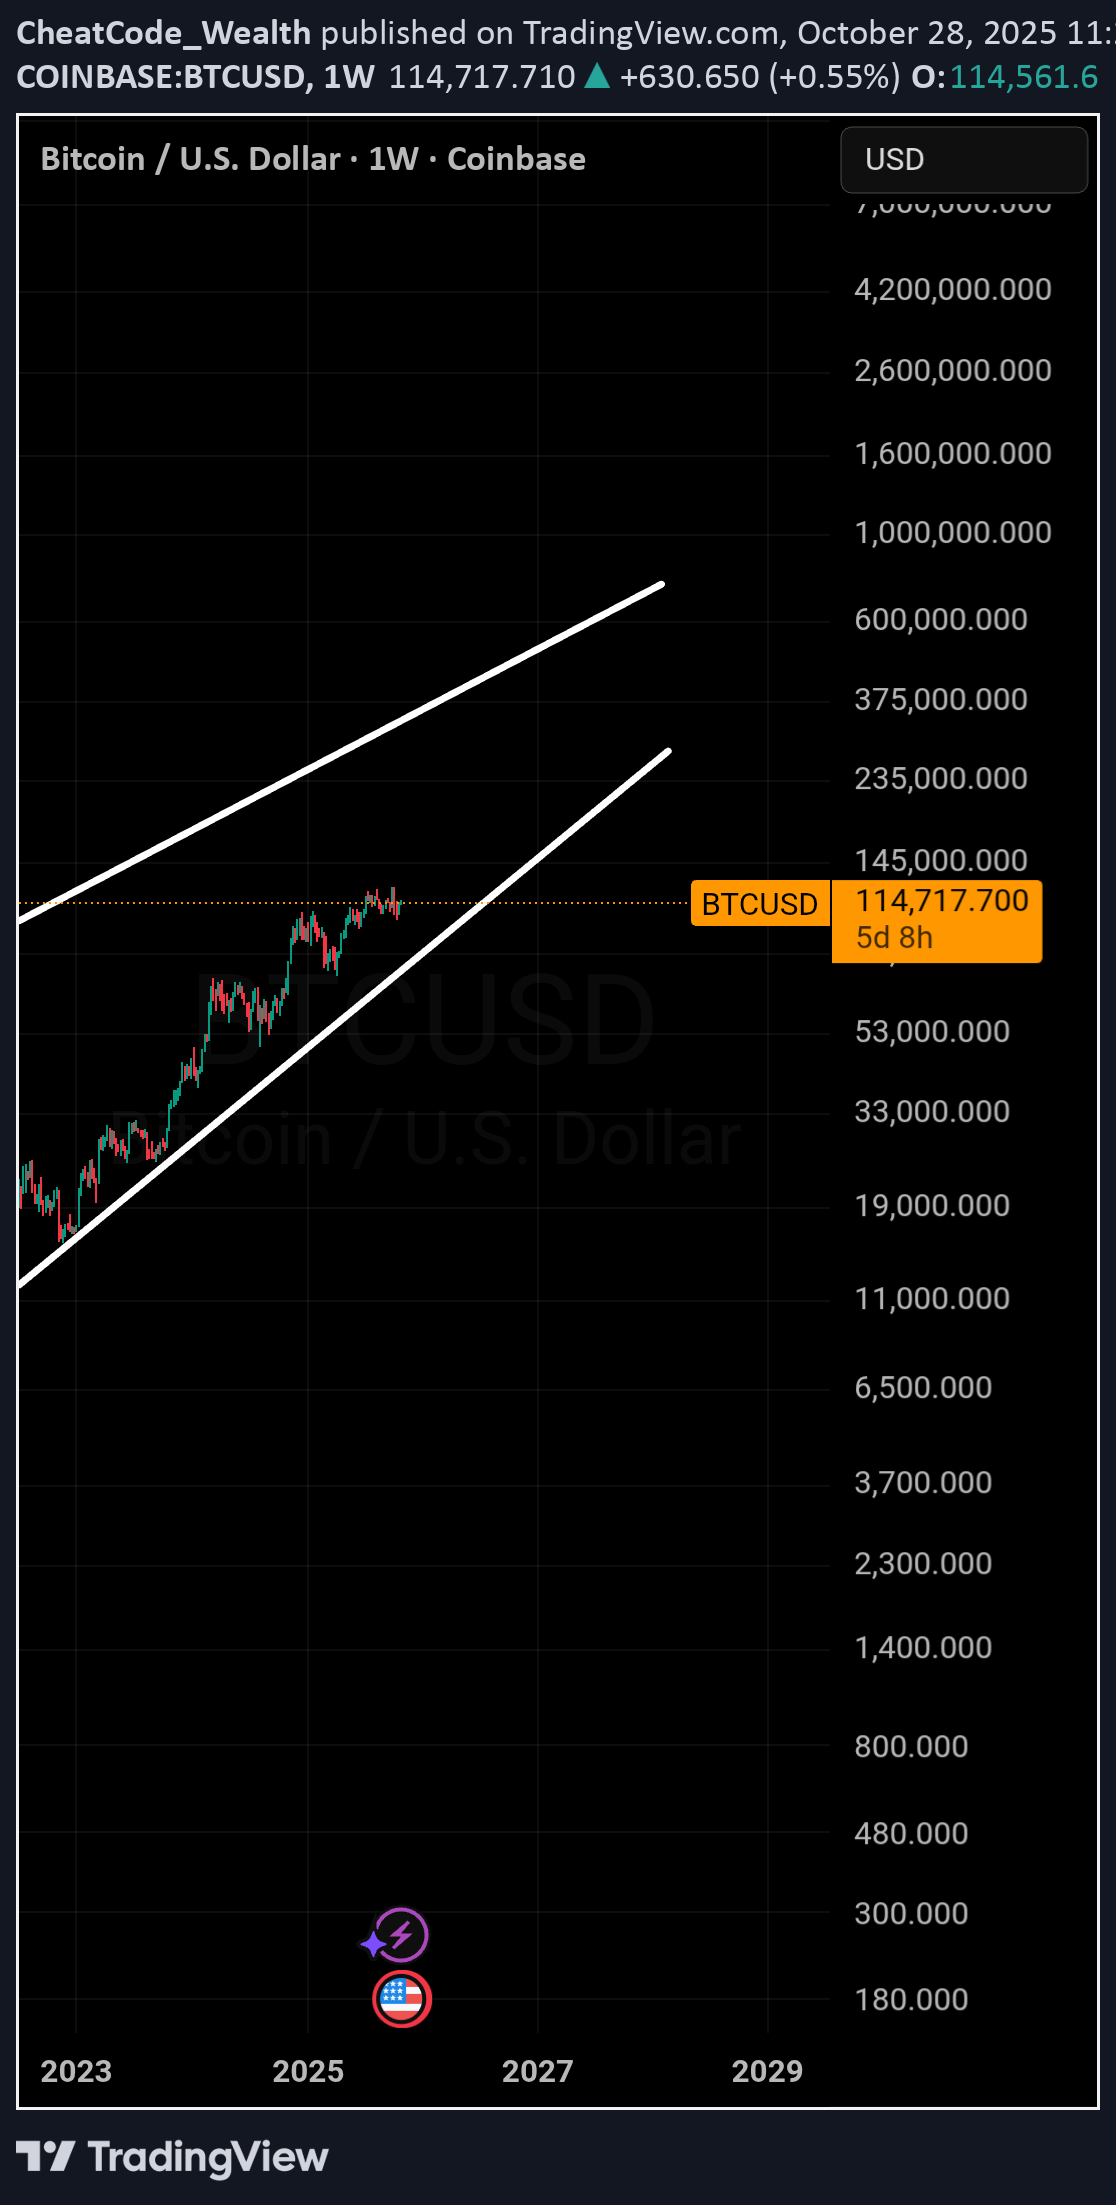
Bitcoins log chart is important because it shows how the assets rate of adoption of valuation is changing over time. The long term Channel supports current bitcoin price with upside to about $500,000. A break below lower support would be extremely bearish. Bitcoin appears to be exhibiting lower and lower growth and may not reach the upper bounds of the channel.
Disclaimer
Any content and materials included in Sahmeto's website and official communication channels are a compilation of personal opinions and analyses and are not binding. They do not constitute any recommendation for buying, selling, entering or exiting the stock market and cryptocurrency market. Also, all news and analyses included in the website and channels are merely republished information from official and unofficial domestic and foreign sources, and it is obvious that users of the said content are responsible for following up and ensuring the authenticity and accuracy of the materials. Therefore, while disclaiming responsibility, it is declared that the responsibility for any decision-making, action, and potential profit and loss in the capital market and cryptocurrency market lies with the trader.