
ChaselCecillia
@t_ChaselCecillia

What symbols does the trader recommend buying?
Purchase History
پیام های تریدر
Filter
Judging from Bitcoin’s current price action, the daily timeframe shows that the price has been fluctuating at a high level recently. After a large bearish candle appeared on September 25th, there was a slight rebound for two consecutive days, but the momentum was weak. On the hourly timeframe, the price is in a narrow-range consolidation, currently fluctuating within the 109,300-109,700 range, with a balance between bullish and bearish forces. For technical indicators: On the hourly MACD, the DIF and DEA lines are below the zero axis, and the histogram is shrinking—this indicates that bearish momentum is weakening but has not yet turned strong. The hourly RSI stands at 46.17, close to the neutral zone, with no obvious overbought or oversold signals in the short term. Currently, the price is hovering around the EMA 7, constrained by the EMA 30, and the overall trend is relatively weak; the EMA 120 is far from the current price, meaning the short-term trend remains bearish. In terms of weekend trading, operations can continue to be based on a range-bound (oscillating) perspective for the time being. BTCUSD sell @111000-110500 tp:109000-108000 buy @109000-108500 tp:111000-110000 Investment itself is not the source of risk; it is only when investment behavior escapes rational control that risks lie in wait. In the trading process, always bear in mind that restraining impulsiveness is the primary criterion for success. I share trading signals daily, and all signals have been accurate without error for a full month. Regardless of your past profits or losses, with my assistance, you have the hope to achieve a breakthrough in your investment.
Judging from Bitcoin’s current price action, the daily timeframe shows that the price has been fluctuating at a high level recently. After a large bearish candle appeared on September 25th, there was a slight rebound for two consecutive days, but the momentum was weak. On the hourly timeframe, the price is in a narrow-range consolidation, currently fluctuating within the 109,300-109,700 range, with a balance between bullish and bearish forces. For technical indicators: On the hourly MACD, the DIF and DEA lines are below the zero axis, and the histogram is shrinking—this indicates that bearish momentum is weakening but has not yet turned strong. The hourly RSI stands at 46.17, close to the neutral zone, with no obvious overbought or oversold signals in the short term. Currently, the price is hovering around the EMA 7, constrained by the EMA 30, and the overall trend is relatively weak; the EMA 120 is far from the current price, meaning the short-term trend remains bearish. In terms of weekend trading, operations can continue to be based on a range-bound (oscillating) perspective for the time being. BTCUSD sell @111000-110500 tp:109000-108000 buy @109000-108500 tp:111000-110000 Investment itself is not the source of risk; it is only when investment behavior escapes rational control that risks lie in wait. In the trading process, always bear in mind that restraining impulsiveness is the primary criterion for success. I share trading signals daily, and all signals have been accurate without error for a full month. Regardless of your past profits or losses, with my assistance, you have the hope to achieve a breakthrough in your investment.
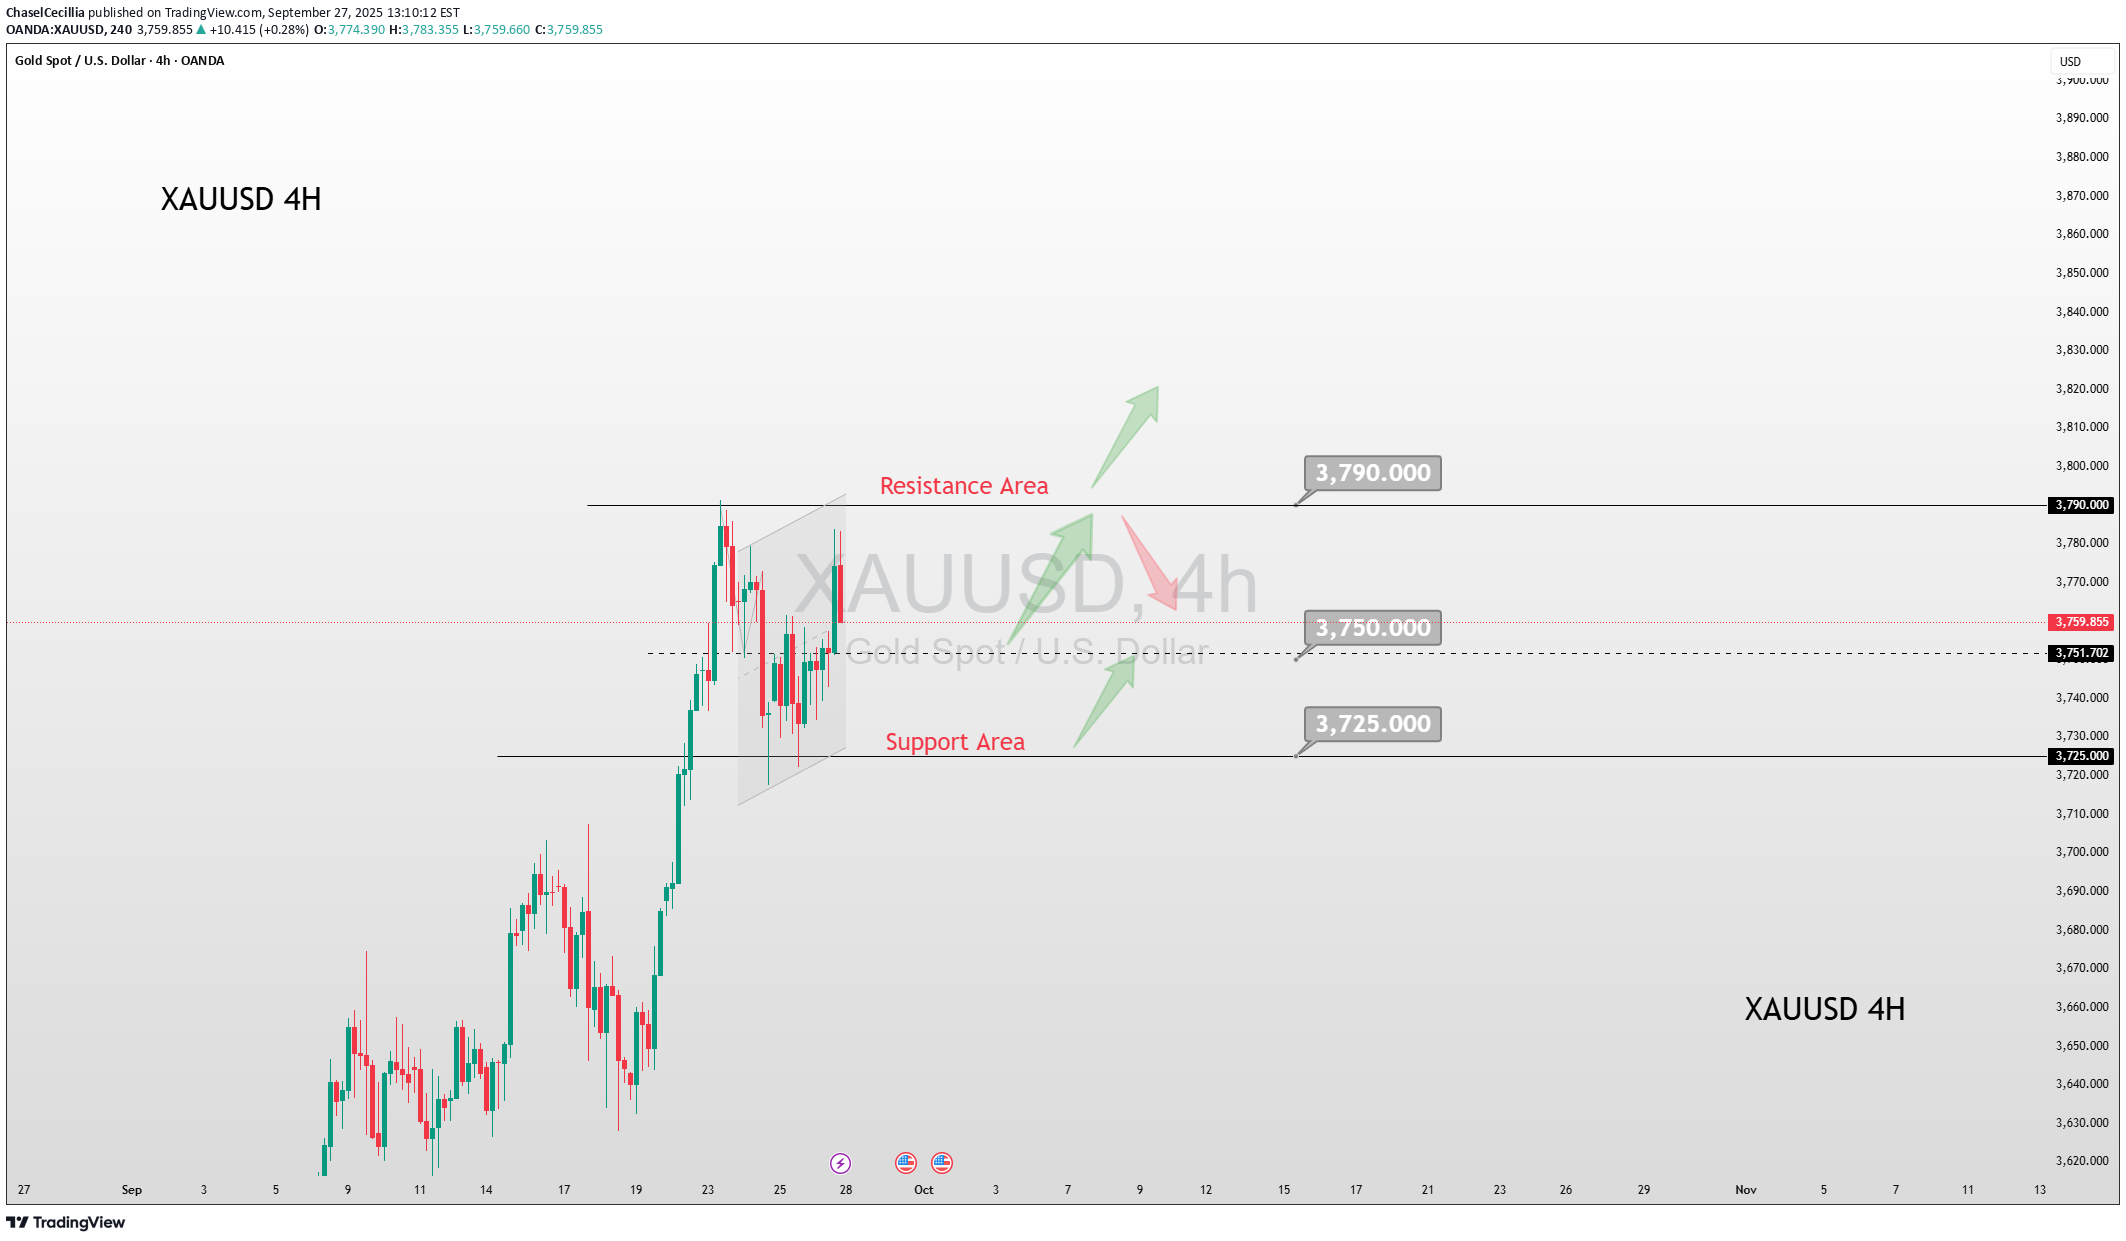
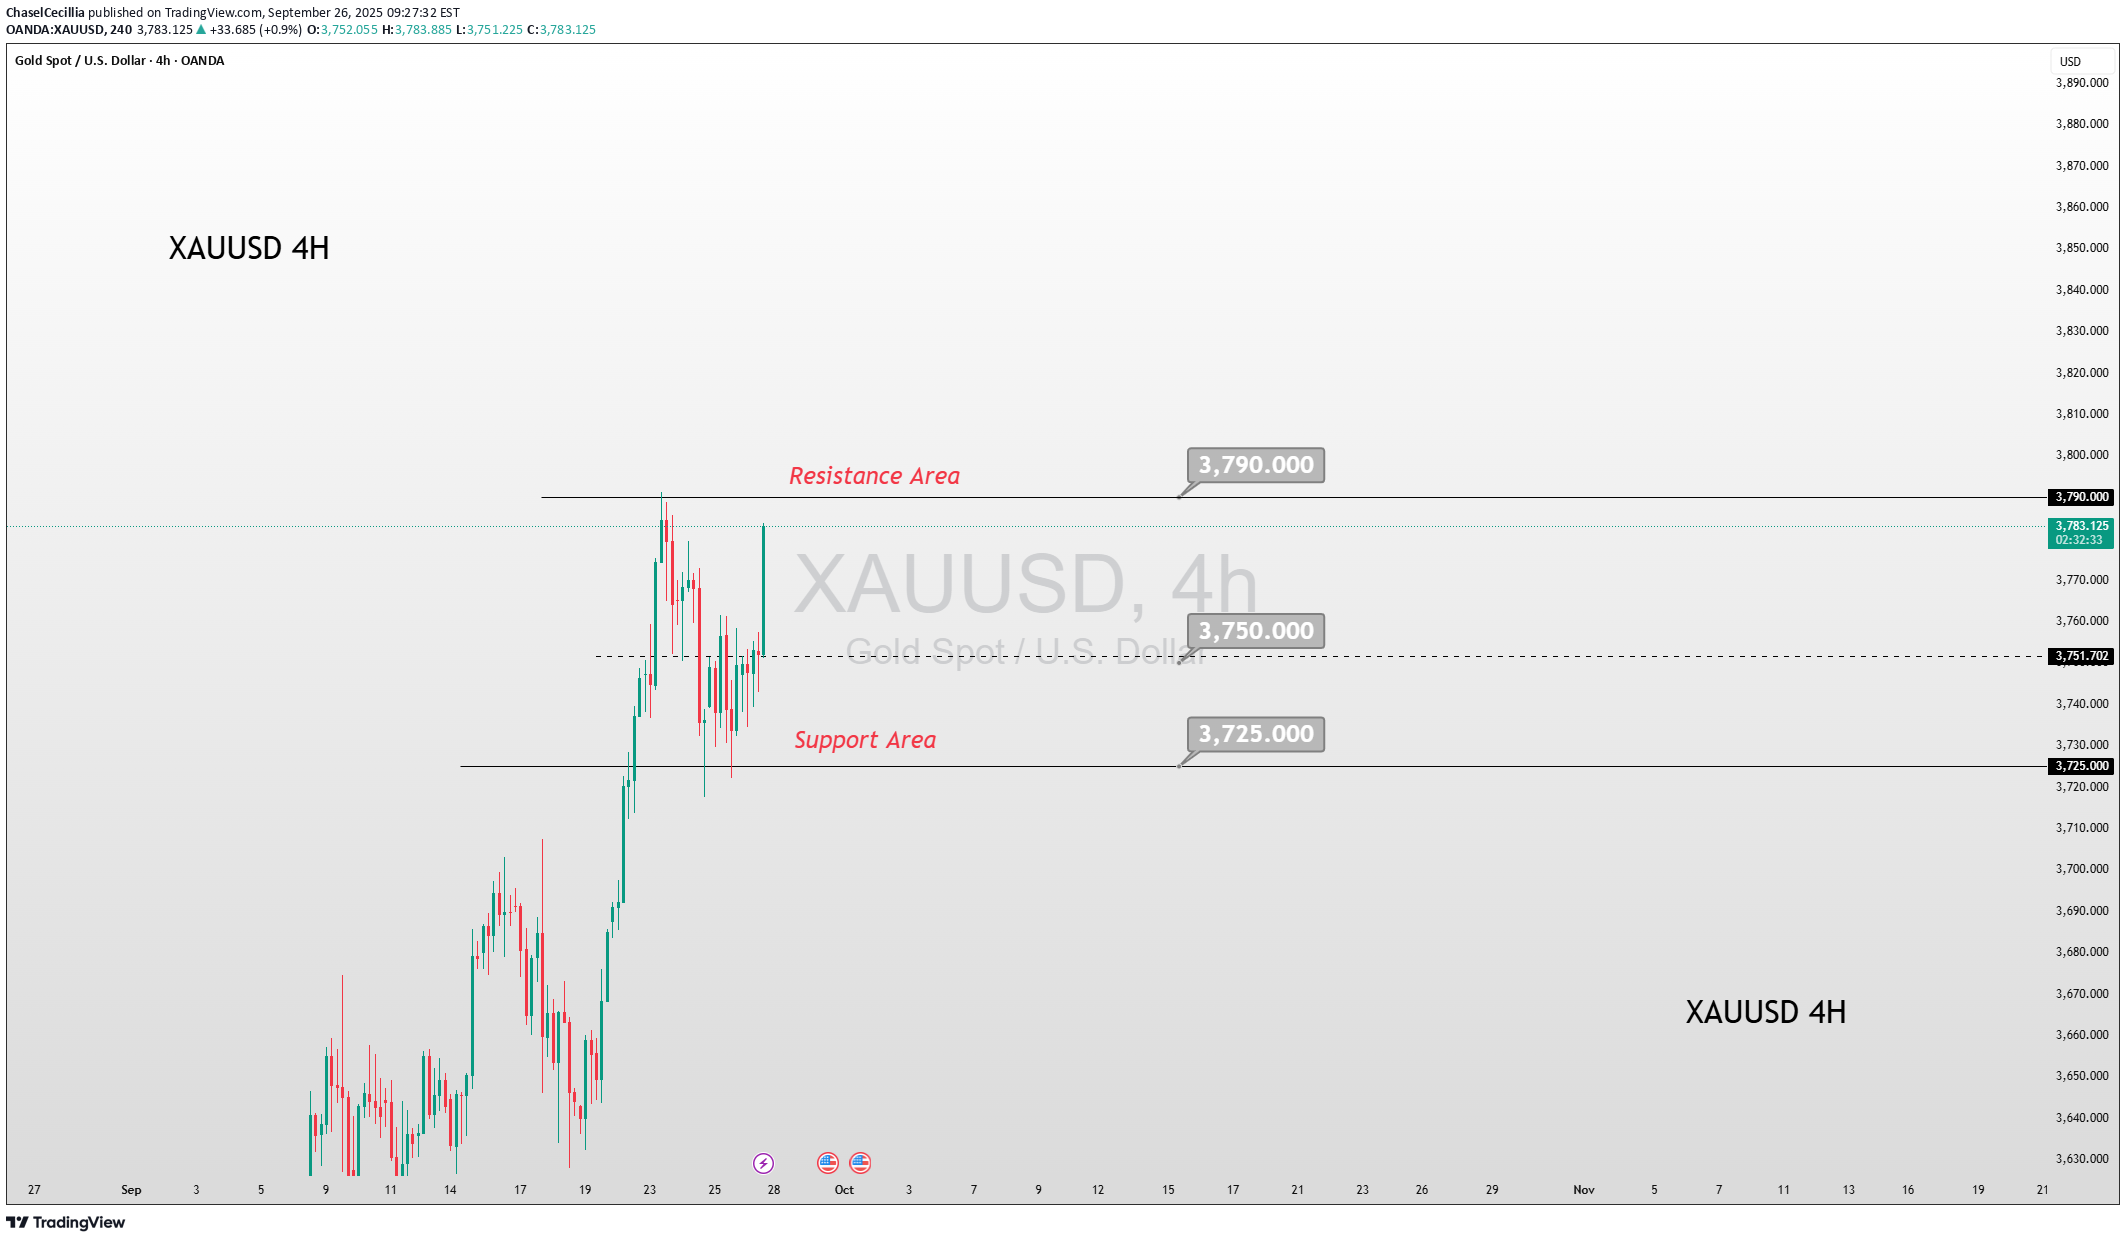
A series of key economic data will be released one after another next week. Affected by this expectation, the gold price is likely to remain in a fluctuating range at the beginning of the week. As there will be no special news drivers to stimulate the market early in the week, focus should be placed on the resistance level around 3790. Looking back at Friday's trading session, gold showed an oscillating upward trend during the Asian and European sessions. It hit a intraday high near 3784 in the US session, then pulled back under pressure, and finally closed around the 3760 level. Judging from the closing pattern, gold is likely to continue its retracement trend when the market opens next week. In my view, the current retracement of gold does not signal a reversal of the overall trend, and deploying long positions after the retracement remains the mainstream trading strategy for now. From the recent price movement, it can be seen that the low points of gold's retracements have been moving higher continuously, and bullish momentum has been driving the price to keep surging upward. Gold is expected to launch an attack towards the 3800 level next week. However, amid the continuous record of new highs, a certain degree of FOMO and caution has emerged in the market. It is important to note that each retracement and adjustment is actually accumulating momentum for further breakthroughs to new highs later. At present, with new highs emerging one after another, short-term bullish sentiment remains strong. Therefore, it is recommended to mainly take a strategy of going long after the price stabilizes following a retracement. XAUUSD buy @3740-3750 tp:3770-3790-3810 Investment itself is not the source of risk; it is only when investment behavior escapes rational control that risks lie in wait. In the trading process, always bear in mind that restraining impulsiveness is the primary criterion for success. I share trading signals daily, and all signals have been accurate without error for a full month. Regardless of your past profits or losses, with my assistance, you have the hope to achieve a breakthrough in your investment.
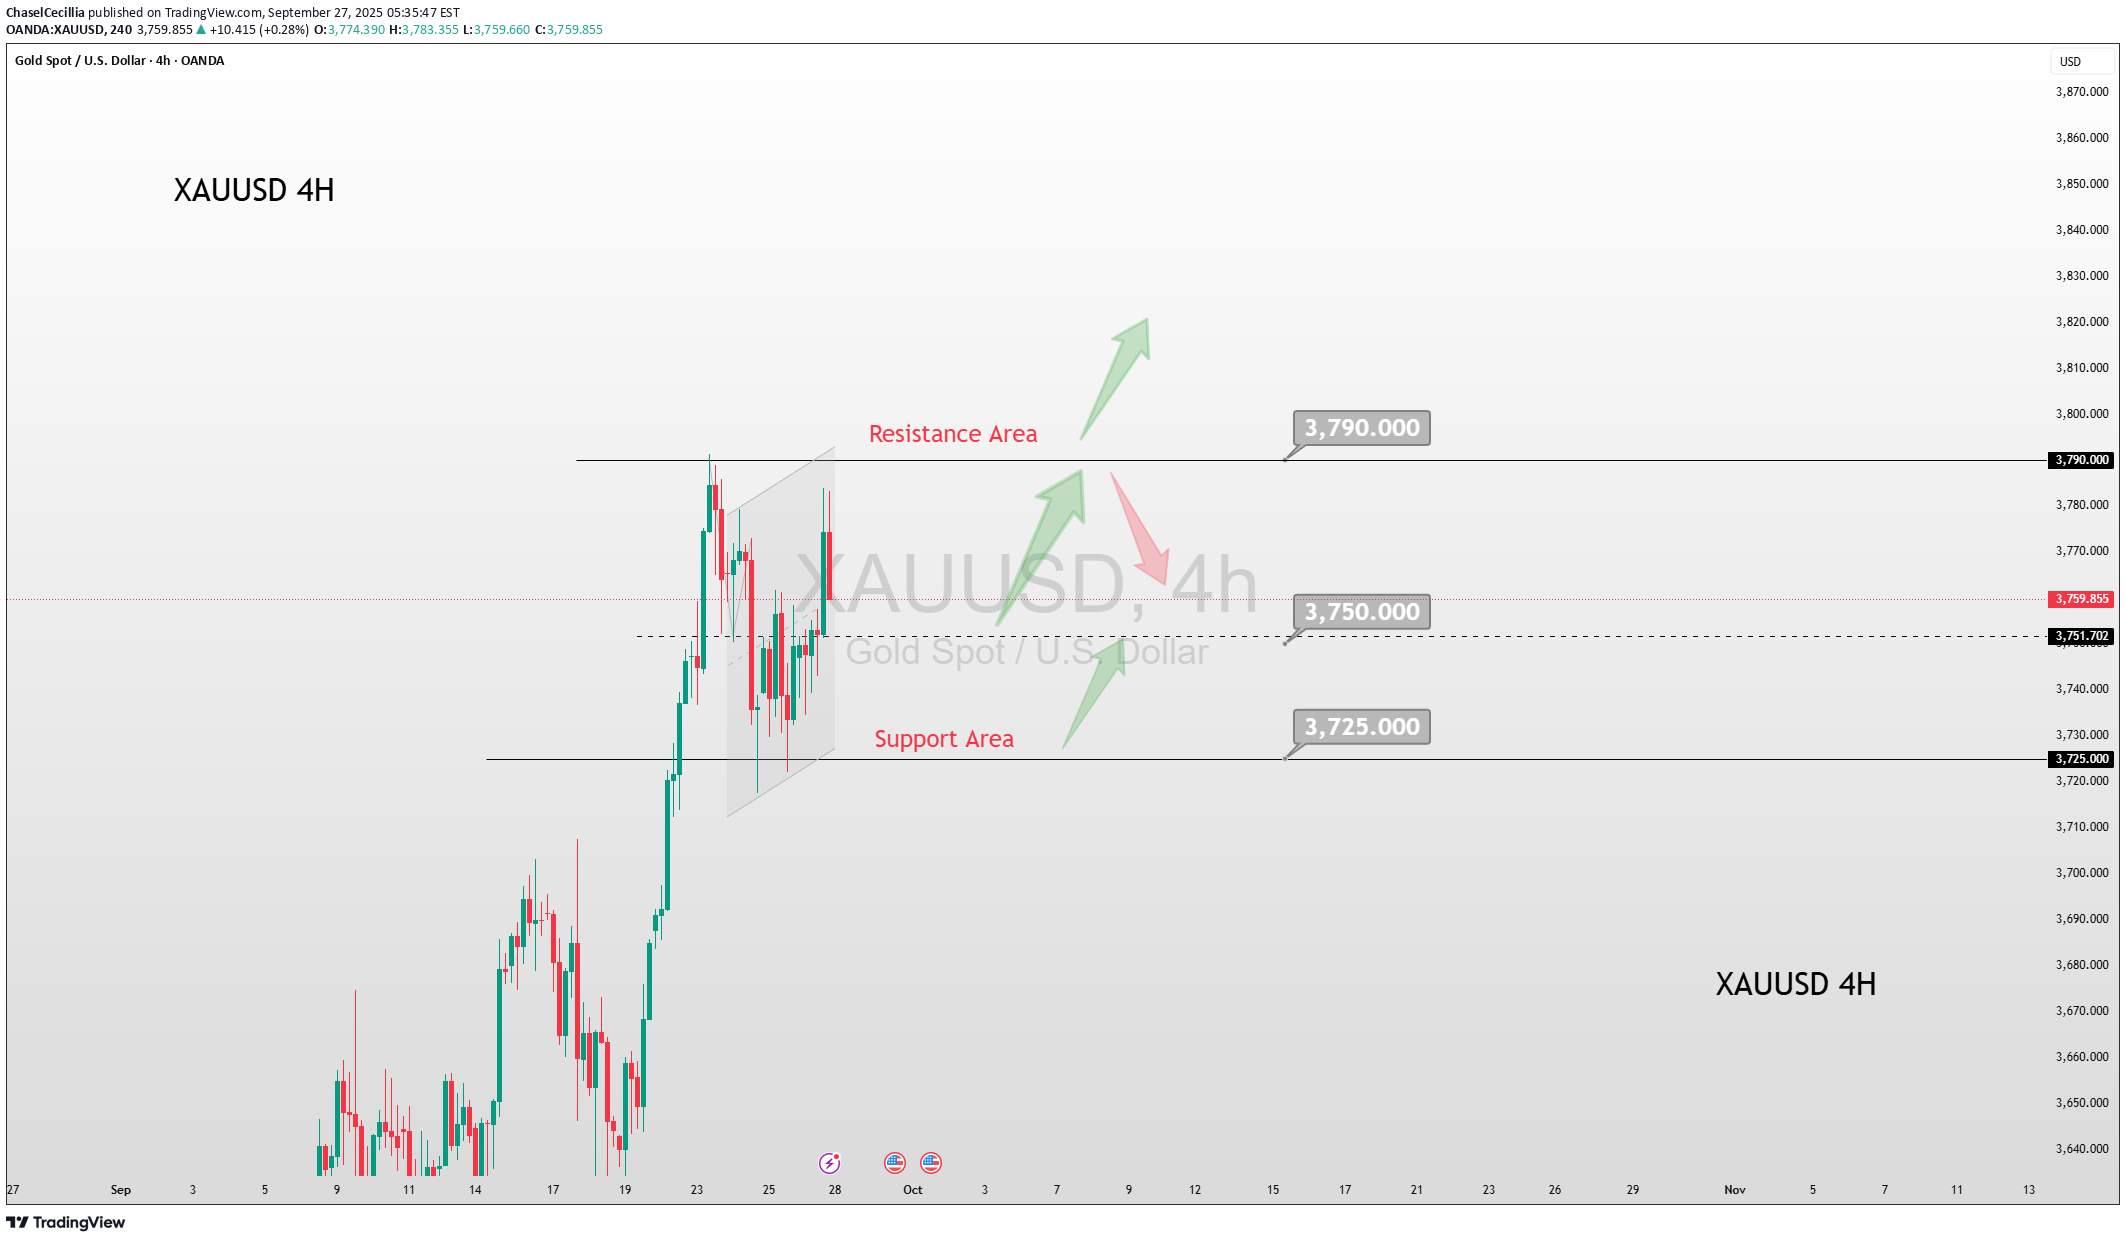
After narrow-range fluctuations during Friday's daytime session, gold surged higher and then pulled back in the evening, influenced by silver's movement. On the daily chart, it finally closed with a small bullish candle and a long upper wick. For next week, we continue to expect high-level consolidation – the strong pattern of consecutive bullish candles on the weekly chart remains intact, and the overall trend is still bullish. In the short term, the market is using a "time for space" approach to replace a full correction; once the consolidation ends, the uptrend will resume. We will not attempt to predict the top. On the 4-hour timeframe, the candlestick touched the upper band of the Bollinger Bands and then retreated, with the Bollinger Bands showing a narrowing trend. At the opening of next week, we first look for consolidation, and a clear direction is expected to emerge only after the release of the Nonfarm Payrolls data. Key resistance levels to watch are 3783 and 3800, while support levels are 3740 and 3725. XAUUSD buy @3740-3750 tp:3770-3790-3810 Investment itself is not the source of risk; it is only when investment behavior escapes rational control that risks lie in wait. In the trading process, always bear in mind that restraining impulsiveness is the primary criterion for success. I share trading signals daily, and all signals have been accurate without error for a full month. Regardless of your past profits or losses, with my assistance, you have the hope to achieve a breakthrough in your investment.No matter how volatile the market is, maintaining a rational and calm investment mindset remains the key to success. It is hoped that everyone can achieve desired returns in the upcoming transactions, adjust their investment strategies in a timely manner, and seize every opportunity.
During the European trading session, gold has been range-bound between 3740 and 3755. After consecutive consolidation, short-term moving averages have shown signs of turning upward, indicating that market momentum is accumulating. From the 4-hour chart, the technical pattern has gradually completed its repair, and the candlestick has successfully stood above the short-term moving averages—this signals the trend is shifting to a stronger one. The high-level consolidation pattern on the daily chart also leans bullish, and the overall technical outlook supports a bullish bias for the evening's movement. In terms of trading strategy, it is recommended to prioritize long positions at lower levels, with key focus on the effectiveness of the support around the 3750 level. If the price stabilizes and breaks through the 3790 resistance in the evening, it is expected to further open up upward space. It should be noted that for bullish momentum to continue, the pullback range in the current period should not be excessive, to avoid excessive retracement damaging the short-term technical structure. XAUUSD sell @3785-3790 tp:3770-3760-3750 buy @3755-3765 tp:3780-3790-3800 Investment itself is not the source of risk; it is only when investment behavior escapes rational control that risks lie in wait. In the trading process, always bear in mind that restraining impulsiveness is the primary criterion for success. I share trading signals daily, and all signals have been accurate without error for a full month. Regardless of your past profits or losses, with my assistance, you have the hope to achieve a breakthrough in your investment.Late - day volatility is expected to be limited. You can refer to this strategy. Consider placing short orders around 3785 and long orders around 3770. It is recommended to enter with a light position and be sure to set SL strictly.
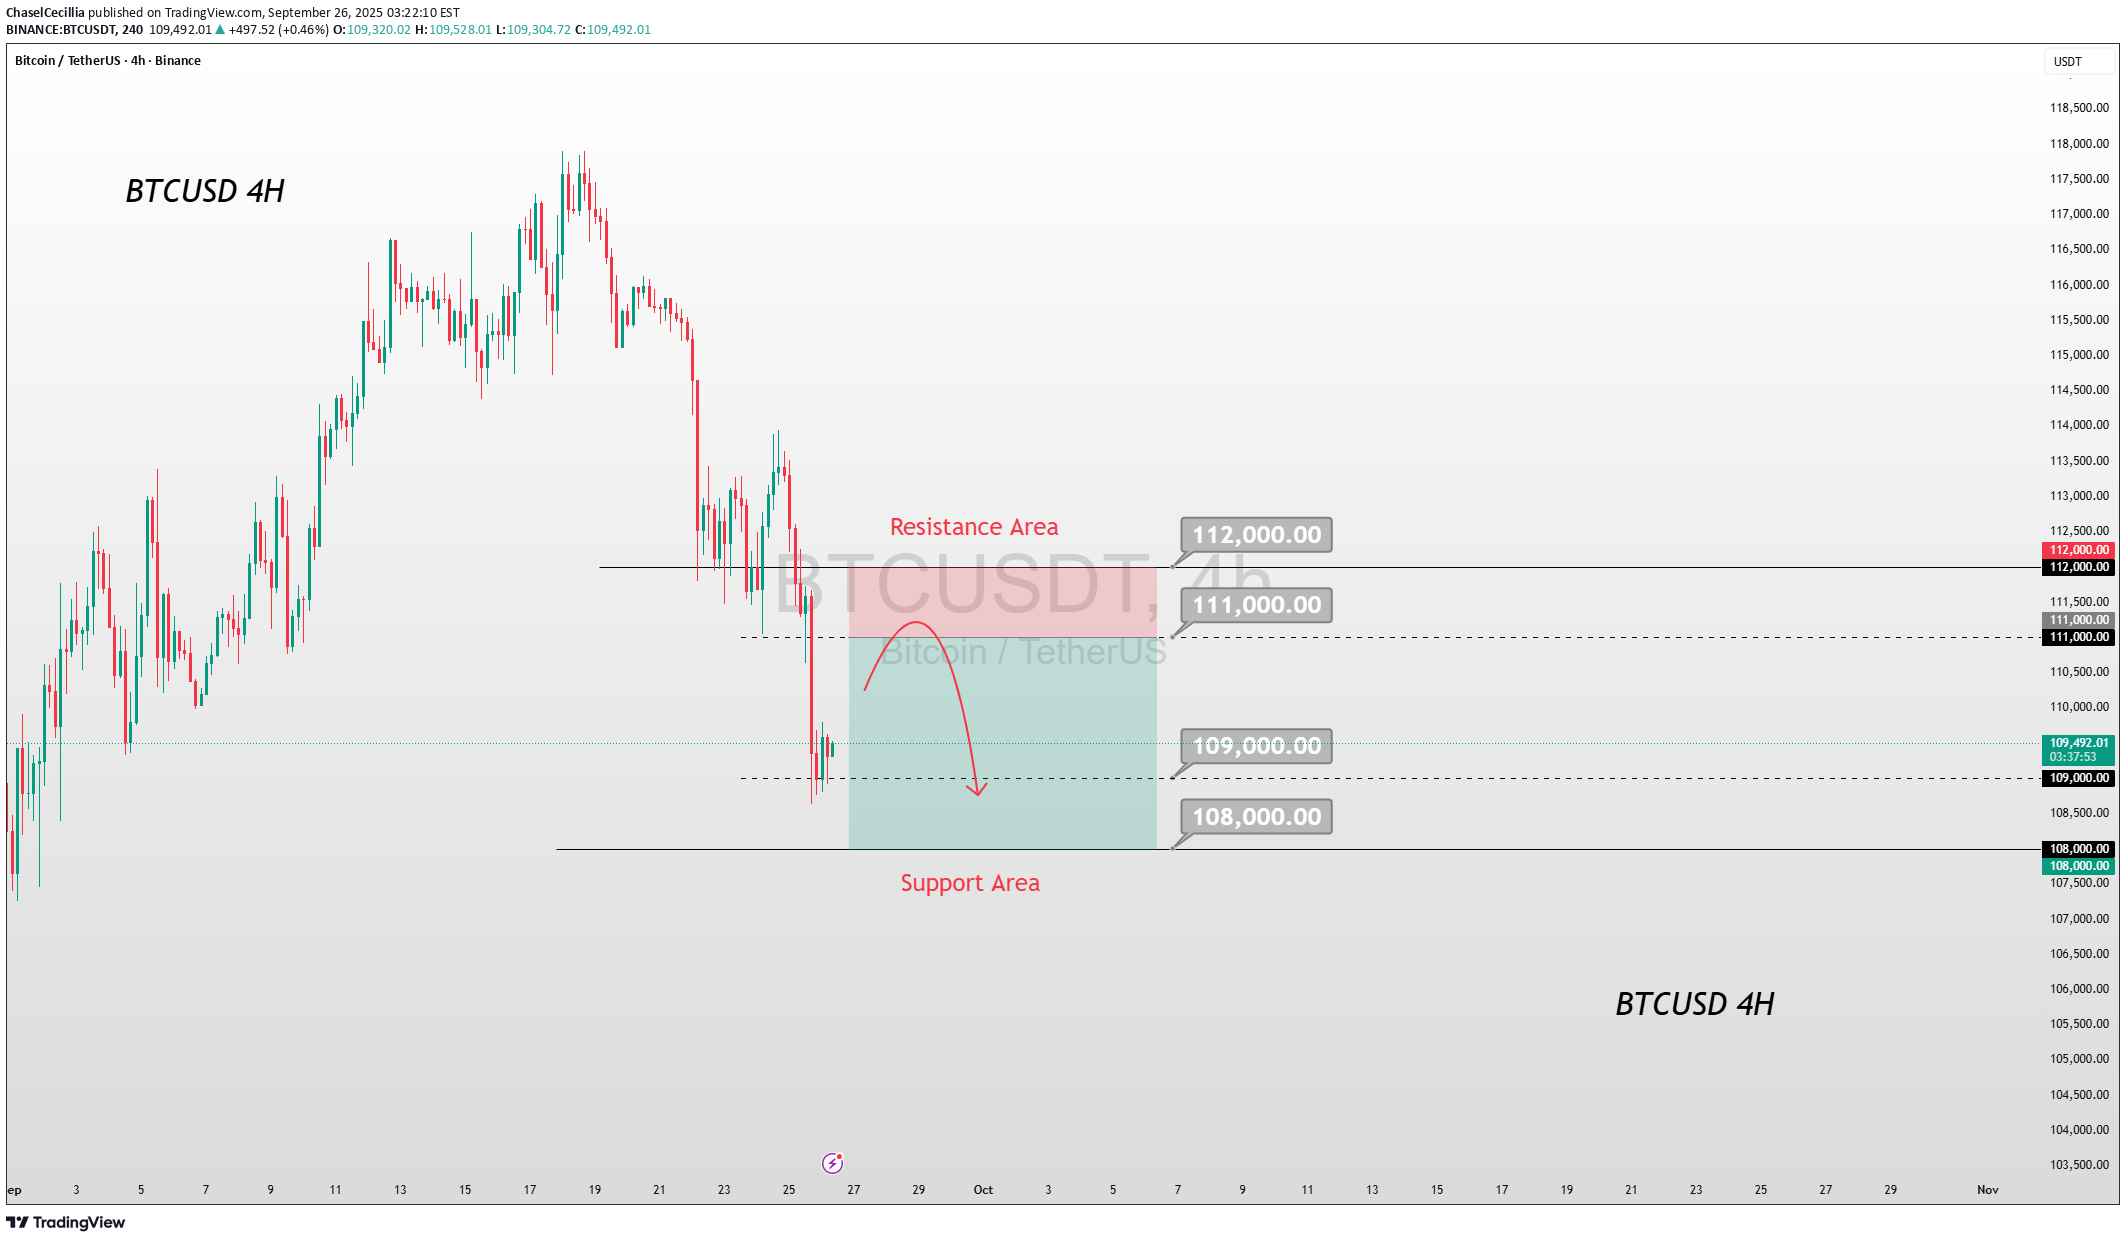
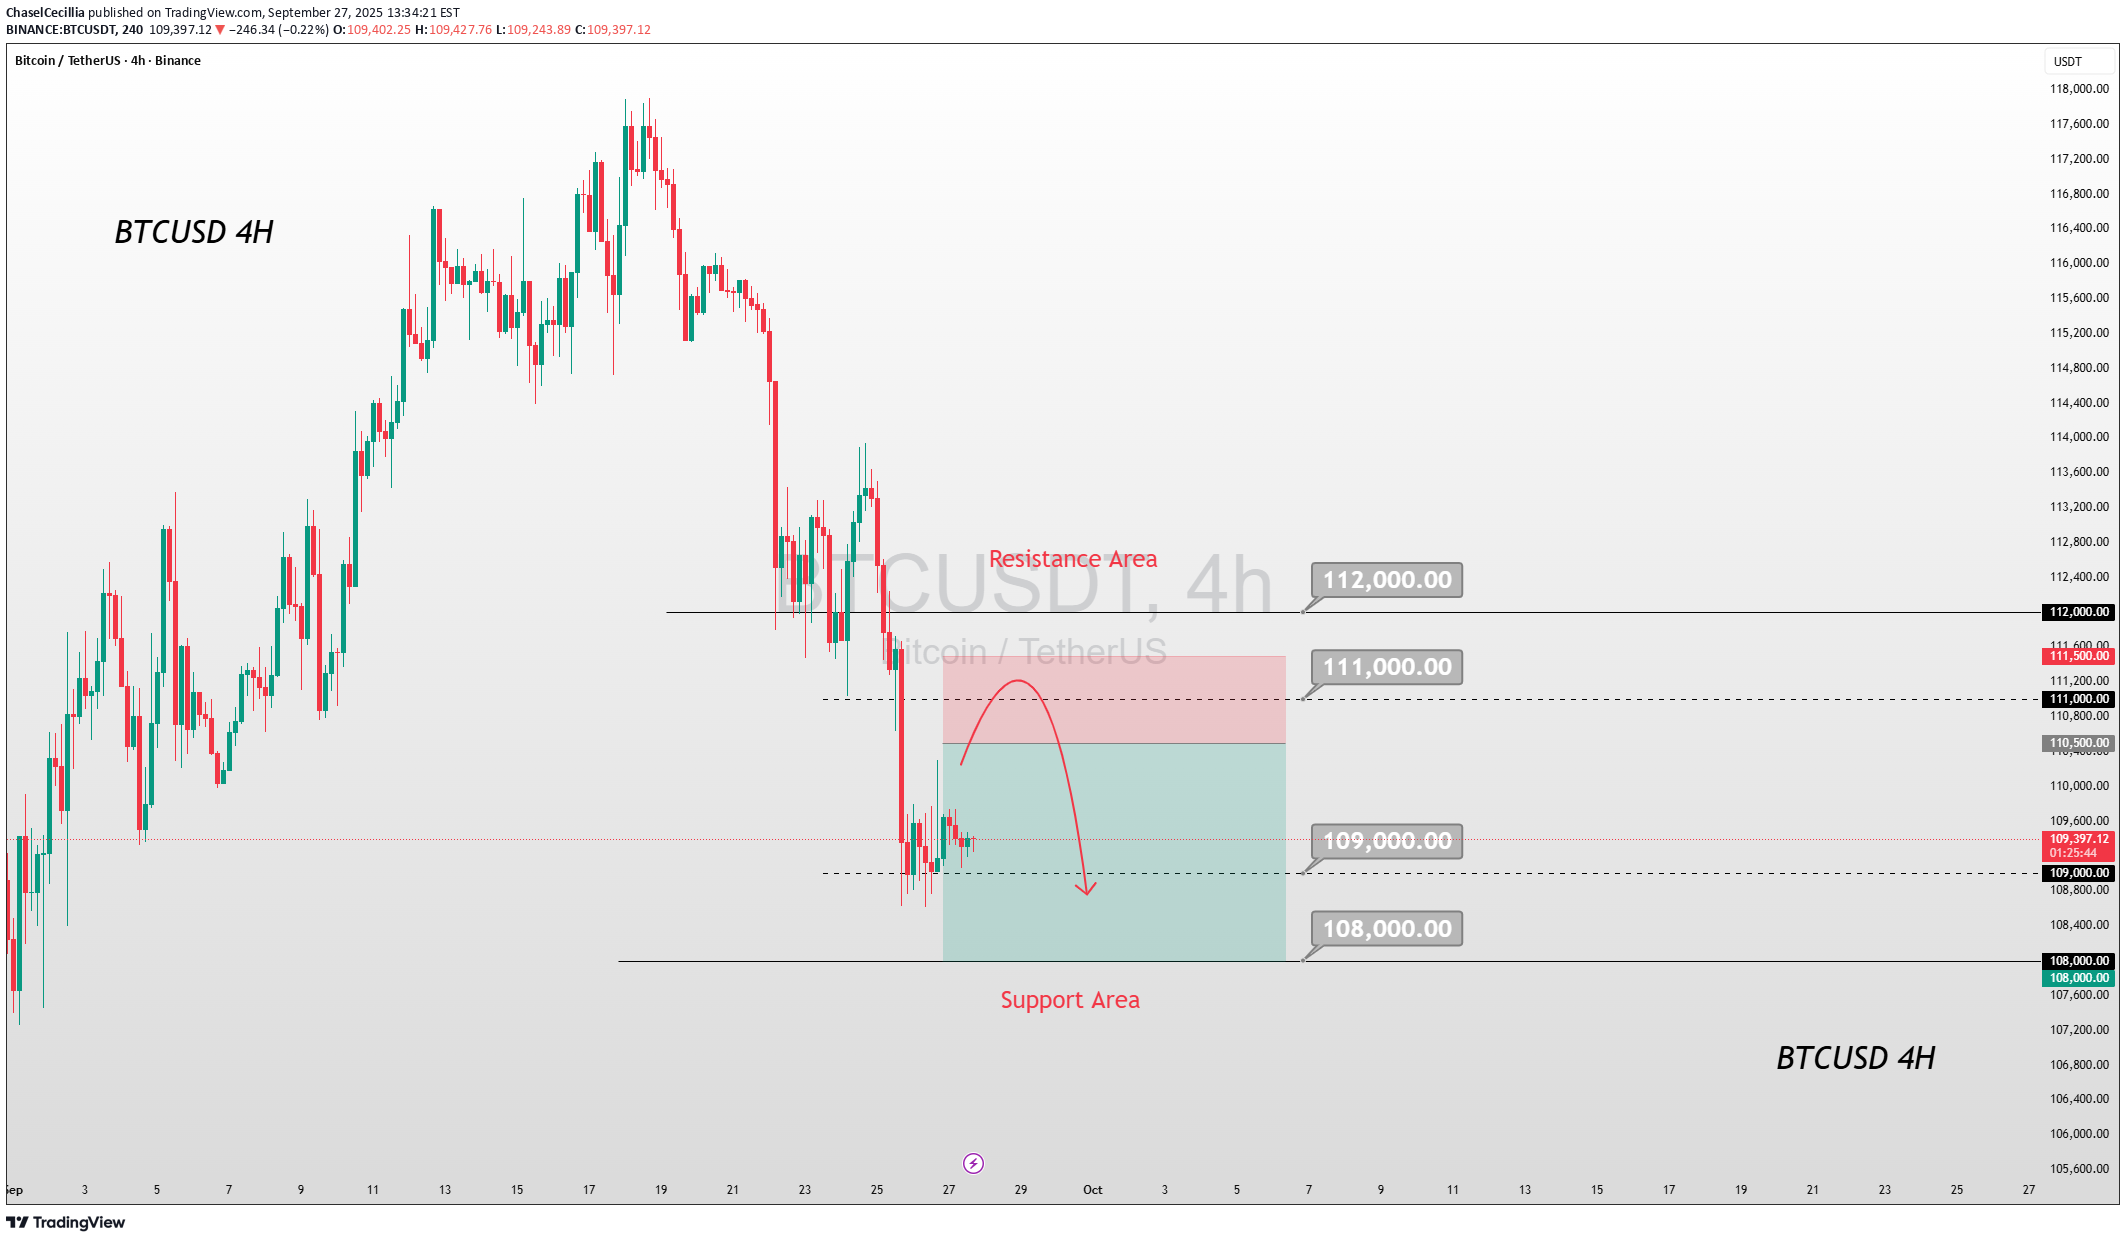
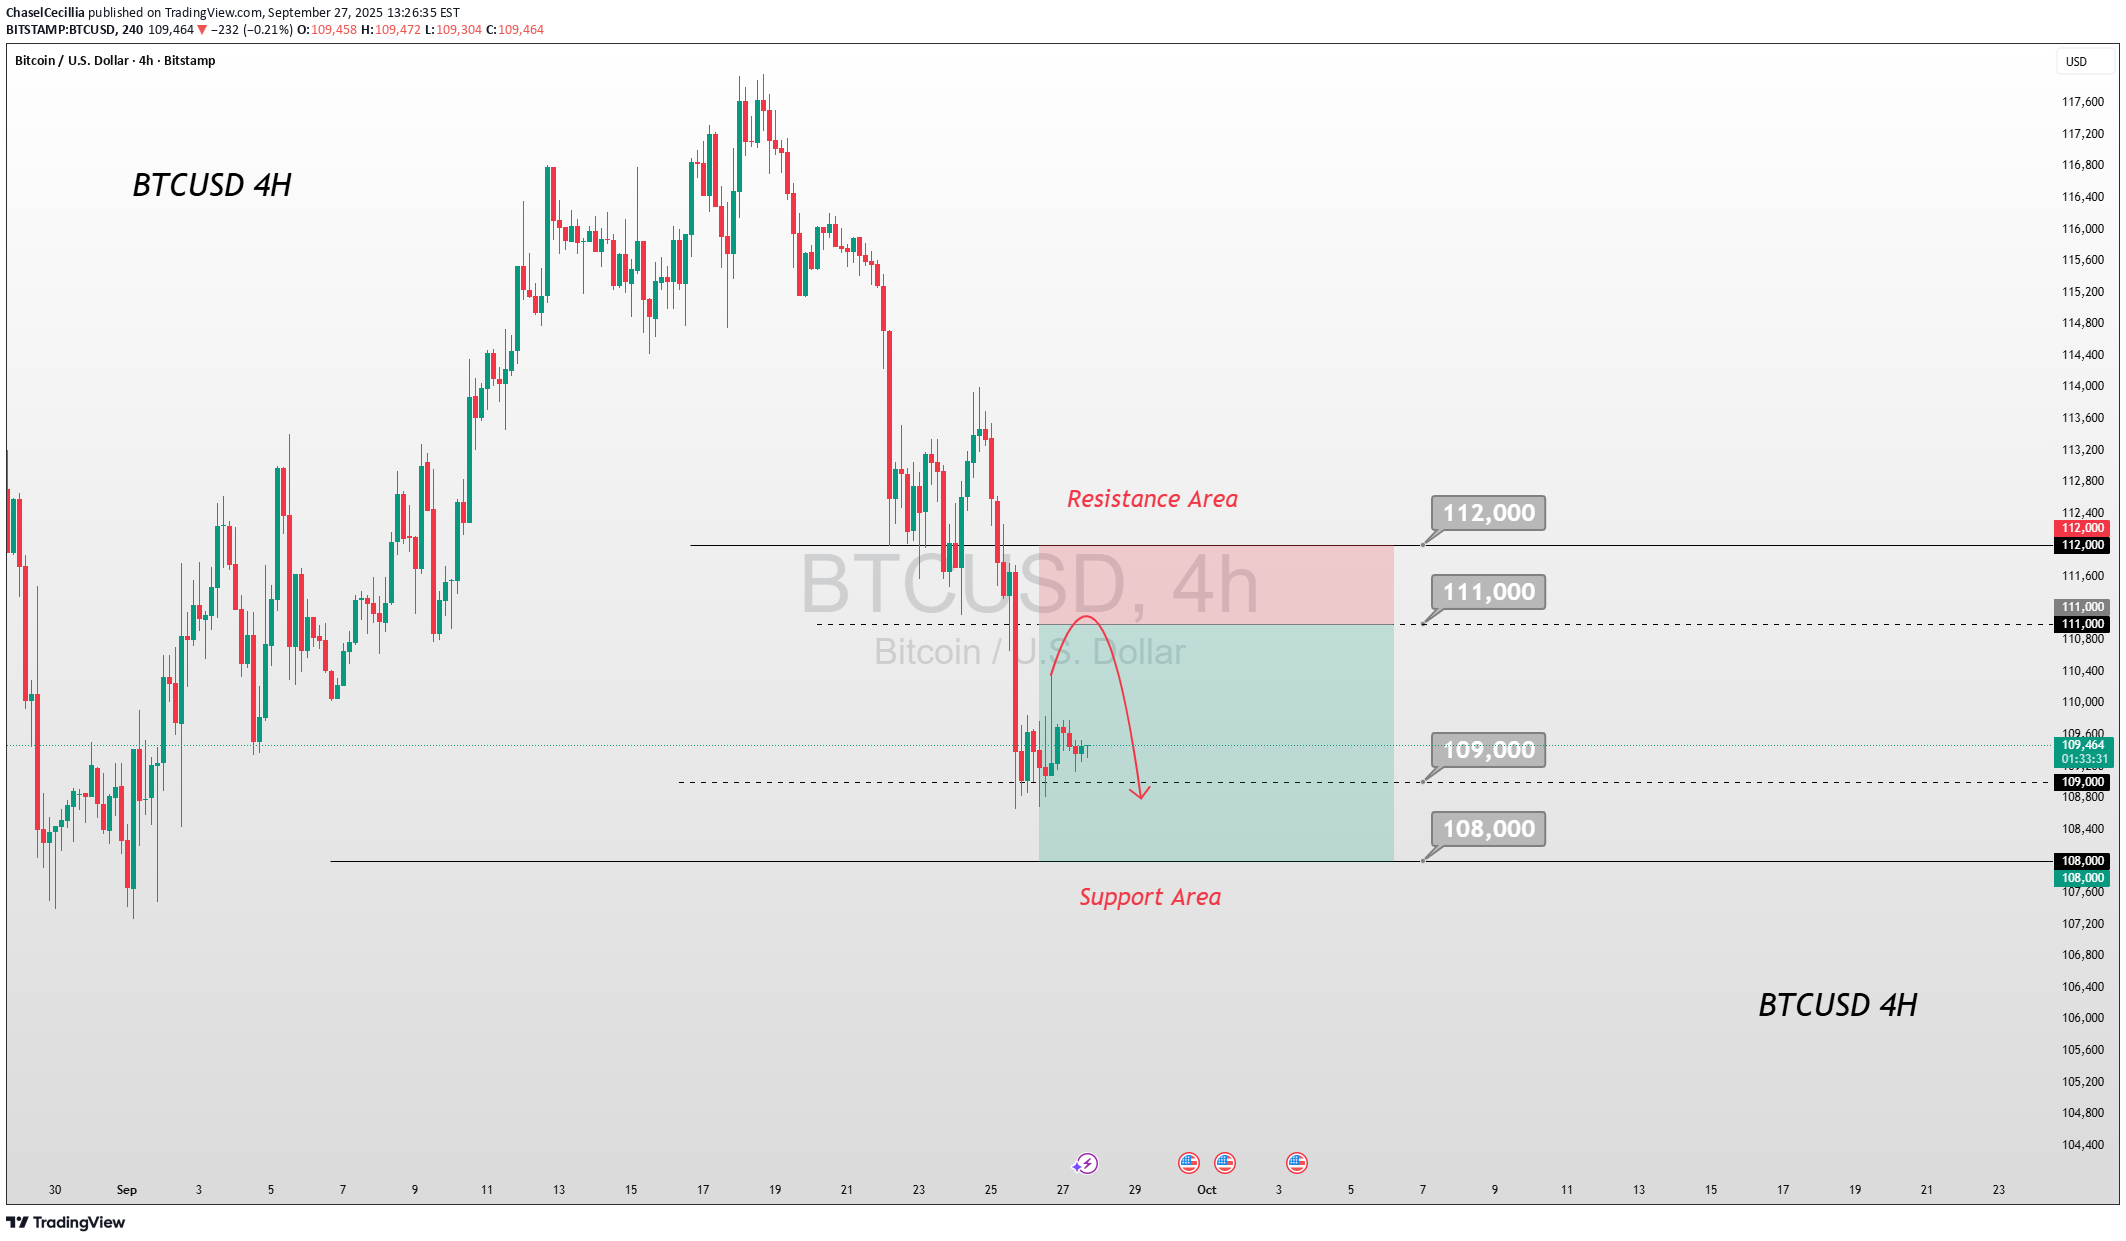
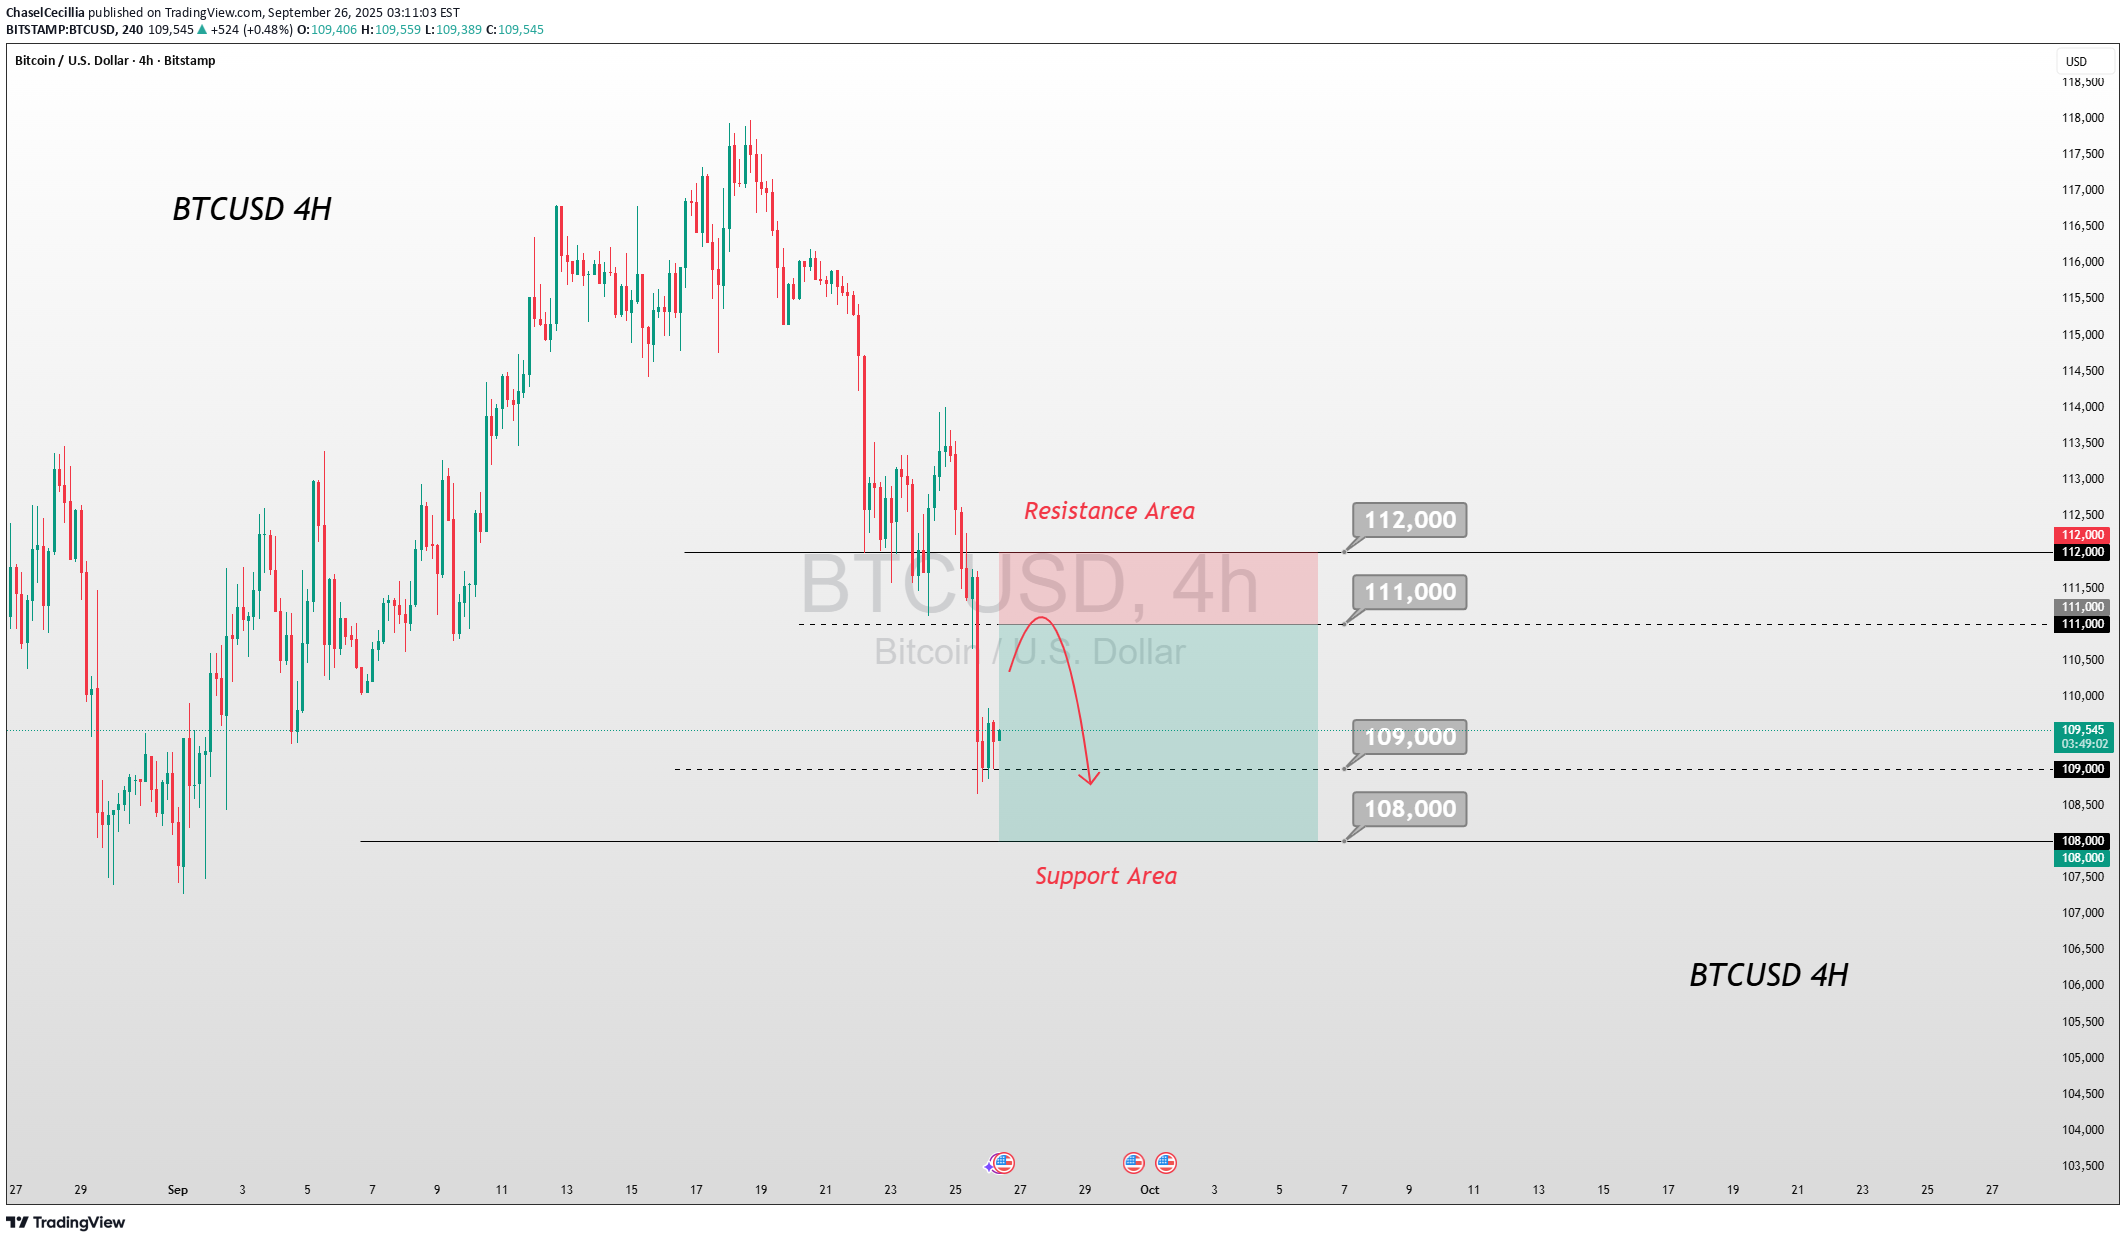
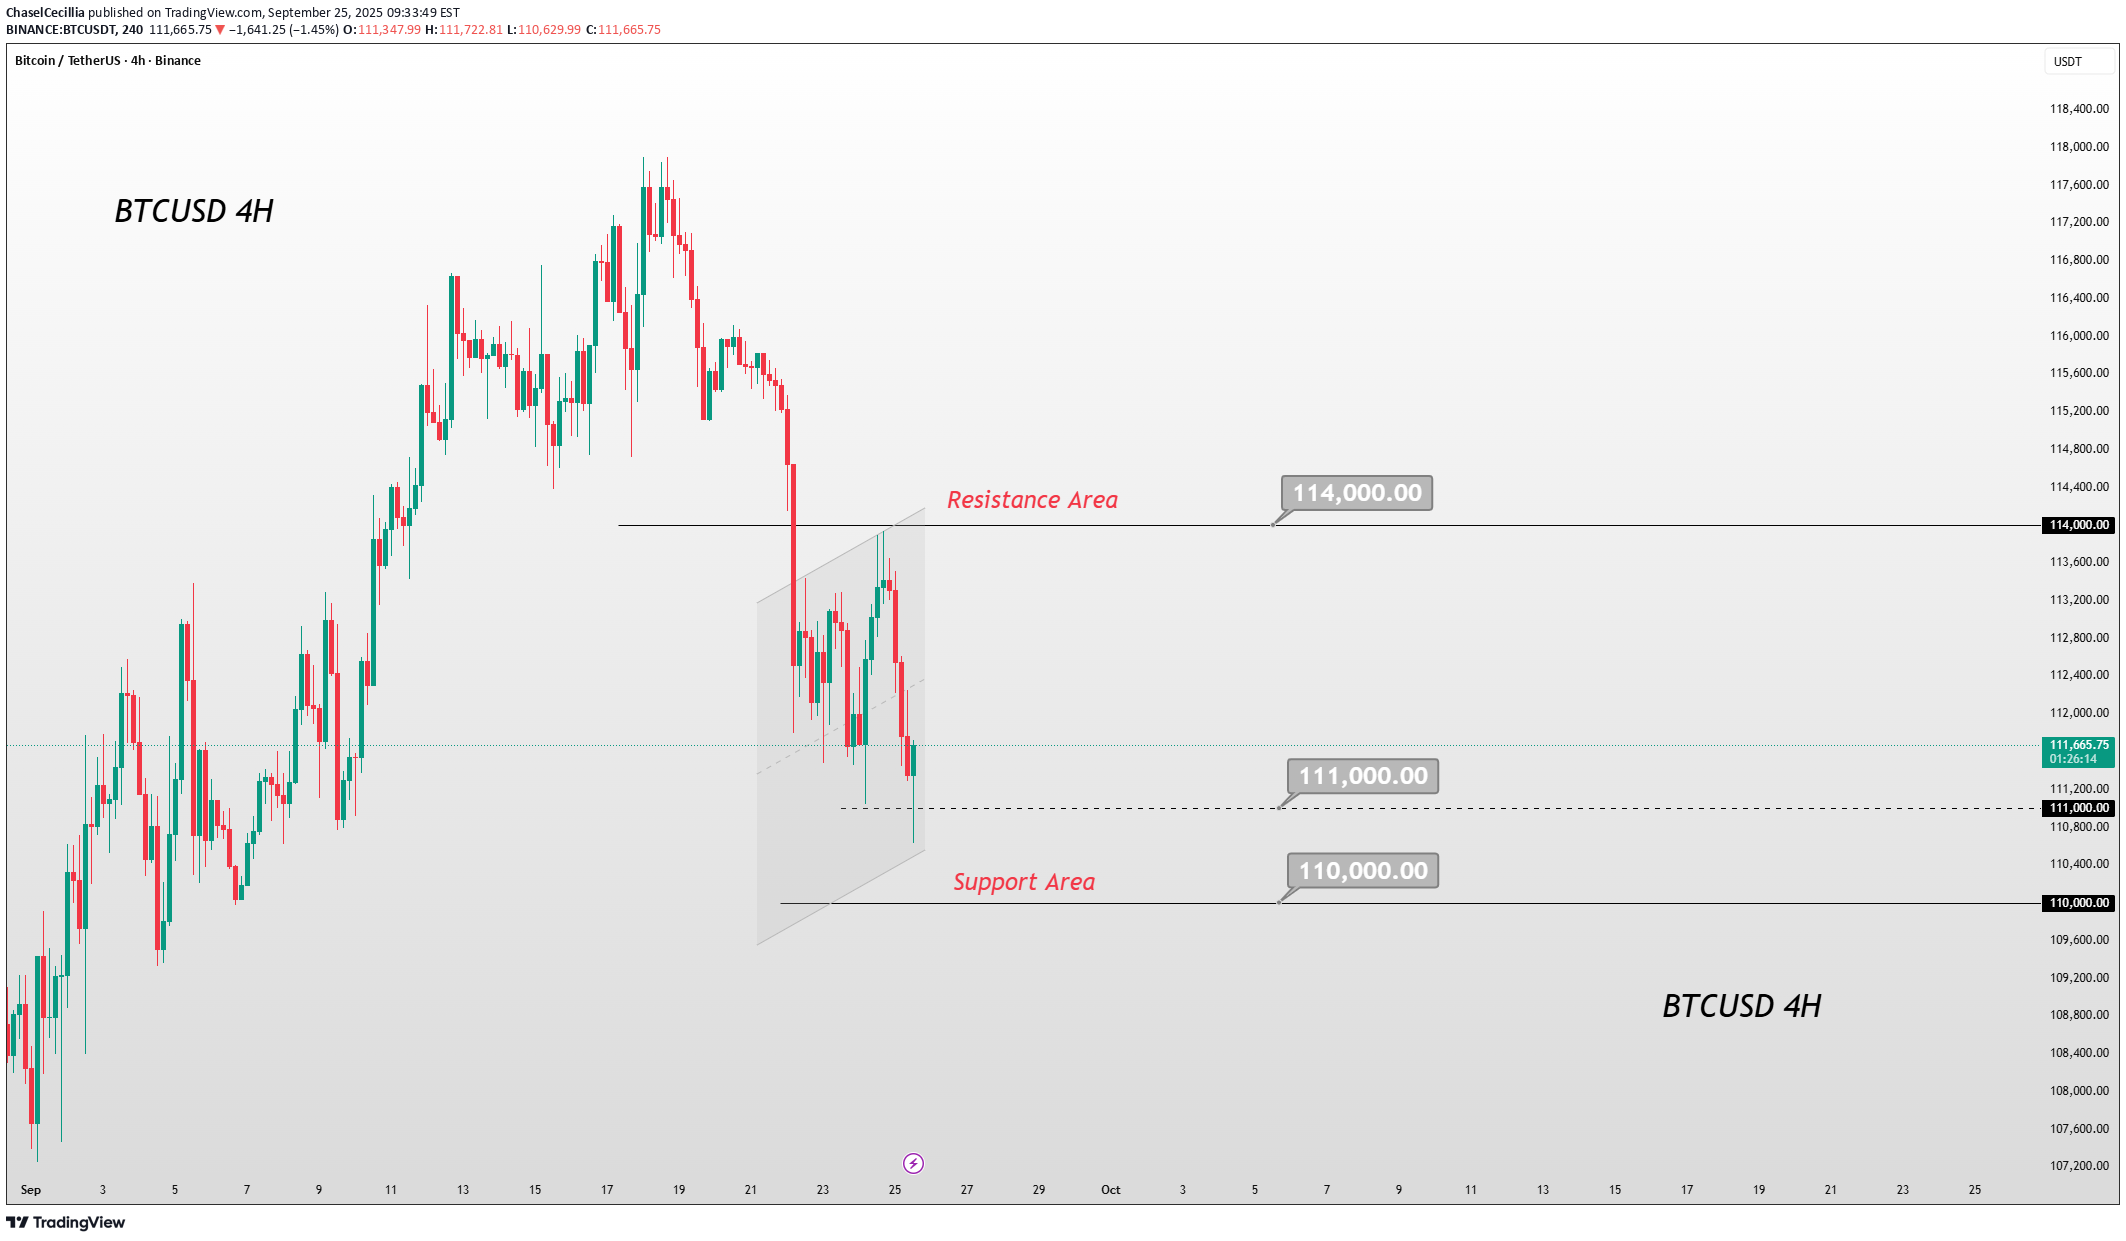
Bitcoin has currently broken below the consolidation range at the $11,000 level and dropped to around $109,500, indicating that bears have begun to take short-term control. The pullback under pressure at this key resistance level suggests strong selling pressure in the area, and the market's short-term momentum has weakened significantly. From a technical perspective, the current breakdown implies that prices may move further lower to seek support. The primary target level to watch is around the $109,000 mark; if this level is breached, the next key support will be the $108,000-$108,500 zone. Overall, the trading strategy should prioritize shorting on rallies. An ideal entry point for short positions can focus on the $110,000-$110,500 range, which has now turned into resistance. If signs of stalled upward momentum appear when the price rebounds to this range, it can be regarded as a favorable entry opportunity. BTCUSD sell @110500-111000 tp:109000-108000 Investment itself is not the source of risk; it is only when investment behavior escapes rational control that risks lie in wait. In the trading process, always bear in mind that restraining impulsiveness is the primary criterion for success. I share trading signals daily, and all signals have been accurate without error for a full month. Regardless of your past profits or losses, with my assistance, you have the hope to achieve a breakthrough in your investment.Bitcoin has been under continuous pressure at the 111,000 level. If you had placed short orders according to our strategy earlier, you would have already reaped considerable profits by now. It is recommended that you close your positions in a timely manner to lock in gains when the Bitcoin price pulls back to the range of 109,000 - 108,000. Bitcoin is expected to have limited volatility over the weekend, and you may adopt a range - trading strategy within the interval of 108,500 - 110,500.
Bitcoin has currently broken below the consolidation range at the $11,000 level and dropped to around $109,500, indicating that bears have begun to take short-term control. The pullback under pressure at this key resistance level suggests strong selling pressure in the area, and the market's short-term momentum has weakened significantly. From a technical perspective, the current breakdown implies that prices may move further lower to seek support. The primary target level to watch is around the $109,000 mark; if this level is breached, the next key support will be the $108,000-$108,500 zone. Overall, the trading strategy should prioritize shorting on rallies. An ideal entry point for short positions can focus on the $110,000-$110,500 range, which has now turned into resistance. If signs of stalled upward momentum appear when the price rebounds to this range, it can be regarded as a favorable entry opportunity. BTCUSD sell @110500-111000 tp:109000-108000 Investment itself is not the source of risk; it is only when investment behavior escapes rational control that risks lie in wait. In the trading process, always bear in mind that restraining impulsiveness is the primary criterion for success. I share trading signals daily, and all signals have been accurate without error for a full month. Regardless of your past profits or losses, with my assistance, you have the hope to achieve a breakthrough in your investment.Bitcoin has been under continuous pressure at the 111,000 level. If you had placed short orders according to our strategy earlier, you would have already reaped considerable profits by now. It is recommended that you close your positions in a timely manner to lock in gains when the Bitcoin price pulls back to the range of 109,000 - 108,000. Bitcoin is expected to have limited volatility over the weekend, and you may adopt a range - trading strategy within the interval of 108,500 - 110,500.
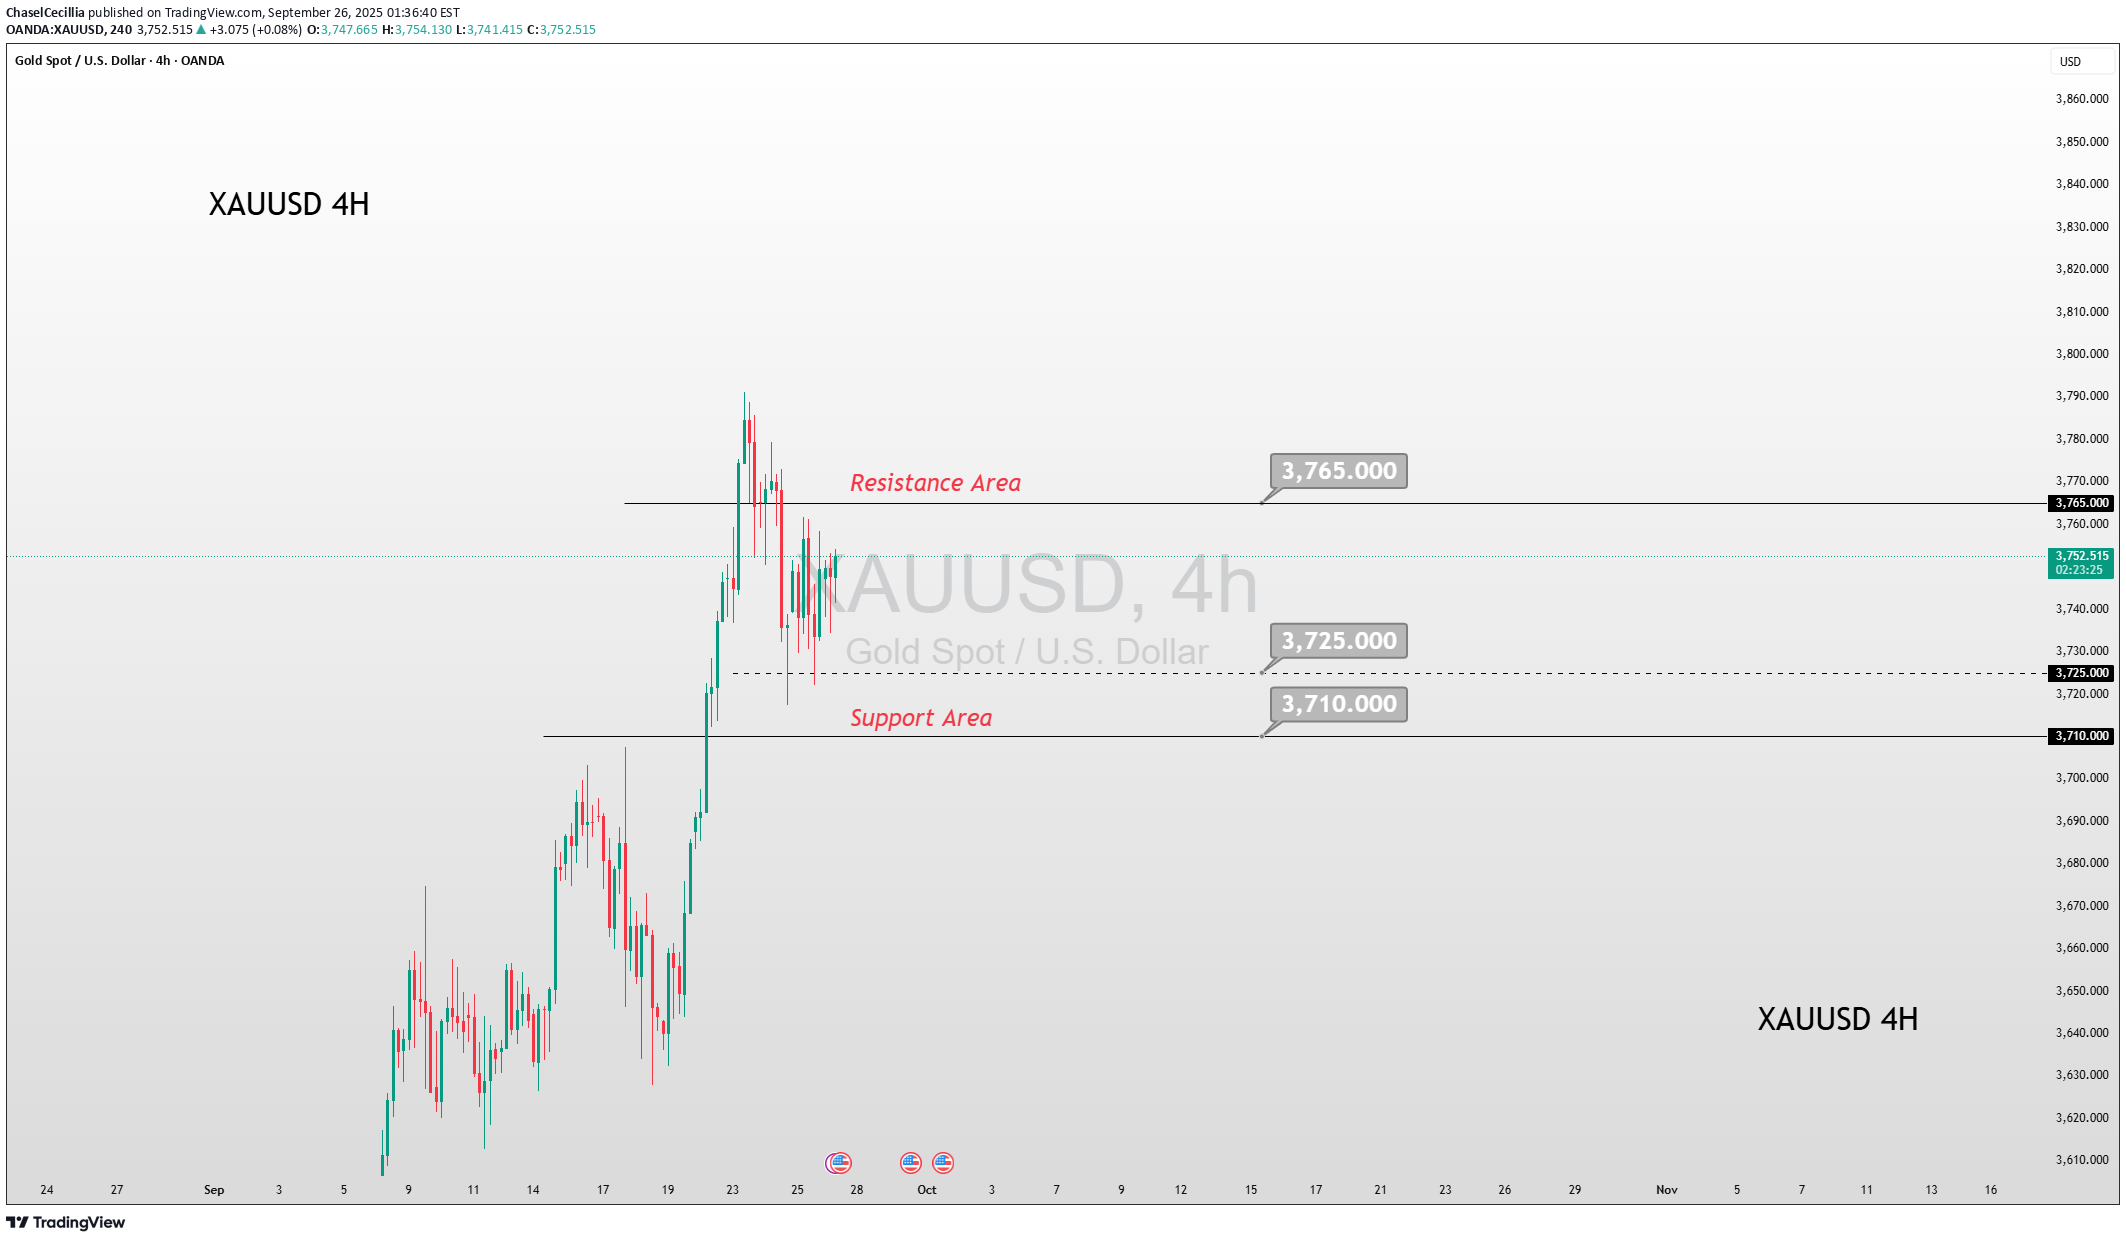
Yesterday, gold traded in a washout and consolidation pattern, and the 3760-3725 trading range outlined in the strategy was realized as expected, with the daily chart finally closing with a small bullish candle. Currently, the pattern of high-level anti-drop correction remains unchanged, so a consolidation-focused approach is still appropriate for today's trading. From the 4-hour timeframe perspective, the Bollinger Bands are in a flat-mouthed formation, with gold fluctuating around the middle band — this is a typical "time-for-space" correction method. The overall trend remains bullish: in the short term, if the 3755 resistance level fails to be broken, gold is likely to continue consolidating, and traders may attempt to enter light short positions; once it stabilizes above this level, we can further look for upside momentum towards the 3765 and 3780 levels. For downside support, focus on 3725 and 3710. The expected core trading range for today is 3755-3720, and the "sell high and buy low" strategy can be adopted until a breakout occurs. Among these levels, 3710 remains the core support level, which is a key top-bottom reversal position. XAUUSD buy @3725-3730 tp:3750-3760-3770 Investment itself is not the source of risk; it is only when investment behavior escapes rational control that risks lie in wait. In the trading process, always bear in mind that restraining impulsiveness is the primary criterion for success. I share trading signals daily, and all signals have been accurate without error for a full month. Regardless of your past profits or losses, with my assistance, you have the hope to achieve a breakthrough in your investment.As we analyzed earlier, there is short-term resistance around the 3755 level, so you can try to take a small position for short-term short orders. If the gold price stabilizes above this level, it can further move up towards the 3765 and 3780 levels afterward; otherwise, the gold price will most likely continue to fluctuate. Moreover, using a small stop-loss to test the effectiveness of the short-term resistance at 3755 is also a relatively reasonable trading approach.After gold successfully broke through the short-term resistance around the 3755 level during the US trading session, it has now climbed to the 3770 level and will next test the upper resistance at 3780. It should be noted that if the bullish momentum is to continue, the pullback range in the current period should not be too large, to prevent excessive retracement from damaging the short-term technical structure.
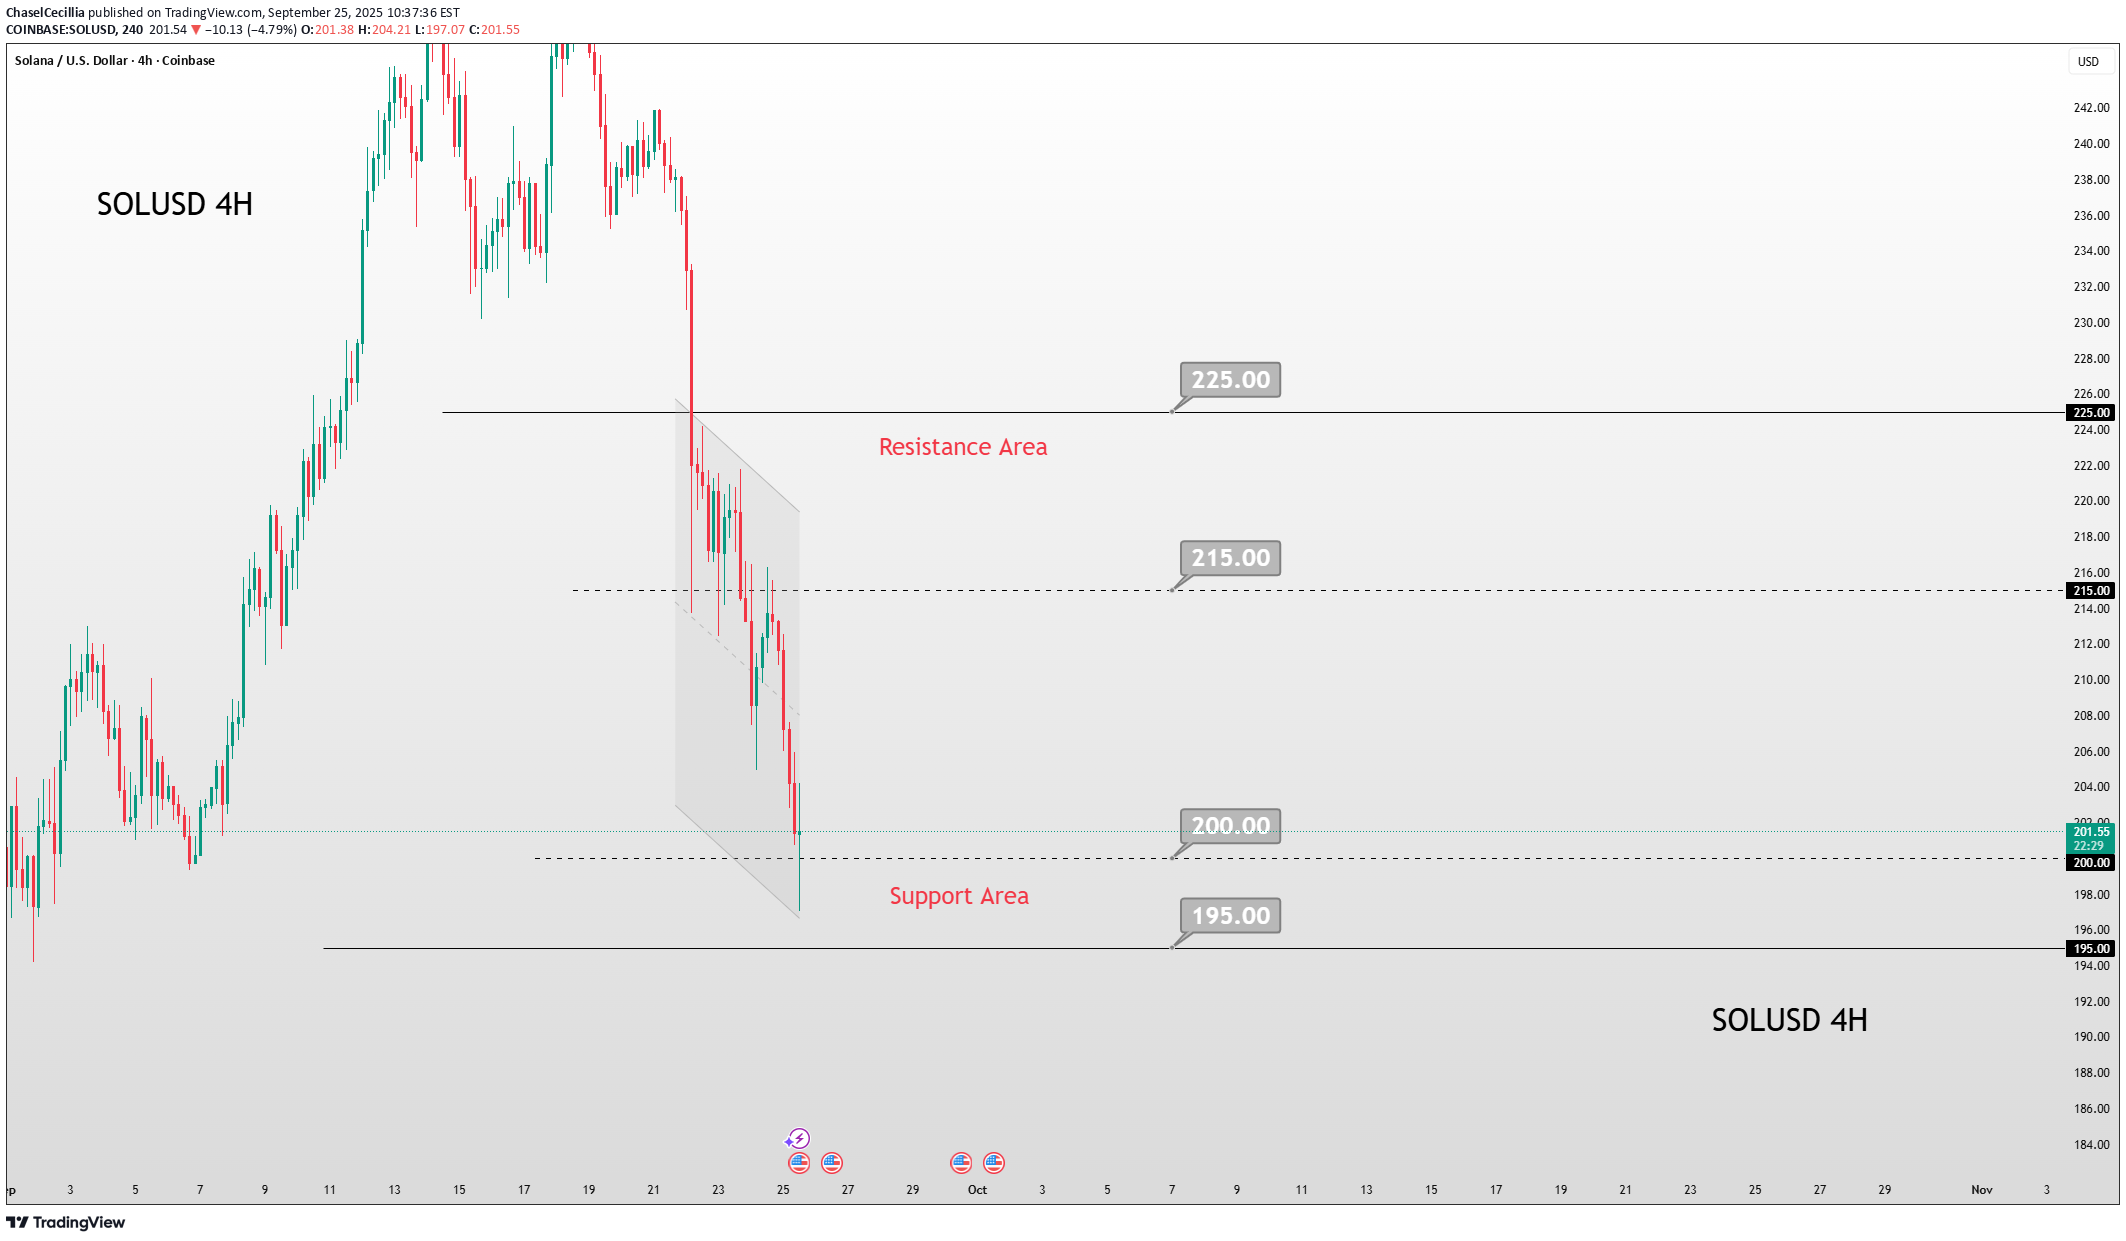
From the daily timeframe perspective, SOL has declined for five consecutive days, with the MACD indicator continuously issuing bearish signals, and bearish momentum is clearly dominant at present. However, it is worth noting that a "bottom divergence" pattern has emerged on the 4-hour chart, which indicates that a minor short-term rebound may occur at any time. Currently, the price is fluctuating around the 200 level. Tonight, we need to focus on two key levels: first, the support strength at the 200 level, and second, whether the lower band of the Bollinger Bands can be effectively held to help stabilize the price. SOLUSD buy @195-200 tp:215-225 Investment itself is not the source of risk; it is only when investment behavior escapes rational control that risks lie in wait. In the trading process, always bear in mind that restraining impulsiveness is the primary criterion for success. I share trading signals daily, and all signals have been accurate without error for a full month. Regardless of your past profits or losses, with my assistance, you have the hope to achieve a breakthrough in your investment.
After BTC underwent a strong 4-hour decline with three consecutive bearish candles, its price touched the lower band of the Bollinger Bands and staged a bottoming rebound, pushing the short-term trend back into a phase of long-short rivalry. Currently, the market has formed a short-term consolidation range between the retracement low of 110,800 and the rebound high of 113,900, with the trend gradually converging into a horizontal consolidation pattern. For trading operations: if the price holds steadily above the retracement low of 110,800, it can be considered a short-term long opportunity; if the rebound fails to effectively break through the resistance around 113,900, you may follow up with short positions. Overall, adhere to a range-bound strategy of buying low and selling high. XAUUSD buy @110800-111300 tp:112500-113500 Investment itself is not the source of risk; it is only when investment behavior escapes rational control that risks lie in wait. In the trading process, always bear in mind that restraining impulsiveness is the primary criterion for success. I share trading signals daily, and all signals have been accurate without error for a full month. Regardless of your past profits or losses, with my assistance, you have the hope to achieve a breakthrough in your investment.
Disclaimer
Any content and materials included in Sahmeto's website and official communication channels are a compilation of personal opinions and analyses and are not binding. They do not constitute any recommendation for buying, selling, entering or exiting the stock market and cryptocurrency market. Also, all news and analyses included in the website and channels are merely republished information from official and unofficial domestic and foreign sources, and it is obvious that users of the said content are responsible for following up and ensuring the authenticity and accuracy of the materials. Therefore, while disclaiming responsibility, it is declared that the responsibility for any decision-making, action, and potential profit and loss in the capital market and cryptocurrency market lies with the trader.