
ChartTrail
@t_ChartTrail

What symbols does the trader recommend buying?
Purchase History
پیام های تریدر
Filter
ChartTrail
Countertrend Trade BTCUSDT

Although the trend on a larger timeframe supports upward movement, short sell plays also provide a noteworthy risk-to-reward ratio. Therefore, short trades have larger reward comparing to the long trades at this moment Trading Strategies; 1) Scale in short at only 30% of the desired positions at this moment/supply zone around 44k-44.5k 2) Move in to 100% of short position at 45k-47k 3) SL if the price goes beyond 48k Note: Trading against trend is considered as a high risk taking trade. Please ensure to follow the plan and stop loss when required. Most importantly, understand your position sizing and accept the amount of money you can lose before going in on a trade
ChartTrail
Short XAUUSD 20-Dec-23

Gold to continue its movement in sideway between 2048-2010 Trading Strategies 1) Short 2) SL at 2047 3) TP at 2020 and 2010 2010 is the next significant support area To determine the candlestick formation around 2010 and go long again with smaller risks on long position
ChartTrail
Crazy Bull Catching the BTC train

It is clear that BTC is on a very strong uptrend direction with steep movement. However, it is not a good position to start buying here since the next resistance level can be reached at anytime around 45.5k Strategy is to wait for a retest of selling at pressure on a daily timeframe. It can be expected for BTC to retest at 37.5k-38k If there is a formation of any reversal candle pattern such as hammer, bullish traders may reappear again. Trading Plan: 1) Buy at the higher high of reversal candlestick near significant support level of 37.5k-38k 2) hold until previous swing high and take partial profits (Traders may choose the position level at their own discretion) 3) Run trend for the remaining until the structure shift
ChartTrail
Short XAUUSD after Strong Rejection at All Time High

After strong rejection at the new all time high level earlier this week, the price structure of XAUUSD in 1H timeframe has been shifted from uptrend to sideway-sideway down after 2035 level has been broken downward. Even though Gold may still look bullish on the bigger timeframe like daily timeframe, it is worth noting that Gold is still likely to move in a corrective pattern on a weekly level if it cannot hold strong or close above 2035 on a weekly candle. Strategy: Open Short positions around respective level of 2045 and 2061 after a bear reversal candle is followed by confirmation of bearish candle like engulfing SL at the high of reversal candlestick Don't forget to place a stoploss and stick to plan
ChartTrail
BTC - Wait to Buy/Long

Although it looks more rewarding on the short position, I do not suggest to go in on short because BTC uptrend structure has not been broken yet on a 1H timeframe. The strategy is to wait for buy Two Scenarios; 1) If BTC breaks 38k, wait for a retest around 38k and buy when reversal candle happens 2) Wait for a retest at lower bound of trading range at 35.7k and start scaling in Long position from 34.8k and 35.7k TP at 40k for the 1st Scenario TP at 38k and 40k for the 2nd Scenario SL at 38k for the 1st Scenario SL at 34.8k for the 2nd Scenario
ChartTrail
Trading Range Short BTCUSDT

Plans for BTC during the weekend, most likely will retest the support once more. 1) follow short after 1H candle closes below 37k 2) Place a SL at 38k 3) TP1 = 35.7-36k 4) Choice between holding until TP2 at 34k or go back to Long position when the reversal candles happen
ChartTrail
Daytrade Plan for XAUUSD

Following the previous XAUUSD post, the price pattern has completed the descending triangle formation and is reaching to the recommended TP2 zone, where traders should definitely start to take profits. The reason why we should start scaling out of sell/short positions here is because there are a cluster from multiple indications on this demand zone at 1900 area including: 1) POC from fixed range volume profile of the previous swing low-swing high 2) 161.8 target from fibonacci after the consolidation of descending triangle formation 3) EMA-200 day period Evidently, this demand zone is considered strong based on the cluster of 3 technical indications There will likely be a technical rebound near this area, where we can trade against the trend for a very short trade. However, it would not be wise to place a trade right away. The price actions should begin to form a range of consolidation and show a lower high first in 15m timeframe before placing a trade. SL: at the lowest point in 15m timeframe TP: at two cayenne lines are acting as minor resistances and should then be the TPs for this short trade plan: 1910, 1917 respectively. Again, this short trade plan is trading against trend which can be very risky. Therefore, do not forget to put a stoploss and place in proper risk management on your positions as always
ChartTrail
Gold to Move Sideway until Unemployment Claims&Fed's Testimonial
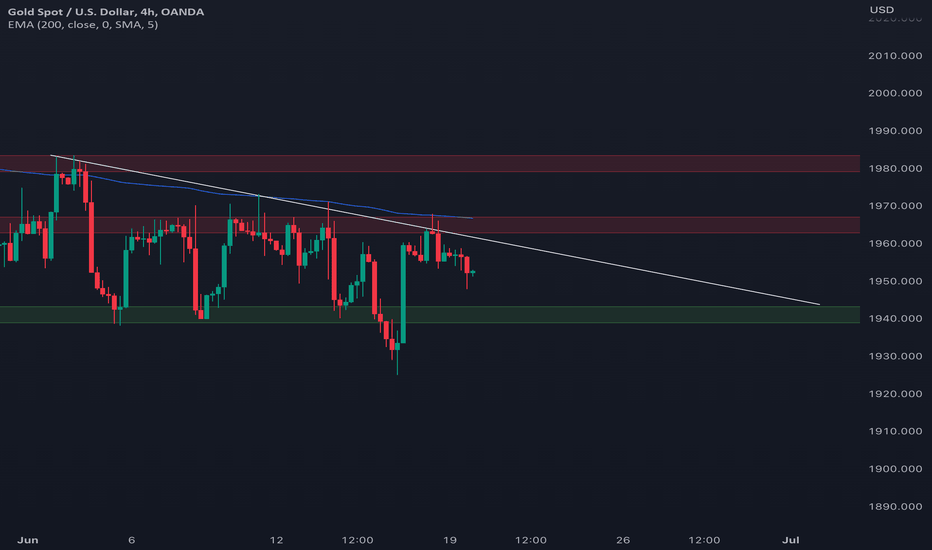
XAUUSD is currently forming a Descending Triangle Price Pattern in 4h timeframe. The price has reached a lower low last week after it has broken a strong demand zone around 1940 . However, the bulls re-appear and push the price back up to the significant supply zone near EMA 200-period in 4h timeframe at 1965 area, which was a great entry point to start accumulate short/sell positions. In addition to the strong supply zone at 200-period EMA, this zone also clusters with the downtrend line of the Descending Triangle Formation that signifies higher possibility of a re-test getting rejected. As statistics of Descending Triangle Price Pattern suggests, it would be more favorable for the bears to plan to short/sell: - Entry: Accumulate shorts near the downtrend line up until 200-period EMA on 4h timeframe - Stop loss: if the candlestick in 4h closes above 200-period EMA - TP1: at the previous support zone at 1940 - TP2: At 1900 Alternative Plan: If the price does not re-test the downtrend line or 200-period EMA, follow short after the candle closes below the 1940 zone Note: The descending triangle price pattern suggests more probability of bearish momentum being successful but does not mean it will always follow statistics, ensure that risk management plans are always in place when trading. Don't forget to stop loss and manage your order in accordance with the available margin
ChartTrail
XAUUSD Plan to Prepare for Unemployment Claims

From Risk to Reward Ratio Point of View, it is more favorable for the bulls to go for long position after the hammer price action was successfully formed at the support area of the parallel channel. Take profit at two levels: TP1: 1950.2 TP2: 1951.7 SL when the price closes below 1944.9
ChartTrail
BTCUSDT Breakout - Follow Short TF Day

BTCUSDT Breakout - Follow Short TF Day The reversal pattern Head and Shoulders was formed successfully with a strong price rejection when it re-tested on the uptrend-neckline around 28k, which is the greatest entry point for a swing short position. Although the best swing short opportunity for shorts have been missed, opportunities for shorts are still there. Follow short when the price breaks below strong support zone at 26550 Plans: - Follow short if price close below 26550 - Stop Loss if the price rise above 26550 after a false break - Take Profit at 25250 and 23850 respectively If a false break occur in the opposite direction (reversal to uptrend), this would be a great Long entry with a target to TP at 28k
Disclaimer
Any content and materials included in Sahmeto's website and official communication channels are a compilation of personal opinions and analyses and are not binding. They do not constitute any recommendation for buying, selling, entering or exiting the stock market and cryptocurrency market. Also, all news and analyses included in the website and channels are merely republished information from official and unofficial domestic and foreign sources, and it is obvious that users of the said content are responsible for following up and ensuring the authenticity and accuracy of the materials. Therefore, while disclaiming responsibility, it is declared that the responsibility for any decision-making, action, and potential profit and loss in the capital market and cryptocurrency market lies with the trader.