
Captain-MM8
@t_Captain-MM8

What symbols does the trader recommend buying?
Purchase History
پیام های تریدر
Filter
Signal Type
Captain-MM8
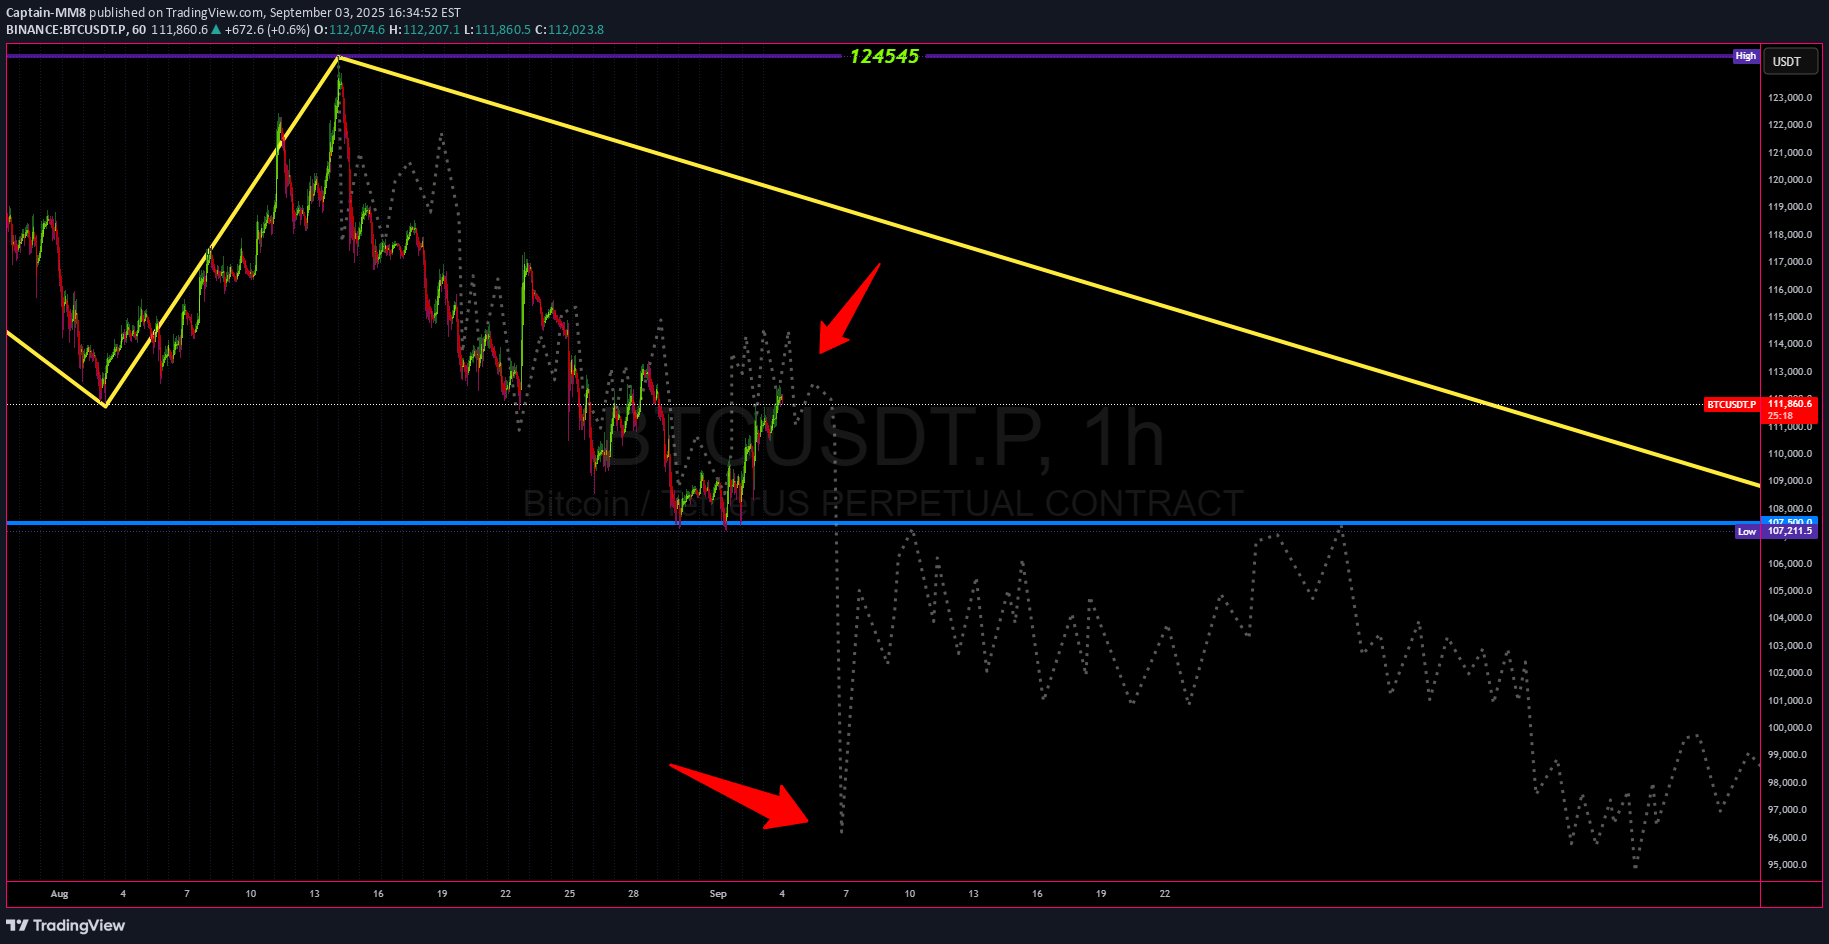
In my previous post , I explained how Bitcoin is astonishingly repeating the exact same behavior from four years ago. To analyze this more precisely, I cloned the previous Bitcoin cycle and overlaid it on the current price action. The result was striking: So far, Bitcoin has been moving almost step by step in alignment with that past pattern. 🔹 In the chart, the dotted lines represent the market behavior from the previous cycle. Interestingly, over the past few months, Bitcoin has been following the exact same path. 🔹 If this repetition continues as it has so far, the pattern suggests that within the next couple of days we could see a sharp decline of $10K–$15K in Bitcoin’s price. ⚠️ This is a serious warning: If history repeats itself, Bitcoin could be facing a major crash in the coming days. And if this sharp drop occurs, it could very well trigger the second historical correction down to the $65K–$70K zone. In my view, this is one of the most critical turning points of the current Bitcoin cycle, and traders should approach the market with maximum caution and precision.
Captain-MM8

🧠 Comprehensive Bitcoin Analysis in 4-Hour Timeframe📅 Date: May 30, 2025✍️ Analyst: MahaamBitcoin is currently at a critical juncture. As of May 29, 2025, it is trading around 105,543 USD, approximately 5.7% lower than its recent peak of 111,970 USD on May 22. The daily trading volume is around 32.47 billion USD, and Bitcoin's market capitalization has reached 2.16 trillion USD.📊 Technical Analysis:📈 Price Trend and Moving Averages:The Bitcoin chart indicates that after a strong rally starting in late April 2025, the market is now undergoing a price correction. The 20-day moving average is currently around 108,017 USD, and the 50-day moving average is around 97,500 USD. The current price remains above both moving averages, indicating a sustained medium-term bullish trend, though the growing distance from the 20-day MA may reflect weakening upward momentum.📉 RSI (Relative Strength Index):The RSI is currently at 53, signaling an exit from the overbought zone. It has dropped from levels above 70 in early May, showing increased selling pressure. However, it remains in a neutral range, with no indication of entering the oversold zone (below 30).📉 MACD (Moving Average Convergence Divergence):The MACD is currently declining and has crossed below the signal line, indicating a short-term sell signal. The MACD histogram is also turning negative, suggesting a decrease in upward momentum and rising short-term selling pressure.⚖️ Long/Short Ratio:Data from CoinGlass shows the BTCUSDT long/short ratio on Binance has reached its highest level since the beginning of the month. Currently, 6 out of 10 accounts hold long positions. This imbalance could lead to a long squeeze, forcing traders to close long positions and increasing selling pressure.📊 Volume:Trading volume has decreased in recent days, indicating reduced buyer interest at current price levels. In the past 24 hours, approximately 650 million USD in long positions across the crypto market have been liquidated, with nearly one-third of that related to Bitcoin.📍 Key Resistance Levels:• 109,300 USD (recent daily high)• 111,970 USD (all-time high)📍 Key Support Levels:• 106,000 USD (Fib 23.6%)• 103,460 USD (Fib 38.2%)• 100,000 USD (key psychological level)🧠 Fundamental Analysis:🏦 Institutional Buying and Corporate Investment:One of the most significant recent developments is the announcement from Trump Media and Technology Group about raising 2.5 billion USD to invest in Bitcoin. Approximately 50 institutional investors participated, allocating 1.5 billion USD for common stock purchases and 1 billion USD for convertible bonds. This move aims to create a Bitcoin reserve for the company and could signal increasing institutional adoption.📅 Bitcoin 2025 Conference:Held from May 27 to 29 in Las Vegas, the conference featured key figures such as Michael Saylor and U.S. Vice President JD Vance. Prominent analyst Miles Deutscher pointed out a pattern where Bitcoin's price tends to decline after each Bitcoin Conference. Based on historical data, the average post-conference drop is about 27%, which, if repeated, could push the price below 80,000 USD.🔮 Price Forecasts by Leading Analysts:📌 Adam Back (CEO, Blockstream): At least several hundred thousand USD in 2025, potentially up to 1 million USD if the U.S. implements a strategic Bitcoin reserve.📌 Geoff Kendrick (Global Head of Digital Assets, Standard Chartered): 120,000 USD in H1 2025, 200,000 USD by year-end, citing stablecoins legitimizing the crypto market.📌 Mike Novogratz (Founder, Galaxy Digital): Between 130,000 and 150,000 USD, driven by strong institutional inflows, a weakening dollar, and rising demand for digital assets.📌 Cathie Wood (CEO, ARK Invest): 1.5 million USD by 2030, requiring a 58% CAGR over the next five years.📌 Arthur Hayes (Founder, BitMEX): 250,000 USD by the end of 2025 if the Fed returns to quantitative easing.🌐 Monetary Policy and Macroeconomic Context:Trade tensions and tariff uncertainties continue to influence investor sentiment. A U.S. appellate court recently reinstated trade tariffs, while the government is appealing the previous decision that overturned them. Additionally, the self-imposed deadline for trade agreements is approaching on July 9.🧭 Potential Scenarios:🚀 Bullish Scenario:If Bitcoin breaks the 109,300 USD resistance and holds above it, there is a possibility of retesting the all-time high at 111,970 USD. A breakout beyond that could pave the way toward the 120,000 to 130,000 USD range.🔹 Supporting Factors:• Continued institutional and corporate investments in Bitcoin• Return of expansionary monetary policies by the Fed• Greater adoption and utility of stablecoins📉 Bearish Scenario:If selling pressure continues and price drops below the 106,000 USD support level, further declines toward 103,000 USD and 100,000 USD are possible. If the psychological support at 100,000 USD fails, the next target could be around 90,000 USD.🔻 Driving Factors:• Long squeeze due to high long/short ratio• Historical pattern of post-conference price drops• Increasing trade tensions and macroeconomic uncertainty✅ Conclusion:Bitcoin is at a critical decision point. Technical indicators suggest weakening bullish momentum and short-term correction risks. The long/short imbalance and historical patterns add to the possibility of a notable pullback.Nevertheless, strong fundamentals like growing institutional and corporate adoption (especially the Trump Media announcement) support a positive mid-to-long-term outlook. Leading analysts’ forecasts remain largely bullish, with price targets between 130,000 and 250,000 USD by year-end 2025.In summary, Bitcoin may face short-term selling pressure, but the mid- and long-term perspective remains optimistic. Investors should monitor key support and resistance levels and adjust their strategies based on market reactions.📚 Sources:The Crypto BasicCoinDeskCointelegraphFX EmpireBitcoin.com NewsReutersCoinGlass
Captain-MM8

Historical Pattern Repetition and Projection for BitcoinWhile reviewing Bitcoin’s weekly Heikin-Ashi chart, I overlaid the full 2020-2021 move (strong rally → sharp correction → recovery) on the current cycle. The two structures line up almost candle-for-candle.Key observations:1. The historical fractal projected a target zone around 112,000 USDT. Bitcoin has now reached that price area and, just like in 2021, is showing the first signs of a pullback.2. If the fractal continues to play out, the market could print a higher swing high after the current correction, before entering a deeper mid-cycle drawdown.3. Major support to watch sits near 92 k – 95 k (previous weekly highs) and, lower, around 72 k where the higher-low structure would break.4. Fundamental drivers are different this time: ETF inflows, the 2024 halving, and macro liquidity conditions. These may stretch or compress the timing, so the pattern is a road-map, not a guarantee.5. Risk management is essential. I am treating 92 k as the first invalidation level; a weekly close below it would neutralize the bullish fractal and force a reassessment.6. As always, past performance does not assure future results. Use this analysis as one data point among many, keep stops in place, and size positions responsibly.I will keep updating this thread as new weekly candles confirm or negate the setup. Feel free to share your own charts and let’s compare notes.Good luck and trade safe!
Captain-MM8

Looking closely at Bitcoin’s weekly chart, a fascinating pattern emerges that could hint at the cryptocurrency’s next major move.📌 Historical Pattern Similarity:Bitcoin’s recent price behavior closely mirrors the significant cycle observed in 2021-2022. Both patterns involve a sharp and rapid upward rally, hitting a new all-time high, followed by a dramatic and sharp correction.📌 Cycle Consistency:These movements align remarkably well with Bitcoin’s historical market cycles, typically driven by halving events every 3-4 years, resulting in explosive price actions followed by deep corrections.📌 Market Psychology Match:This scenario perfectly illustrates classic market psychology—from euphoria at the peak to panic in the subsequent crash. Given current market sentiment, such a scenario remains plausible.🔸 However, Exercise Caution:Historical Repetition Not Guaranteed:Although history often rhymes, it rarely repeats exactly. Today’s global economic landscape, increased institutional involvement, and regulatory changes could influence outcomes differently this time around.Liquidity and Market Size:Bitcoin's larger market cap and deeper liquidity might limit the severity of corrections compared to previous cycles, potentially leading to less dramatic percentage declines.Beyond Technical Analysis:While technical patterns are compelling, integrating fundamental analysis and macroeconomic factors (interest rates, inflation, geopolitical stability) is crucial for a robust forecast.🎯 Conclusion & Outlook:Technically speaking, the scenario of an imminent, sharp rally followed by a significant correction is highly plausible. Traders should remain vigilant, combining technical setups with fundamental insights.👉 Stay Alert, Trade Smart! 📈📉Would love to hear your thoughts—drop your comments below! 🔥
Captain-MM8

In this chart, the Bitcoin to Tether (BTC/USDT) pair is depicted with a prominent purple arc illustrating the price trajectory over a specific timeframe. The apex of this arc is positioned at the $100,000 level, signifying a significant psychological and technical resistance point.The price movement within this arc reflects the ongoing equilibrium and contention between buyers and sellers. Initially, the price ascends gently beneath the arc, reaching towards the $100,000 mark, before experiencing a decline. Currently, the price oscillates near the lower boundary of the arc, indicating a reaction to this level.Observing trading volumes at various segments of the chart is crucial. Notably, as the price approaches the arc's peak or trough, there is a discernible increase in volume, suggesting intensified efforts by traders to breach or uphold these levels. A successful breakout above the $100,000 arc apex could signal a robust upward movement, while failure to surpass this threshold may result in continued fluctuations within the arc or a potential downward trend.Overall, this arc serves as a valuable analytical tool, aiding traders in identifying key support and resistance zones and providing a clearer understanding of potential price directions. A meticulous analysis of this pattern can assist in uncovering compelling trading opportunities within the market.
Captain-MM8

I strongly emphasize and warn you to pay attention to Elon Musk's tweet 3 years agoOf the 9 numbers he wrote three years ago, 5 of them happened exactly and now the price of Bitcoin is reaching the 6th number.According to the number 75 in this tweet and the next number 65, it means that the highest price of Bitcoin will be 75,000 dollars and after that there will be a sharp drop and the price of Bitcoin will start to fall again.Be careful that greed for high profits does not destroy your capital
Captain-MM8

This was the sharp price drop that I said last weekAnd I said that you should be very carefulThis drop was so severe that Bitcoin dropped to $59,000 and at the time of writing this post, the price had risen to $63,000Considering the recent price growth, this event will definitely cause a global shock, and many people will sell their bitcoins because they had bought and are now losing money for fear of losing more, which will cause the currency to grow again for a few days get into troubleAccording to Elon Musk's tweet three years ago, which I posted in several previous posts, Bitcoin should reach $75,000 and then drop, so there is still an opportunity to buy and profit.By buying at low prices, you can be on the lookout for price growth up to $75,000 and the highest final price of BitcoinI wish you the most profits
Captain-MM8

As I said in previous posts, Bitcoin went to the bottom of the channel and will reach its end, and in the next few days, after hitting the end of the channel, it will change its direction to the top of the channel, and the price of Bitcoin will start to grow again.In my opinion, the price of Bitcoin will not go below $50,000 because this number is a very strong resistance, but the prices between $50,000 and $50,500 will be good prices to buy Bitcoinif the price of Bitcoin rises in the next few days, We have bought the lowest prices
Captain-MM8

According to the previous post, this image, which shows the Bitcoin chart from the last 15 months, shows one thing:Whenever bitcoin reaches a strong trend price, it either stops at that price for a while and then falls, or crosses it and returns to that price again, because that price is extremely strong resistance.And now it has reached the price of $50,000 and this price is a very strong trend and it will probably have a heavy fall as in the past.Do not do long or short trades in this market because this price is the most sensitive price of Bitcoin and anything can happen at this price.I strongly advise, first of all, if there is a fall, do not make a short trade because at any moment Bitcoin may change its direction upwards, and also do not take a long trade if it rises, because a fall to the price of $45,000 is not out of mind.Be very careful with your investmentsThe person who is running this market has become rich with our money, so be careful, don't make him richer.Good luck
Disclaimer
Any content and materials included in Sahmeto's website and official communication channels are a compilation of personal opinions and analyses and are not binding. They do not constitute any recommendation for buying, selling, entering or exiting the stock market and cryptocurrency market. Also, all news and analyses included in the website and channels are merely republished information from official and unofficial domestic and foreign sources, and it is obvious that users of the said content are responsible for following up and ensuring the authenticity and accuracy of the materials. Therefore, while disclaiming responsibility, it is declared that the responsibility for any decision-making, action, and potential profit and loss in the capital market and cryptocurrency market lies with the trader.