
Candydreamz
@t_Candydreamz

What symbols does the trader recommend buying?
Purchase History
پیام های تریدر
Filter
BTC/USD 1H Chart Analysis
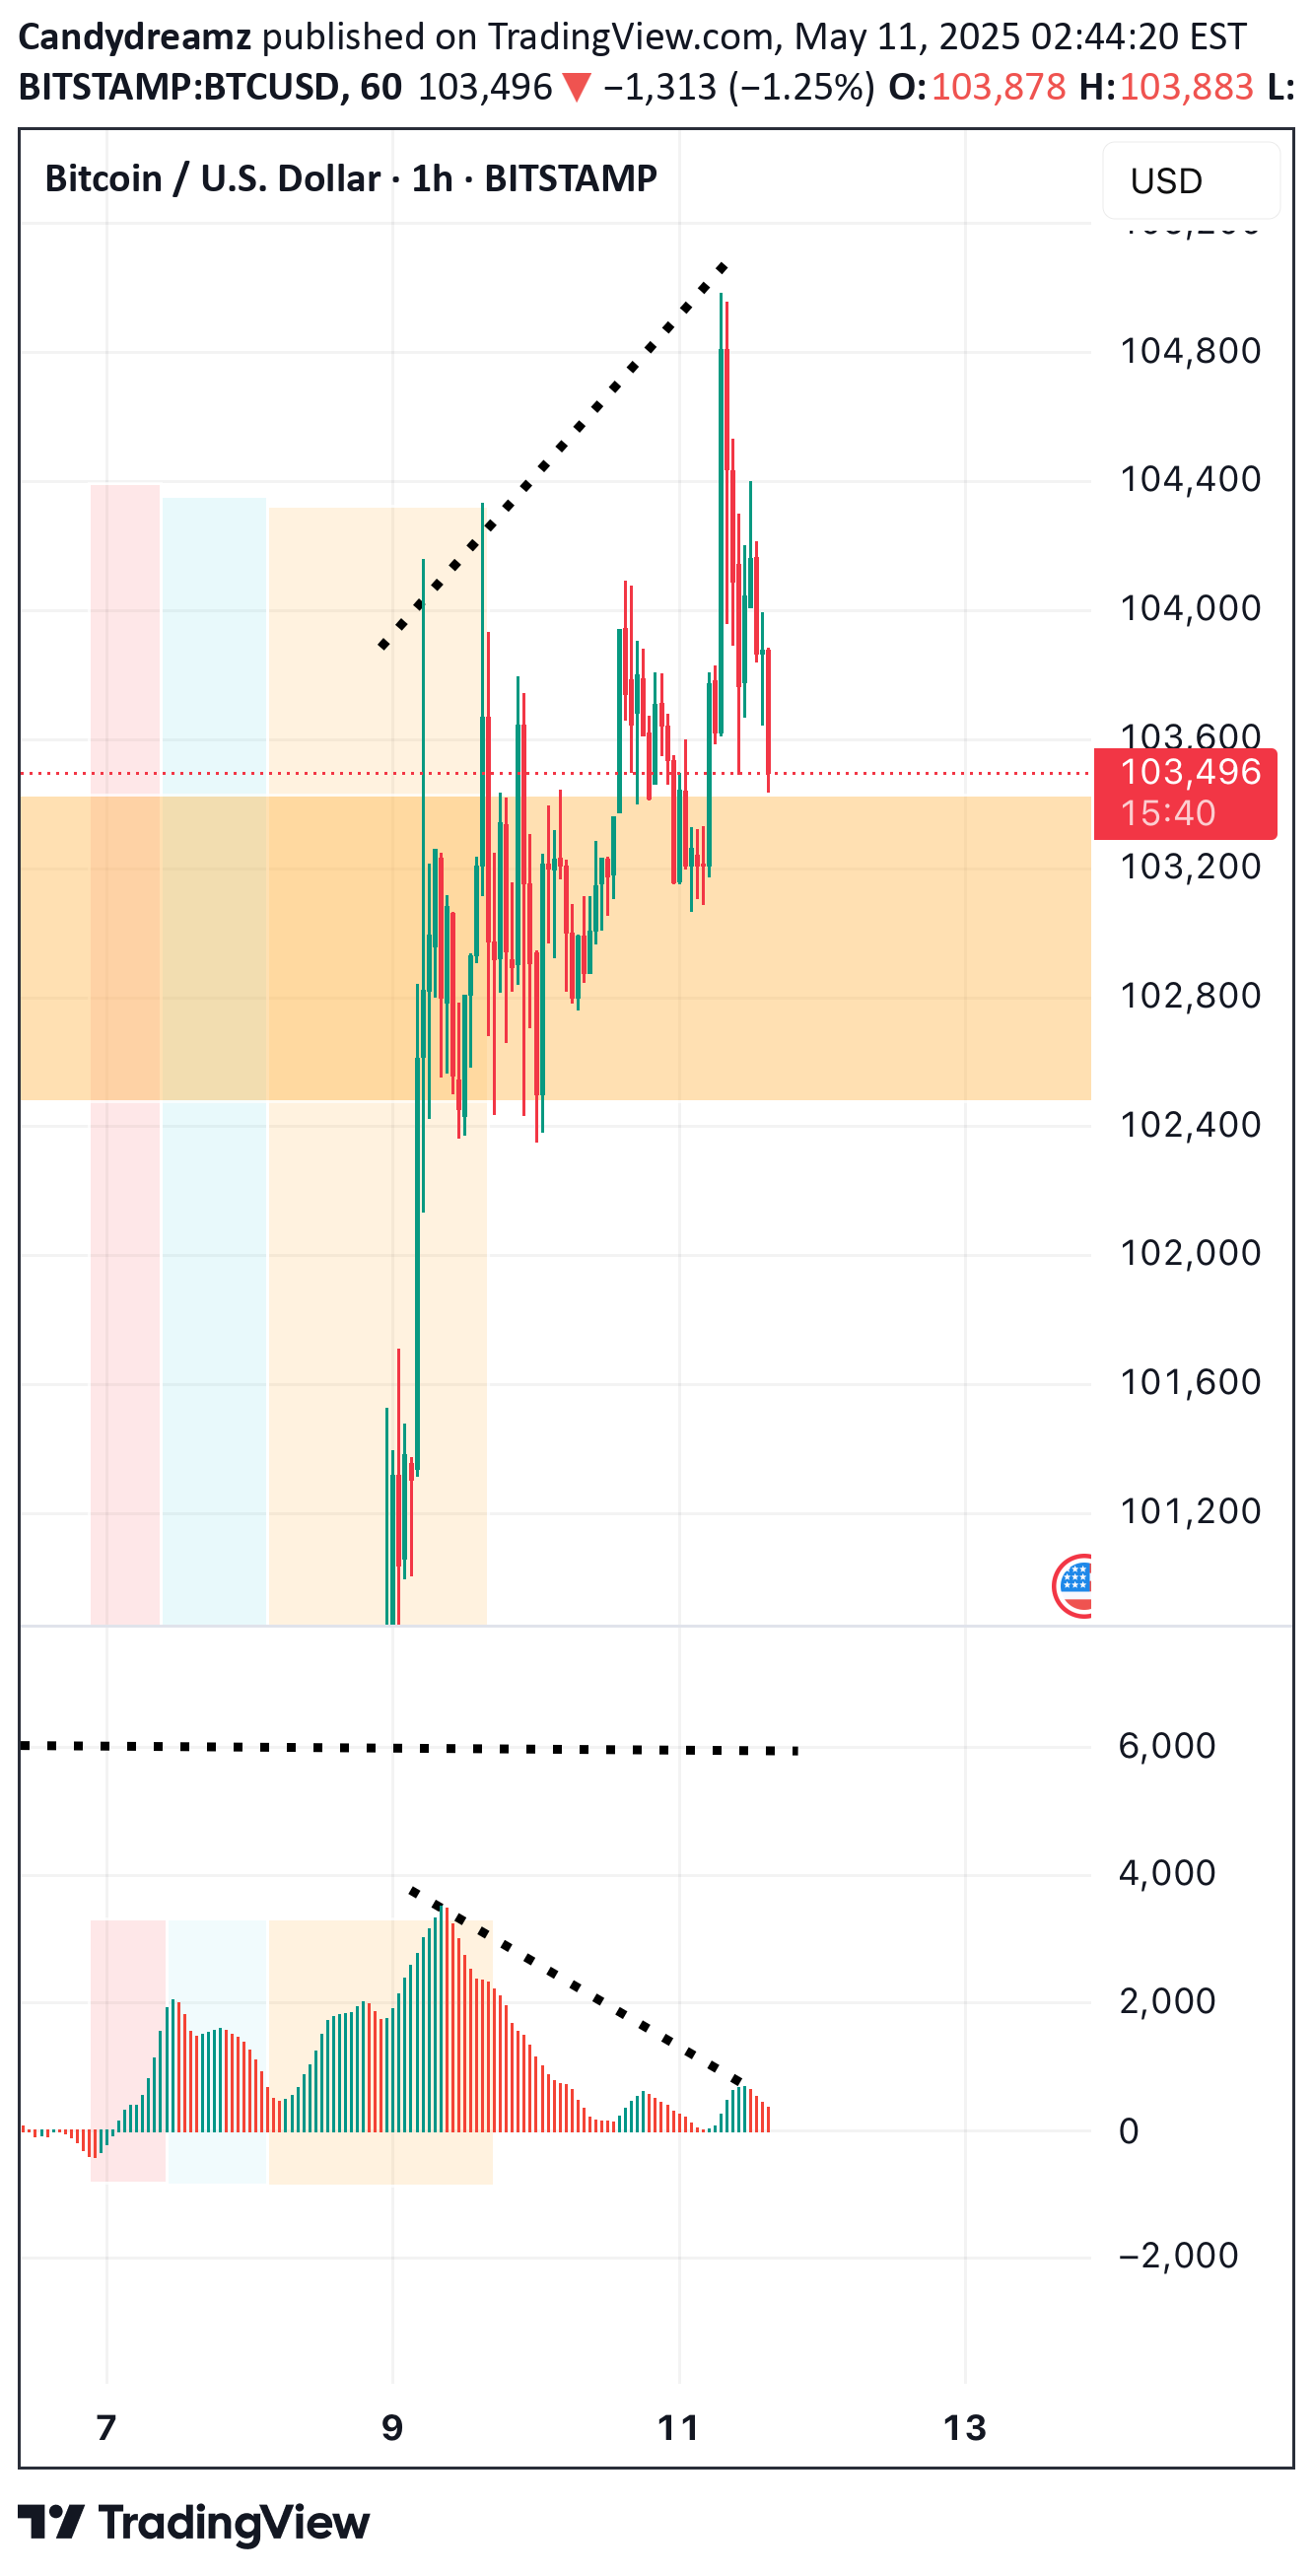
Price recently formed a higher high (Peak 5) compared to a previous high (Peak 3), but the MACD histogram shows a lower high during the same period. This is a clear bearish divergence, signaling weakening bullish momentum.Following the divergence, price has started to pull back and is now hovering around the support zone near $103,000. If this support fails to hold, BTC may continue to correct lower.Key Levels to Watch:•Support: $103,000•Resistance: $104,000 – $104,500•Bias: Bearish in the short term due to divergence and rejection at the recent high.Traders should wait for confirmation—a break below support could open room for further downside.
Gold (XAUUSD) Elliott Wave + AO Analysis (1H Chart) – 10 May 20

Overview:This 1-hour chart on XAUUSD highlights a clear 5-wave Elliott impulse, confirmed with Fibonacci extensions and the Awesome Oscillator (AO). Current structure suggests Wave (5) is in play, offering a high-probability short opportunity from the Wave (4) retracement zone.🧠 Elliott Wave Count:Wave (1): Initial bearish legWave (2): Minor corrective pullbackWave (3): Strong impulse confirmed by AO convergenceWave (4): Corrective structure that respects the top of Wave (1) — valid Elliott structureWave (5): Now in progress, supported by AO divergence → momentum weakening📌 Note: Wave 1 and Wave 3 are commonly measured using AO convergence, validating the strength of the impulse waves. Conversely, Wave 5 is often identified by AO divergence, signaling trend exhaustion.📐 Fibonacci Extension Targets (Measured from Wave 4):Expected zone for Wave (5) termination:1.618 Fib: $3,312.172.618 Fib: $3,280.25 (most common)4.236 Fib: $3,255.054.886 Fib: $3,241.30 (extreme extension)📉 Wave (5) often terminates at 2.618 or 4.236 Fibonacci levels, especially when supported by AO divergence.📊 AO (Awesome Oscillator) Insights:✅ Wave (1) to (3): Clear convergence validates impulse🚨 Wave (5): AO showing divergence = weakening sell momentumConfirms Wave (5) status and end-stage trend behavior🛠️ 🔴 Short-Only Strategy: Trade Wave (5) From Wave (4)Entry Criteria:Short initiated near the Wave (4) zone (~$3,330–$3,347)Strong rejection candle (e.g., engulfing, pin bar) or breakdown confirmationAO turning from green to red or histogram weakeningStop Loss:Above Wave (4) high = ~$3,347Take Profit Levels:🎯 TP1: $3,312 (1.618 Fib)🎯 TP2: $3,280 (2.618 Fib)🎯 TP3: $3,255 (4.236 Fib)🎯 TP4 (optional final target): $3,241 (4.886 Fib)Risk Management Tip: Adjust position sizing to align with stop above Wave (4) and TP zones at Fib targets.🧩 Final Thoughts:✅ High-probability bearish structure from Wave (4)🚫 No bullish setups considered — focus is only on shorting Wave (5)🔍 AO confirms both impulse strength and trend exhaustion via convergence/divergence📐 Fibs align with standard Wave (5) projections📈 Chart Context:Gold (XAUUSD) – 1H timeframeIndicators: Elliott Wave, AO, FibonacciAnalysis Date: 10 May 2025Bias: Bearish only
Gold (XAU/USD) – Liquidity Grab Before a Potential Drop?

📉 Bearish Setup DevelopingGold is currently trading around $2,905, consolidating near a key liquidity zone. Based on smart money concepts (SMC), we can anticipate a potential move before a larger bearish reaction.🔎 Analysis:✅ Liquidity Grab: If price breaks above the current range, it will likely trigger buy-side liquidity, fueling a short-term rally.✅ Supply Zone Rejection: The supply zone near $2,950-$2,960 could act as a strong resistance, where institutional selling may occur.✅ Potential Drop: A strong bearish candle from the supply zone could signal a reversal, targeting the $2,880 - $2,850 range.📊 Trading Plan:🔹 Entry: Wait for a rejection or bearish engulfing candle at the supply zone.🔹 Stop-Loss: Above the supply zone (~$2,965).🔹 Take-Profit: First target at $2,880, extended target at $2,850.🔹 Confirmation: A lower timeframe shift in structure (e.g., M15 or H1) can increase confidence in the trade.💡 Key Tip: Be patient and wait for confirmation—trading against a strong bullish trend without proper signals can be risky!What do you think? Will Gold reverse from the supply zone, or are the bulls still in control? Drop your thoughts in the comments! 👇
Disclaimer
Any content and materials included in Sahmeto's website and official communication channels are a compilation of personal opinions and analyses and are not binding. They do not constitute any recommendation for buying, selling, entering or exiting the stock market and cryptocurrency market. Also, all news and analyses included in the website and channels are merely republished information from official and unofficial domestic and foreign sources, and it is obvious that users of the said content are responsible for following up and ensuring the authenticity and accuracy of the materials. Therefore, while disclaiming responsibility, it is declared that the responsibility for any decision-making, action, and potential profit and loss in the capital market and cryptocurrency market lies with the trader.