Can_EasyMoney_TR
@t_Can_EasyMoney_TR
What symbols does the trader recommend buying?
Purchase History
پیام های تریدر
Filter
Signal Type

Can_EasyMoney_TR

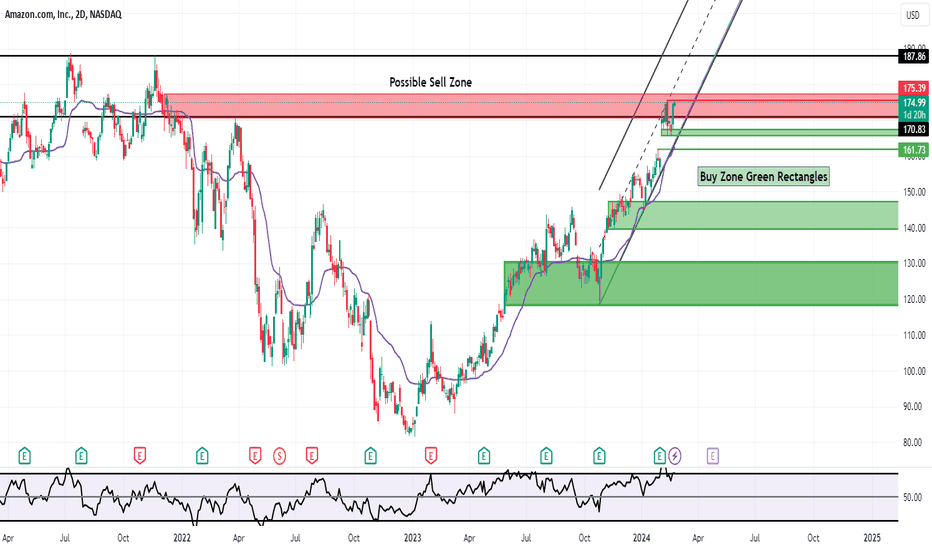
Amazon's chart indicates that the region marked in red may function as a selling-oriented order block. If there is a 2-day closing above the red horizontal line, the next target could be 187.86, following the channel. In our buying zones, the horizontal line at the price of 161.73 may present a buying opportunity. 2-day closings below the green horizontal line may sequentially act as buying zones from light to dark. In the 2-day chart, levels 161.73 and Kaufman Moving Average at 162.34 are considered as significant support zones. WARNING: THIS ANALYSIS IS NOT INVESTMENT ADVICE. CONSIDER YOUR RISK TOLERANCE AND FINANCIAL SITUATION BEFORE MAKING DECISIONS. FUTURE PERFORMANCE IS NOT GUARANTEED; THIS IS MERELY AN OPINION. INVEST PRUDENTLY AND CONDUCT THOROUGH RESEARCH.

Can_EasyMoney_TR

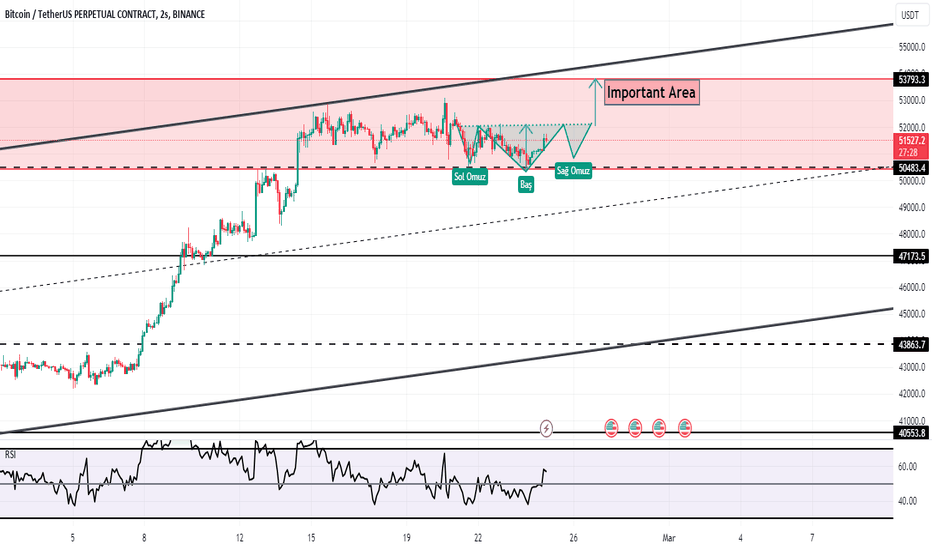
BTC/USDT Technical Analysis - Head-Shoulders Formation and Channels - February 24, 2024 Shoulder-Head-Shoulders Formation: According to the current chart analysis, BTC/USDT pair shows a head-and-shoulders (OBO) formation on the hourly chart. This formation may indicate a potential trend change. Importance of Channels: When we examine the chart on an hourly period, we can observe rising and falling channels. Channels are important tools that limit price movements and provide clues about the direction of the trend. Paying attention to these channels can help identify possible support and resistance levels. Limitations of the Analysis: However, as with any technical analysis, it is not possible to obtain definitive results. Chart analysis shows possible scenarios, but market conditions may change. Therefore, it is important to carefully evaluate the likelihood of formations occurring and the durability of the channels. Risk Management and Trading Strategy: When creating a trading strategy, it is important to consider risk management and determine stop-loss levels. Paying attention to the support and resistance levels indicated on the chart and keeping the position size under control is the basis of a successful trading strategy. Conclusion and Warning: As a result, the head-and-shoulders formation and channels on the BTC/USDT chart can be important indicators for traders. However, you should conduct your own research and carefully consider market conditions before every trading decision. WARNING: THIS ANALYSIS IS NOT INVESTMENT ADVICE. TOTALLY MY OWN OPINIONS. YOU SHOULD CONSIDER YOUR OWN RISK TOLERANCE AND FINANCIAL SITUATION WHEN MAKING YOUR INVESTMENT DECISIONS.

Can_EasyMoney_TR

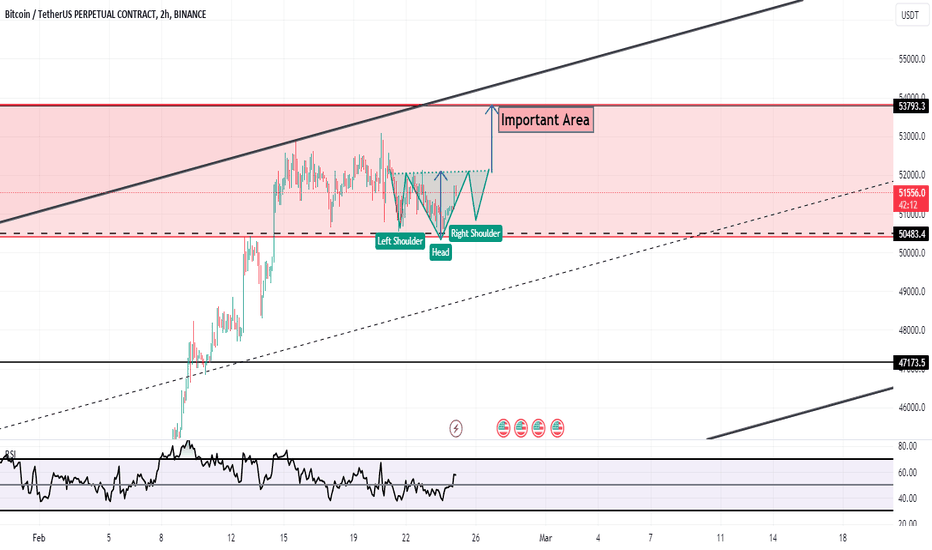
BTC/USDT Technical Analysis - Head and Shoulders Formation and Channels - February 24, 2024 1. Head and Shoulders Formation : According to the current chart analysis, the BTC/USDT pair displays a head and shoulders (H&S) formation on the hourly chart. This formation may signal a potential change in trend. 2. Importance of Channels: Upon examining the chart on an hourly timeframe, we can observe both ascending and descending channels. Channels are significant tools that limit price movements and provide clues about the direction of the trend. Paying attention to these channels can assist in identifying potential support and resistance levels. 3. Limitations of the Analysis: However, as with any technical analysis, obtaining precise results is not guaranteed. Chart analysis illustrates possible scenarios, but market conditions can change. Therefore, it is crucial to carefully evaluate the probability of the formation's realization and the durability of the channels. 4. Risk Management and Trading Strategy: When forming a trading strategy, considering risk management and determining stop-loss levels are crucial. Paying attention to the support and resistance levels indicated on the chart, controlling position size, are fundamental to a successful trading strategy. 5. Conclusion and Warning: In conclusion, the head and shoulders formation and channels on the BTC/USDT chart can be significant indicators for investors. However, before making any trading decisions, it is essential to conduct your own research and carefully evaluate market conditions. 6. WARNING: THIS ANALYSIS IS NOT INVESTMENT ADVICE. IT IS SOLELY MY OWN OPINIONS. WHEN MAKING INVESTMENT DECISIONS, YOU SHOULD CONSIDER YOUR OWN RISK TOLERANCE AND FINANCIAL SITUATION.
Disclaimer
Any content and materials included in Sahmeto's website and official communication channels are a compilation of personal opinions and analyses and are not binding. They do not constitute any recommendation for buying, selling, entering or exiting the stock market and cryptocurrency market. Also, all news and analyses included in the website and channels are merely republished information from official and unofficial domestic and foreign sources, and it is obvious that users of the said content are responsible for following up and ensuring the authenticity and accuracy of the materials. Therefore, while disclaiming responsibility, it is declared that the responsibility for any decision-making, action, and potential profit and loss in the capital market and cryptocurrency market lies with the trader.