Technical analysis by Can_EasyMoney_TR about Symbol AMZNX on 2/25/2024

Can_EasyMoney_TR
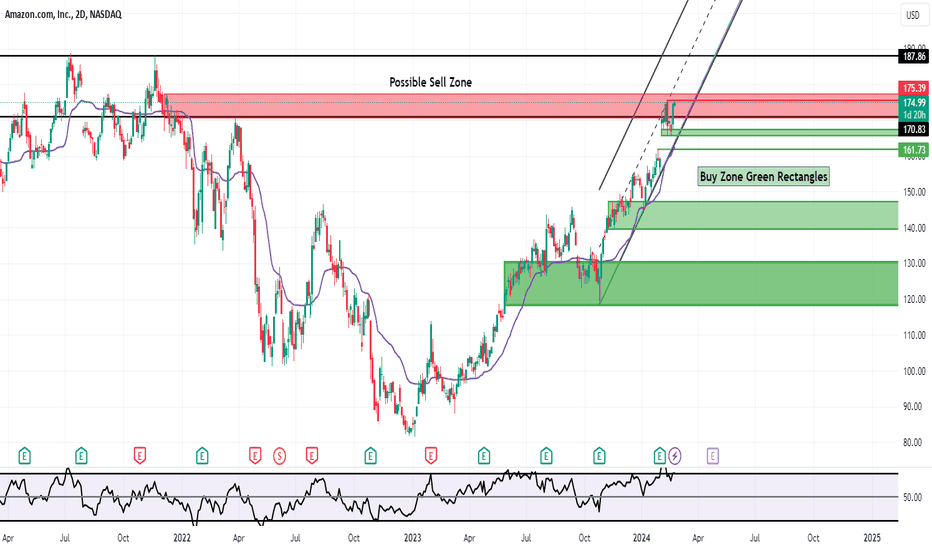
Amazon's chart indicates that the region marked in red may function as a selling-oriented order block. If there is a 2-day closing above the red horizontal line, the next target could be 187.86, following the channel. In our buying zones, the horizontal line at the price of 161.73 may present a buying opportunity. 2-day closings below the green horizontal line may sequentially act as buying zones from light to dark. In the 2-day chart, levels 161.73 and Kaufman Moving Average at 162.34 are considered as significant support zones. WARNING: THIS ANALYSIS IS NOT INVESTMENT ADVICE. CONSIDER YOUR RISK TOLERANCE AND FINANCIAL SITUATION BEFORE MAKING DECISIONS. FUTURE PERFORMANCE IS NOT GUARANTEED; THIS IS MERELY AN OPINION. INVEST PRUDENTLY AND CONDUCT THOROUGH RESEARCH.
