
CRYPTO_HUUNTER
@t_CRYPTO_HUUNTER

What symbols does the trader recommend buying?
Purchase History
پیام های تریدر
Filter
CRYPTO_HUUNTER
ترس، دیدگاه شما را کور نکند: تحلیل بازار فراتر از نگرانیها
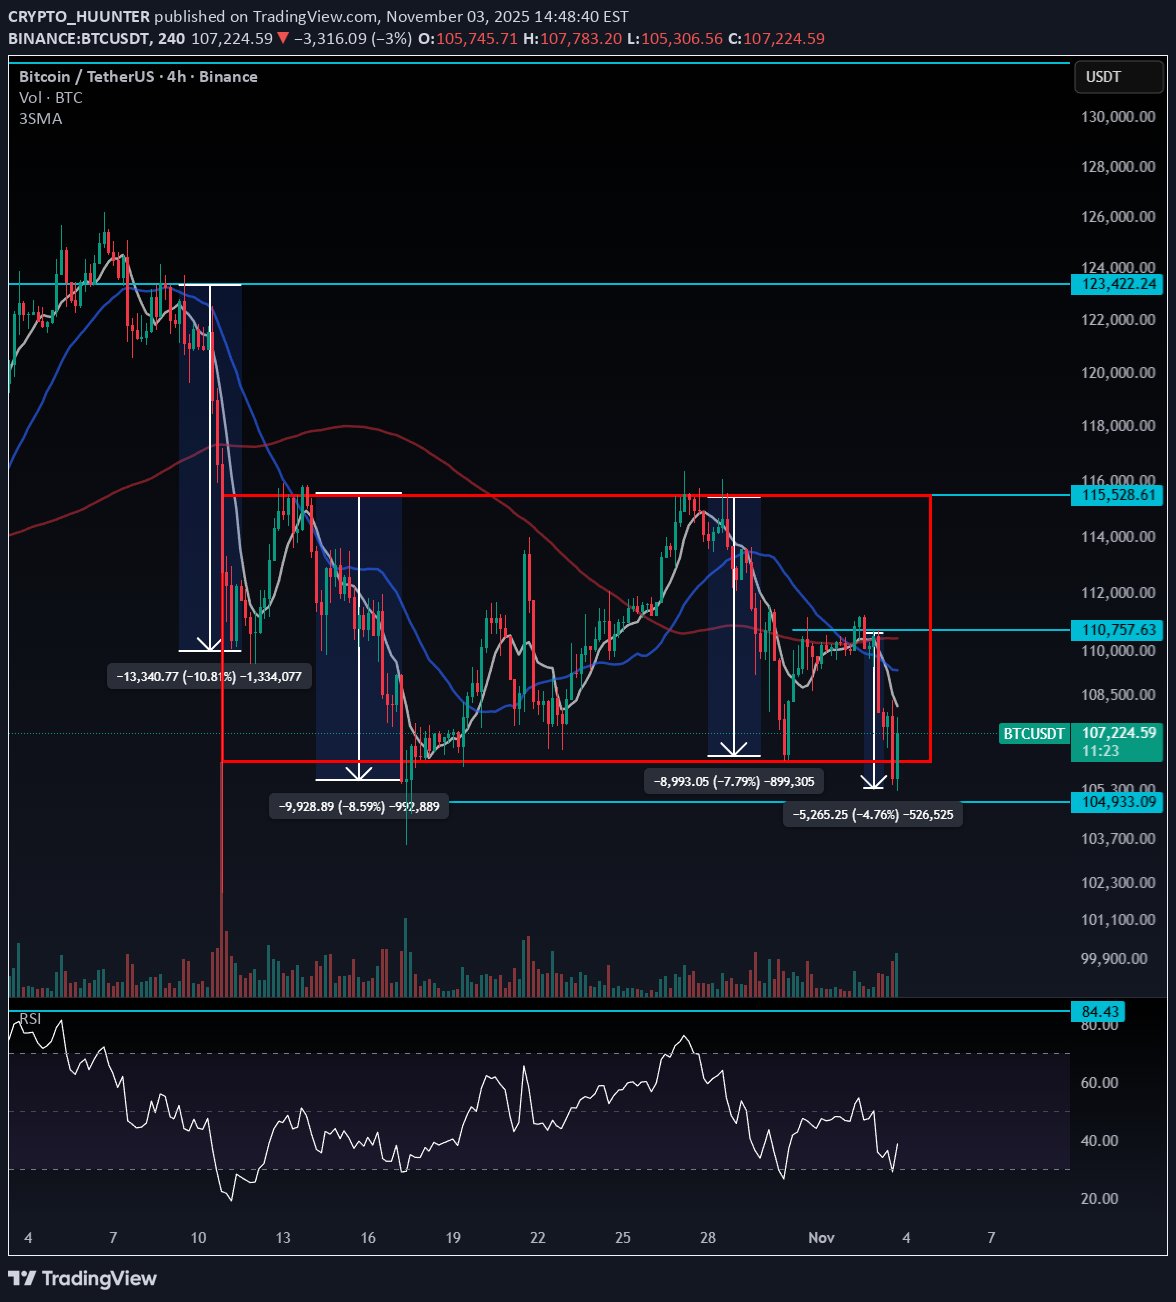
The market largely depends on your perspective — if you’re scared, everything will look bearish and you may assume it’s all over. But based on the chart, I don’t see a confirmed bearish reversal yet. Look closely at the downside movements: Each sell-off has been smaller than the previous one → indicating decreasing bearish momentum We’ve been trading inside a red supply box, and price rejected from the middle of this zone, pulling back Logically, that increases the expectation of a downside breakout — but when price fails to break down, it often signals that market structure may shift upward instead Now zoom out to the daily chart: Notice how the lower wicks are increasing — buyers stepping in aggressively on each dip Selling volume continues to decline Look at the last red 4H candle — it was strong but failed to continue the move down, and price immediately printed a green candle right after If the market truly had strong bearish pressure, we would’ve seen continuation — not a quick recovery. I’m not ignoring bearish possibilities, but you need to stay open to both sides. If the market flips bullish from here, you must be ready to react quickly — not stuck in fear.
CRYPTO_HUUNTER
تصمیم نرخ بهره فدرال رزرو: نوسان شدید در راه است؛ آماده معامله باشید!
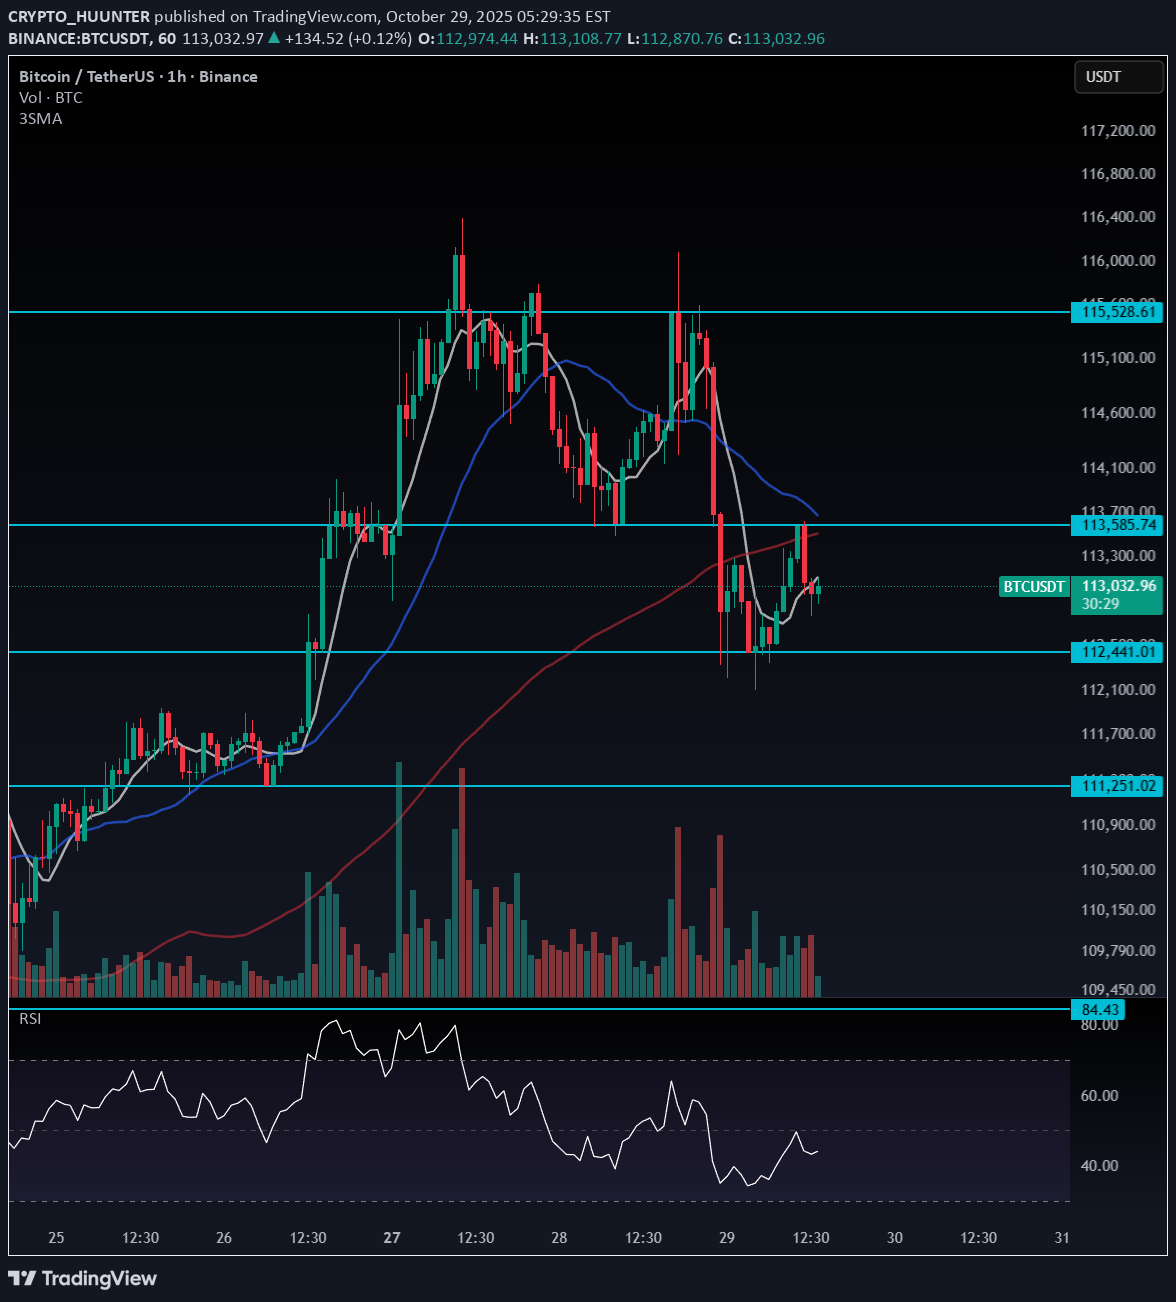
Today’s market volatility could increase significantly due to the interest rate announcement and the following press conference. My view: it’s worth taking a position today, but with limited risk exposure. The probability of getting stopped out is high — accept that risk and trade with caution. 📈 Long Setup: Entry Trigger: Break above $113,585 Stop-Loss: Wide stop — keep your position size small to manage risk If price fake-breaks below $112,441 and reverses upward, that’s another strong long signal 📉 Short Setup: Same logic applies in reverse: if $113,585 fails and $112,441 breaks cleanly downward, you can look for a short opportunity ⚖️ Pro Tip: If you know how to use hedge mode, this is a good time to apply it to balance risk on both sides.
CRYPTO_HUUNTER
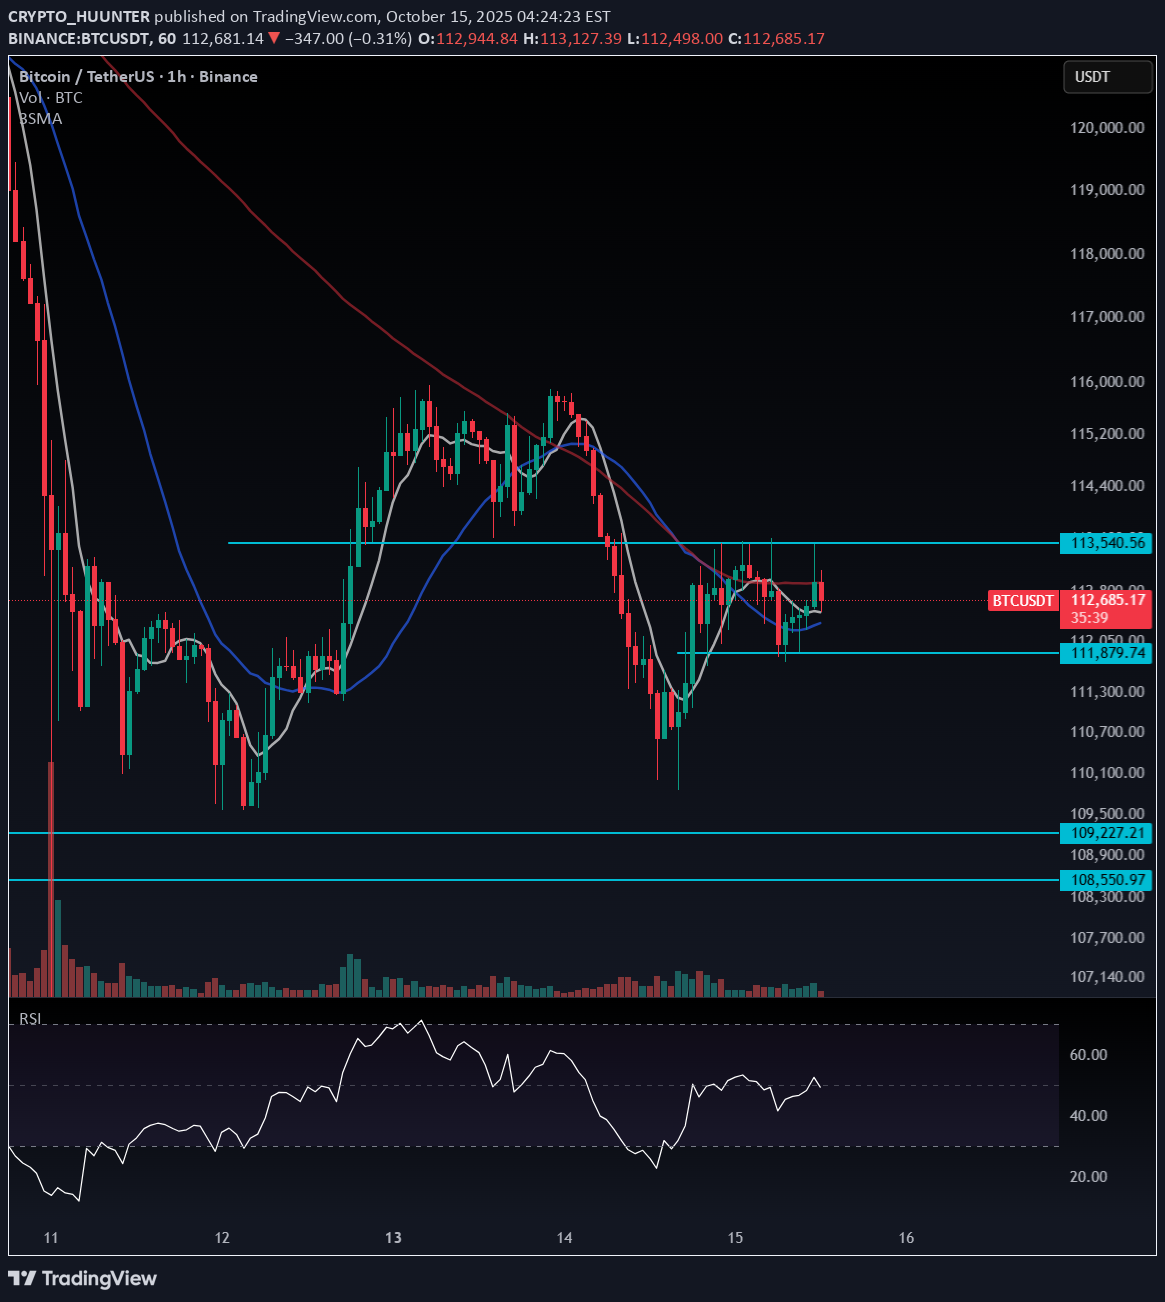
بیت کوین در دوراهی؛ منتظر نشانه صعودی یا سقوط زیر ۱۱۴ هزار دلار؟
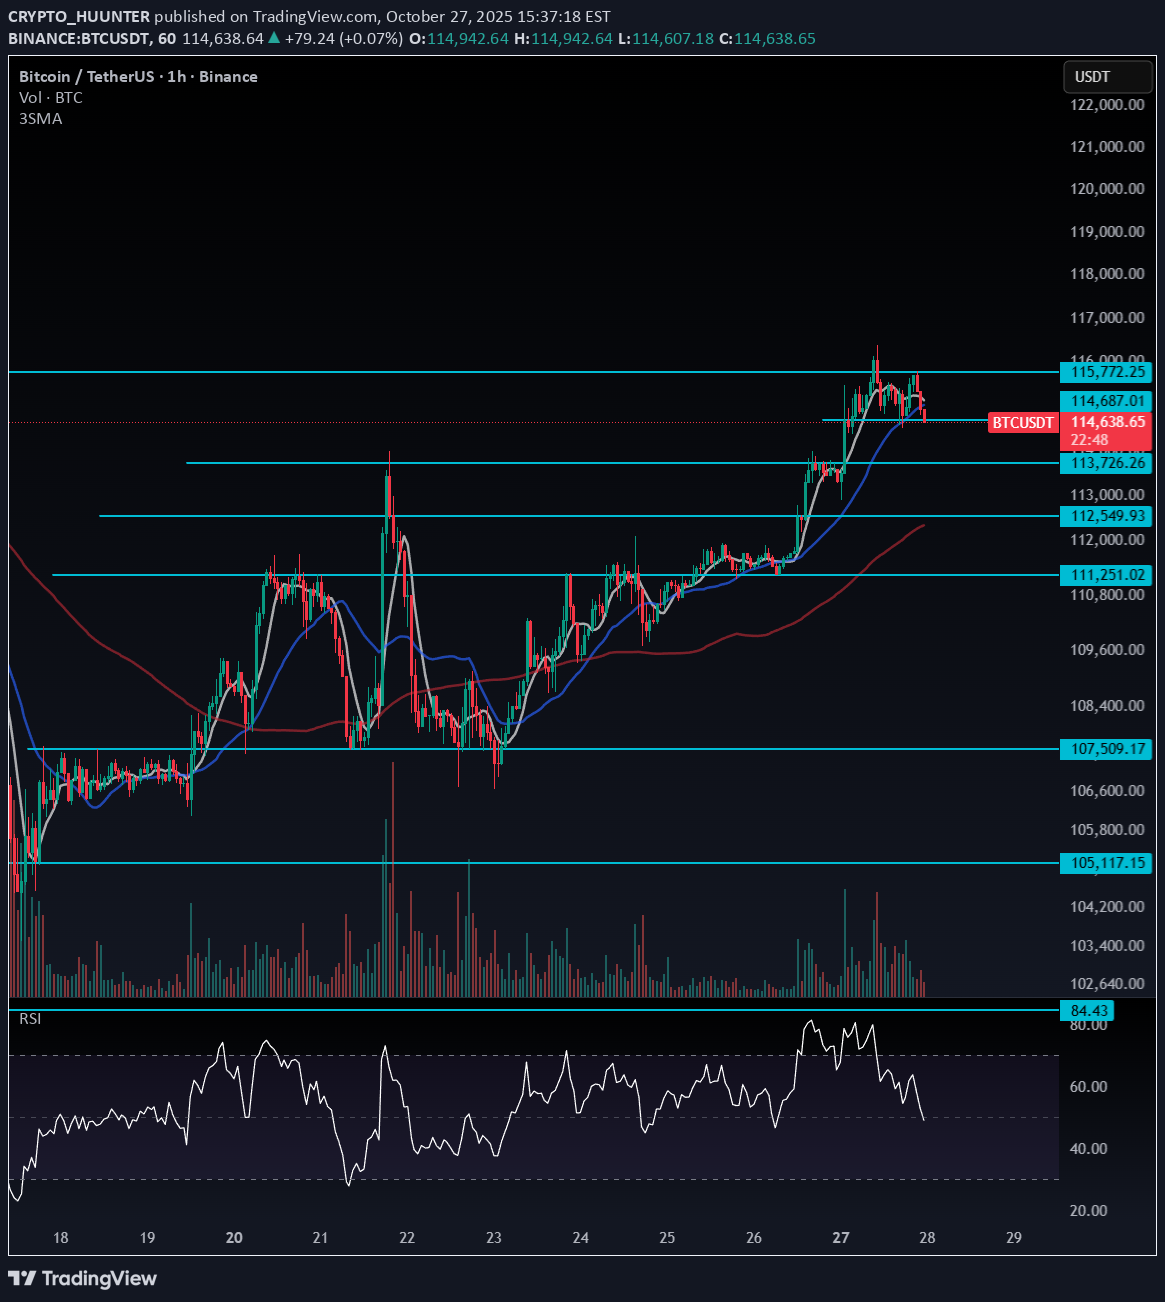
After the recent bearish trend ended, Bitcoin entered a phase of indecision, moving slightly upward with weak bullish momentum. However, it’s not yet in a confirmed uptrend — we still need to see a higher low to validate the start of a new bullish structure. If price breaks below $114,687, Bitcoin could enter a minor corrective phase within this weak upward movement. 📉 Key Support Levels: $113,726 $112,549 $111,251 📈 Bullish Trigger: A breakout above $115,772 could be a potential entry point for a long position, signaling renewed buying strength. For now, stay patient and watch how price reacts near these levels before committing to new trades.
CRYPTO_HUUNTER
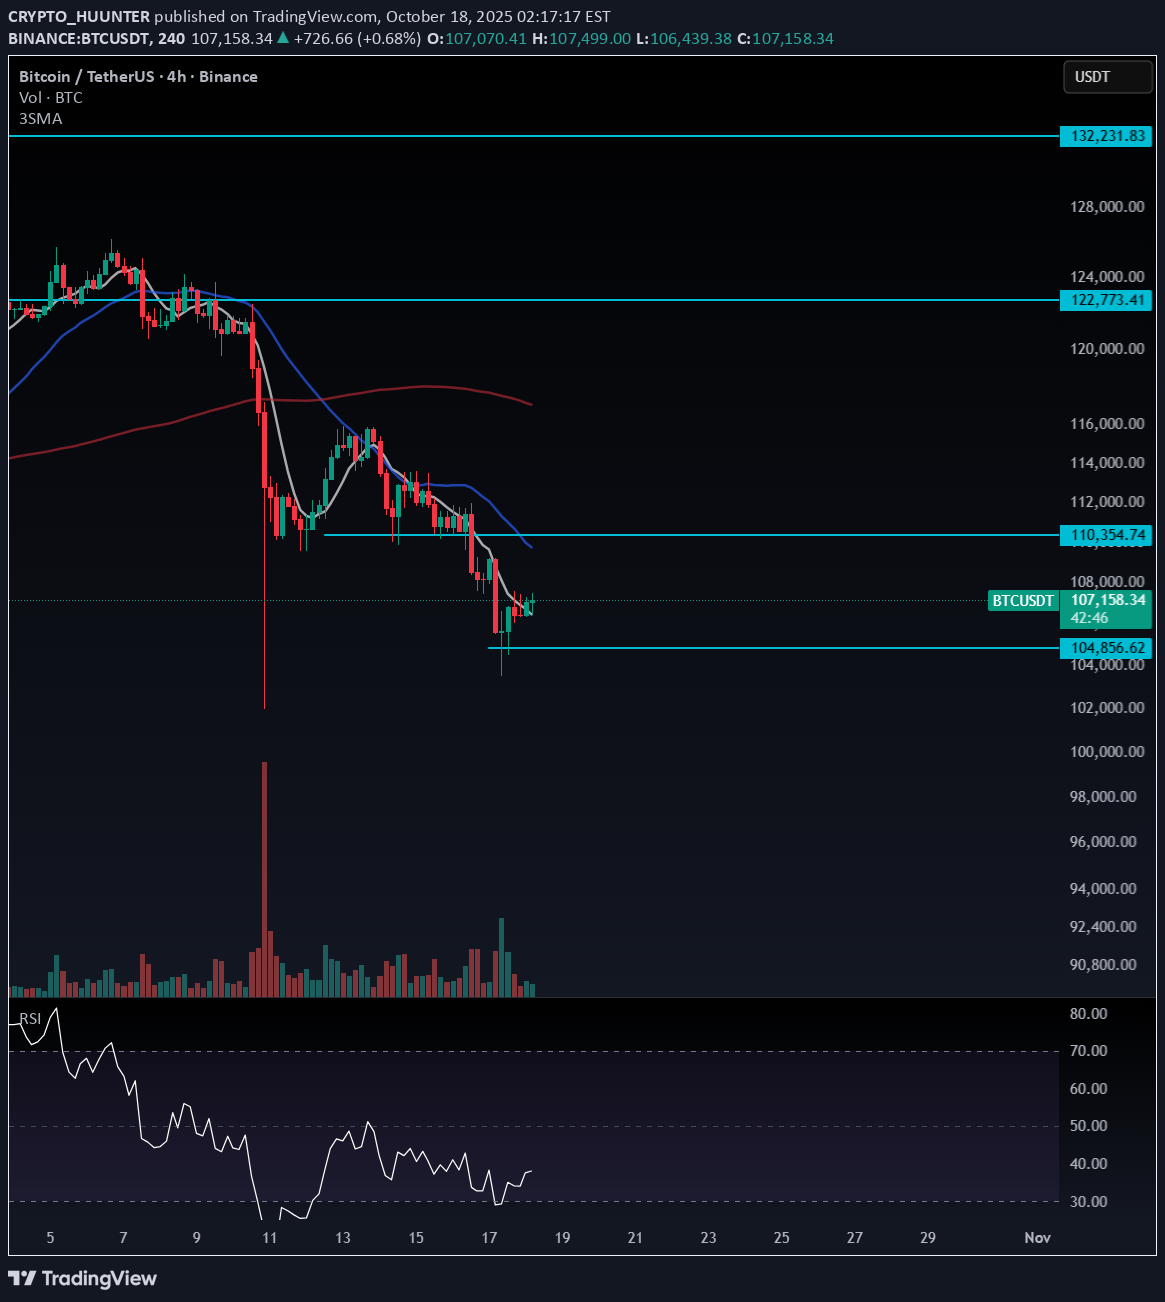
آیا بیت کوین از ریزش خسته شده است؟ سطوح کلیدی برای معاملهگران بیت کوین
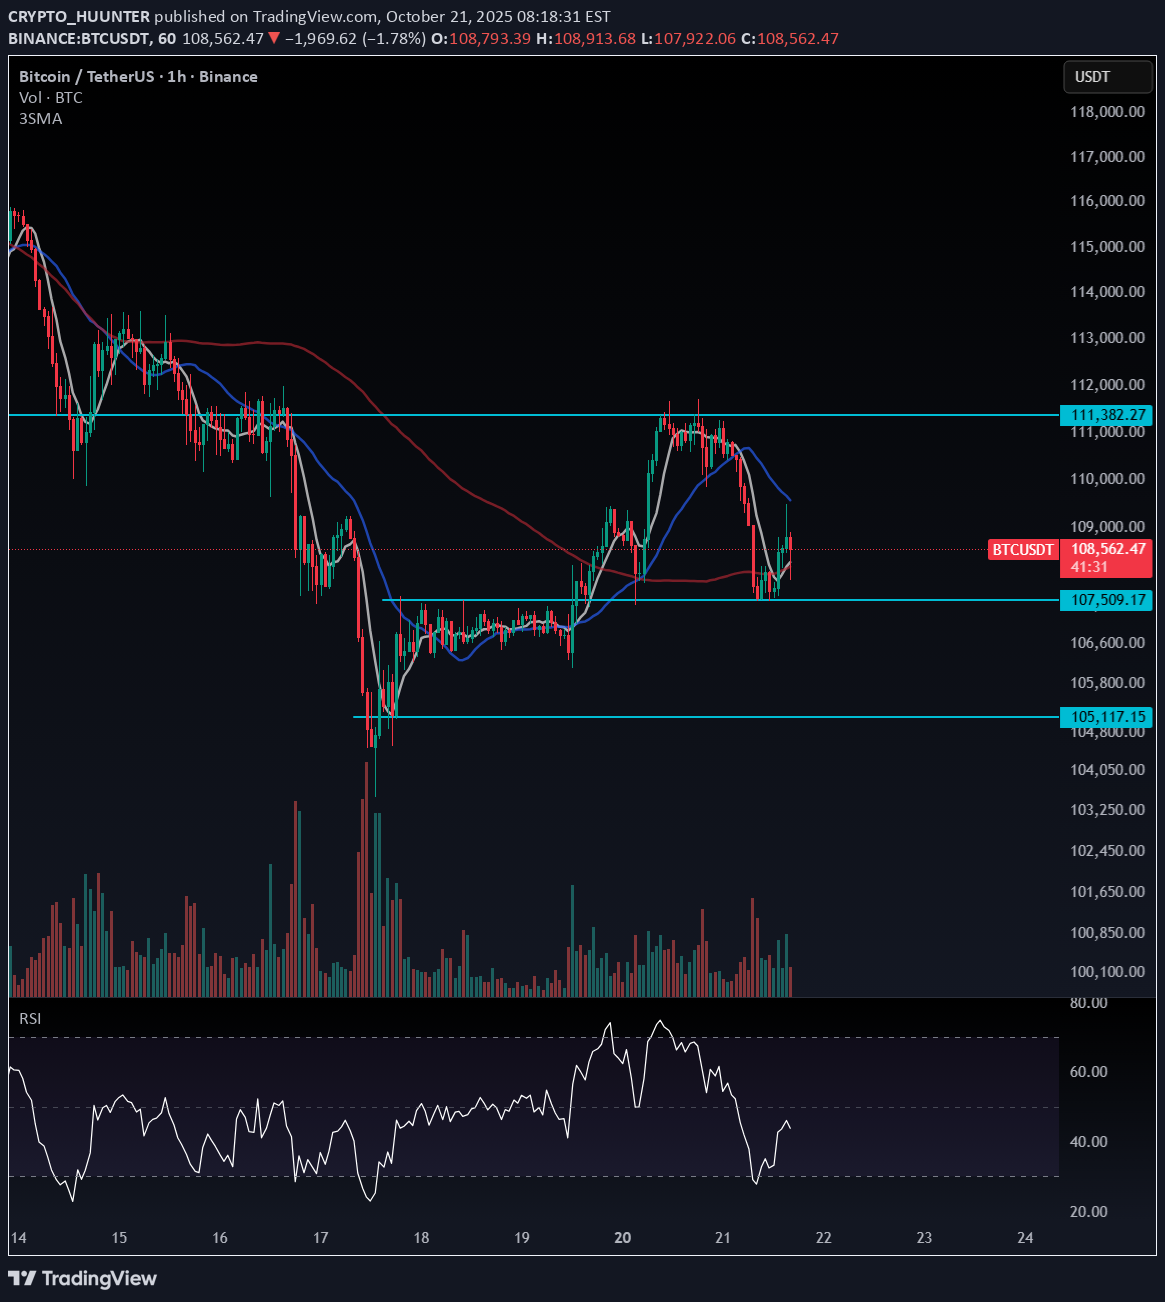
Bitcoin is currently showing signs of weakness in its bearish momentum, but there’s no confirmed reversal yet, so traders should remain cautious. You can consider opening: A short position on a break below $107,509 A long position on a break above $111,352 If you open a trade between these two levels, it’s better to take profits early, since the market could stay range-bound until a breakout occurs. Once one of these levels is decisively broken, you can hold your position with more confidence as it would likely signal directional continuation. A confirmed end of the downtrend would be validated if Bitcoin breaks above $111,382, or forms a higher low above $105,117 (or even a double bottom near that level). For now, stay patient and let price action confirm the shift before committing heavily.
CRYPTO_HUUNTER
بیت کوین در آستانه رنج زدن؟ محدوده ورود و استراتژی نجات سرمایه!
At the moment, Bitcoin’s chart shows no clear signs of bearish exhaustion. To confirm a potential trend correction, the price needs to push up to $110,354. If it climbs higher than that, we can assume the downtrend is likely over. Currently, there’s a possible short entry around $104,856, but my personal view is that Bitcoin may start ranging soon to build a new structure. For now, I’m staying patient and observing the market. If you already hold short positions, I recommend taking profits (partial or full) — that’s the safer play in this phase. However, if Bitcoin drops below $100,000, consider selling your spot holdings, even at a loss, to protect your capital. Remember: Capital preservation is more important than catching every move. Markets often consolidate before the next major leg — stay alert for new structure formation.
CRYPTO_HUUNTER
بیت کوین در نقطه حساس: آیا چرخش صعودی بزرگ در راه است؟
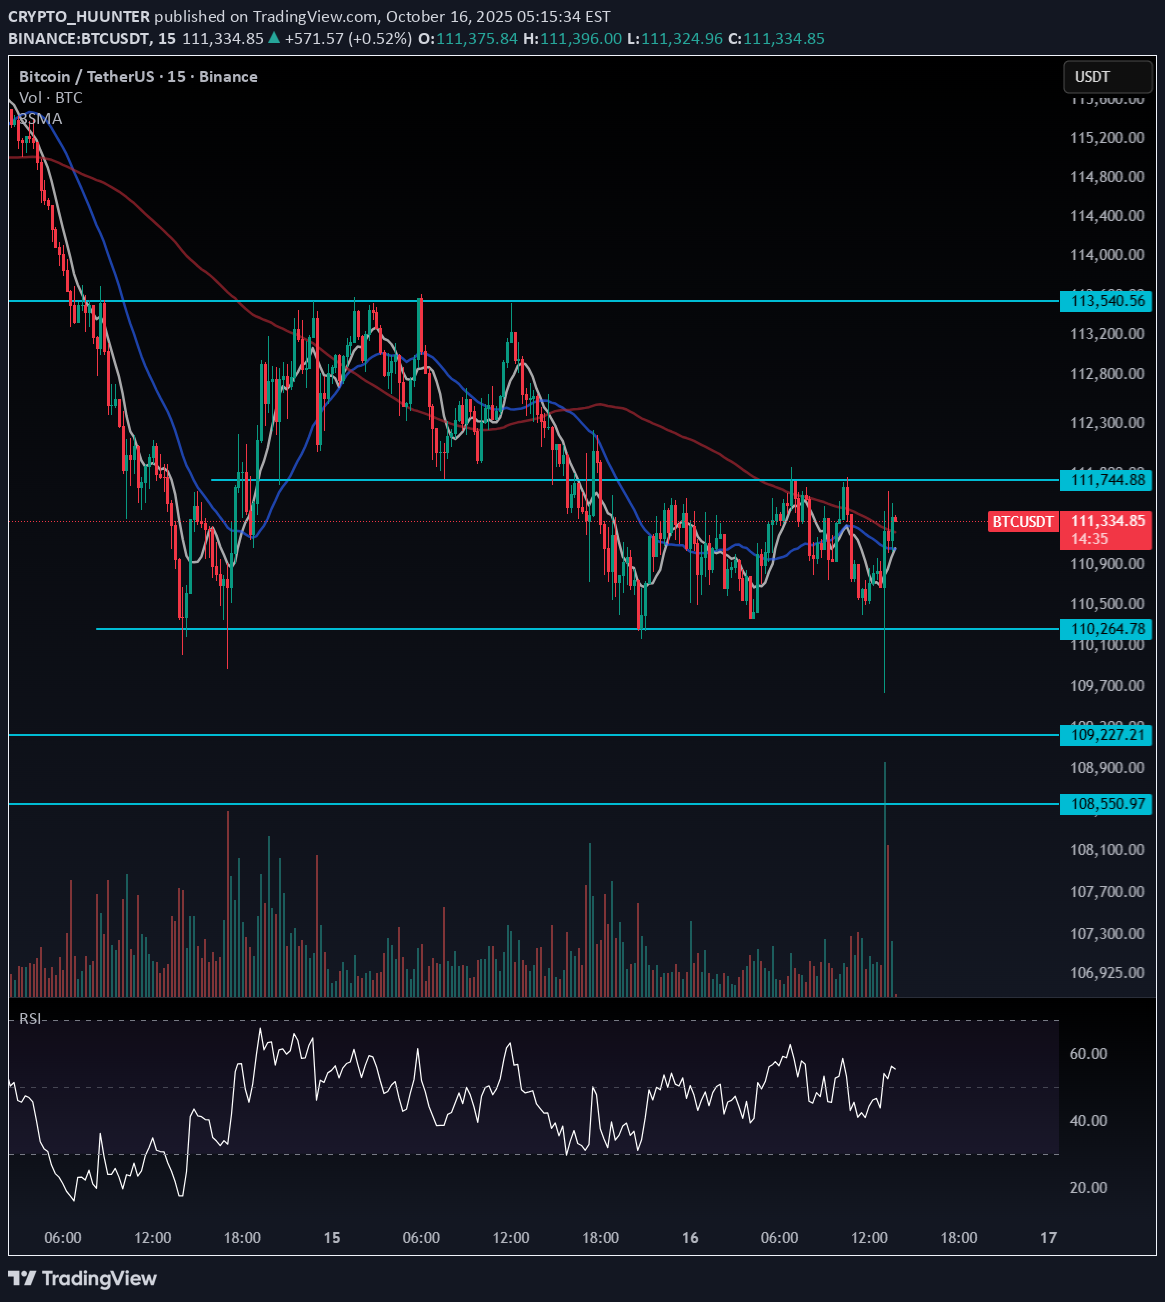
Bitcoin is currently testing a key support area, which can be seen through the downside wicks rejecting lower prices. After a fakeout to the downside, I’m planning to enter a long position above $111,744. However, keep in mind — this is a high-risk setup. If you prefer a safer entry, consider waiting for a break above $113,540 before entering your long position. There’s also a liquidity pocket around $113,807, which could trigger a strong upward move once it’s tapped. ⚠️ Risk management remains crucial — even bullish setups can fail in volatile conditions.
CRYPTO_HUUNTER
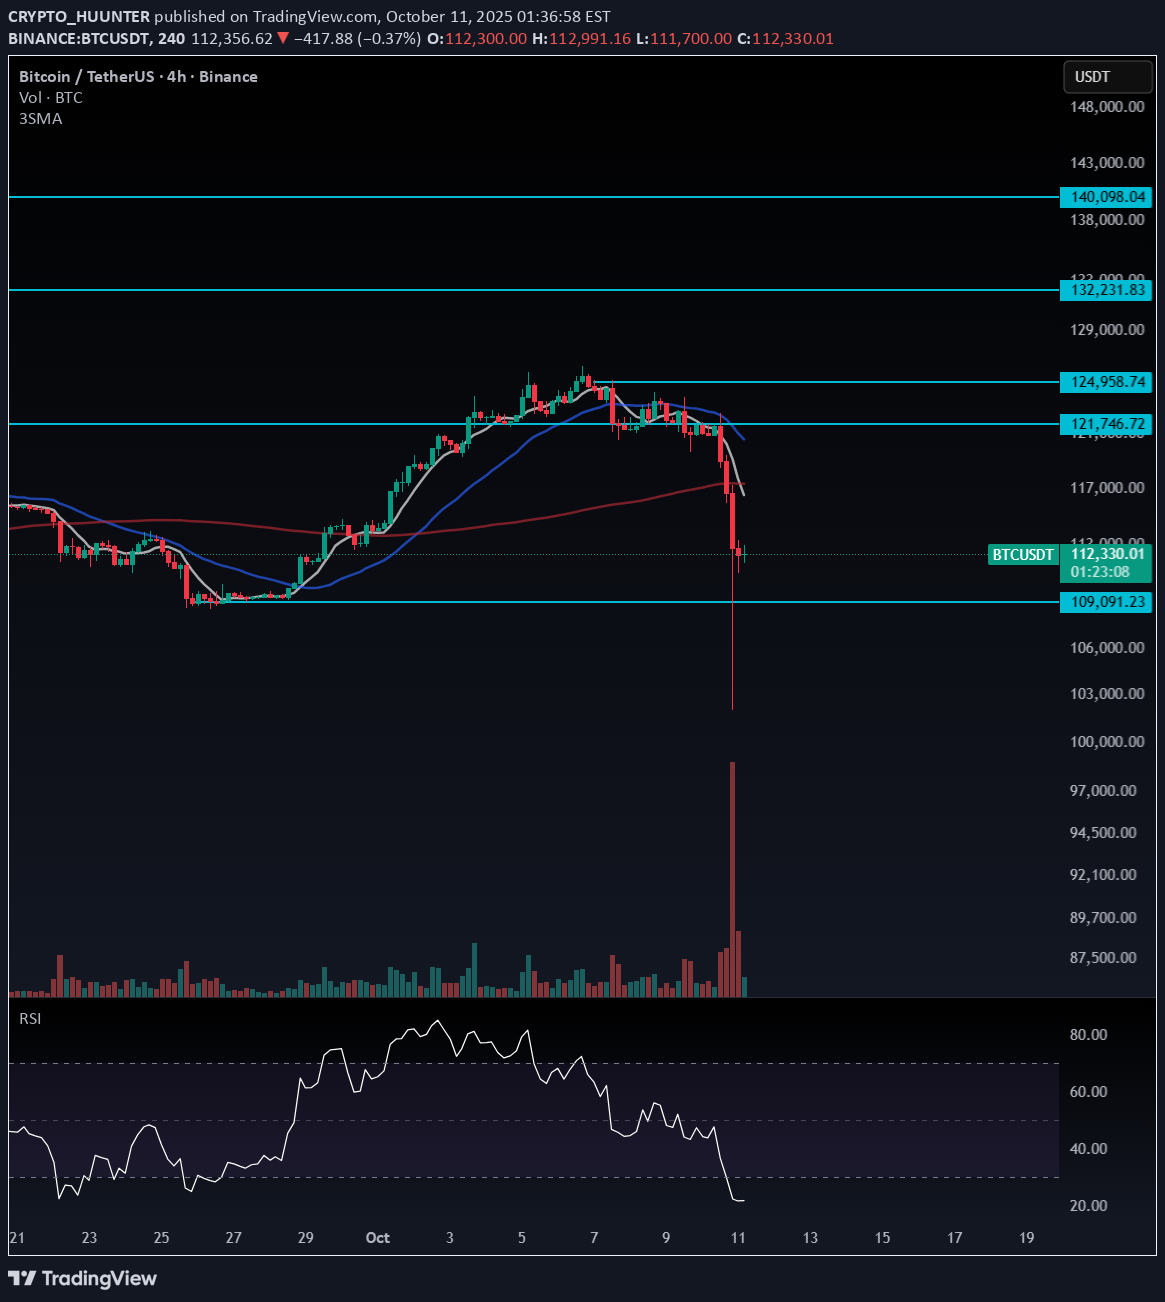
بیت کوین در آستانه انفجار قیمتی؟ نقدینگی کلیدی و خطر لیکویید شدن ۴۰۰ میلیون دلار!
With a break below the $113,726–$113,893 range, over $400 million in long positions could be liquidated. Additionally, a break of $111,548 could trigger another $252 million in liquidations. You can consider taking positions around these levels, but keep in mind — volatility is likely to spike sharply once these liquidity zones are tested. While Bitcoin did manage to bounce from $111,879 with increasing volume, I personally don’t like the structure of the recent candles. For now, I’m staying on the sidelines, avoiding both long and short entries until the market shows clearer direction. Sometimes, patience is also a position.If it makes a fake move down and then goes up, I’ll open a long position when it breaks 113,540
CRYPTO_HUUNTER
بیت کوین آماده پرواز: آیا فشار فروشندگان تمام شد؟
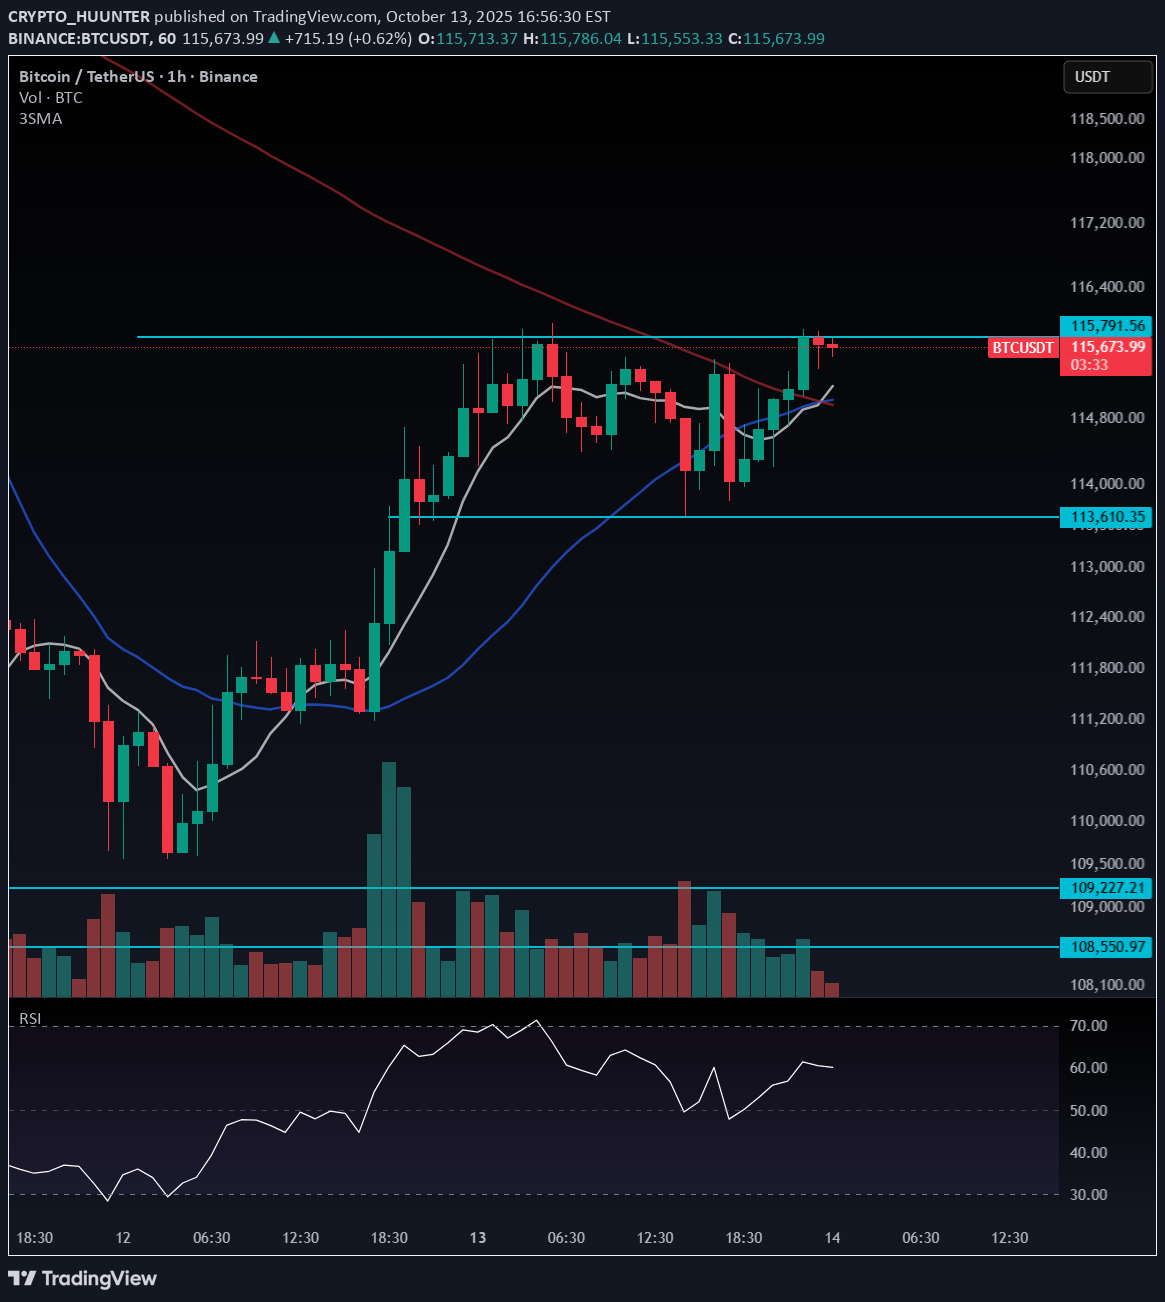
It seems Bitcoin has rested enough and might be gearing up for an upward move. Despite multiple attempts from sellers to push the price lower, they failed to gain control, which increases the probability of a bullish breakout. In the recent candles, we can clearly see that red candles are getting smaller, and volume is also decreasing — a strong indication that selling pressure is fading. This adds further confirmation for a potential upward continuation. Long trigger: $115,792 Short trigger (in case of a fake breakout): $113,610 Keep a close eye on Bitcoin Dominance (BTC.D). If dominance turns red while Bitcoin moves up, it’s a signal that altcoins could offer stronger long opportunities during this move. 💡 If you open a long position, I suggest holding it rather than taking early profits — there’s a chance we might see a strong bullish reaction soon.
CRYPTO_HUUNTER
مناطق حمایتی بیت کوین: آیا پایان سقوط نزدیک است؟
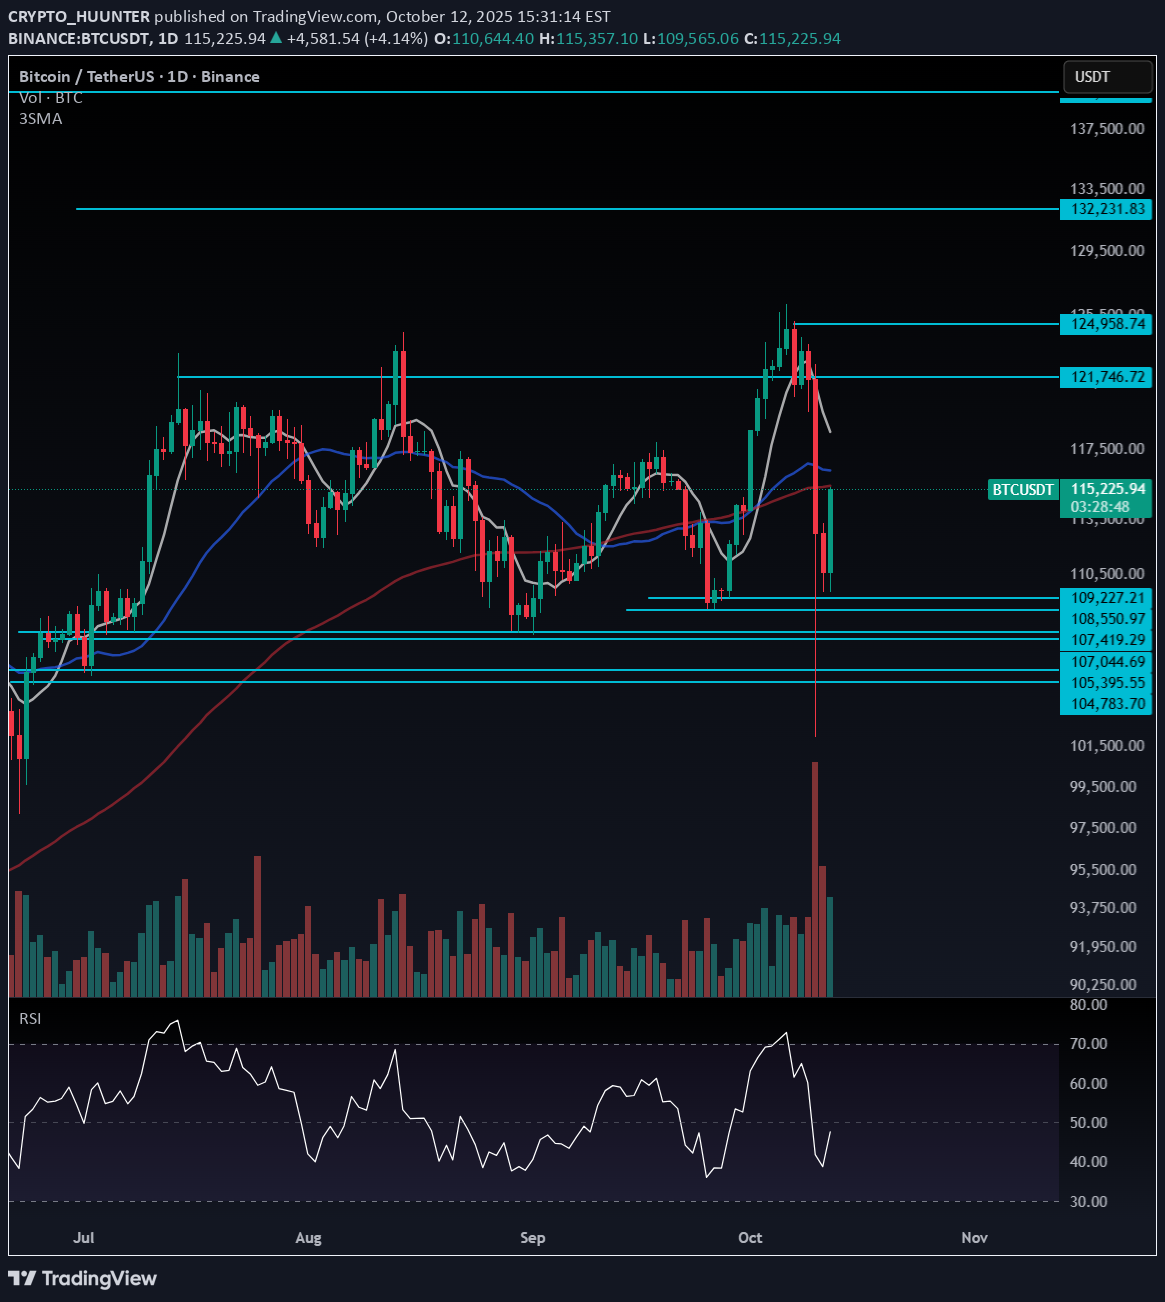
During the recent drop from $121,000, Bitcoin didn’t find any strong support levels to hold the price. As I’ve mentioned before, a healthy uptrend must include corrections — otherwise, when correction finally comes, it tends to be deep and aggressive. That said, there’s still room for further downside, but this time, we have several key support zones that won’t be easily broken: $108,551 – $109,227 $107,045 – $107,419 $104,783 – $105,395 The reason I’m highlighting these areas is to remind you that each of these zones could act as a potential reversal point, providing buyers with a chance to support the market. So, the situation is not hopeless — the market can still recover from these levels. If you decide to take a short position, make sure to take profit quickly, close your position, or at least set it to breakeven, since we’re approaching strong demand zones. As for long positions, I believe it’s still too early — I prefer to wait and see how Bitcoin builds its next price structure before entering. If Bitcoin dominance starts showing green candles, altcoins might perform better for short trades.
CRYPTO_HUUNTER
سقوط بازار دست ما نبود: چطور در بحران آرامش خود را حفظ کنیم؟
Sometimes, things happen that are completely out of our control — and the recent market crash was one of them. Everyone’s feeling the pain right now, but it’s important not to lose your composure. News events don’t define the market’s long-term trend; they only create temporary shocks. Think back to the COVID-19 crash — the market dropped sharply, consolidated for a while, and then began a massive bullish recovery. If you’ve taken losses, don’t get discouraged. Stay focused and keep monitoring the market, because this is not the time to give up. It’s entirely possible that, just like in 2020, after a brief recovery period, the market will start climbing again. When fear drives the market down, remember — a single piece of positive news can turn everything around. ⚠️ One key lesson: Always expect the unexpected in high-risk markets. If you trade futures, make sure to use isolated margin mode to protect your capital and prevent total liquidation.
Disclaimer
Any content and materials included in Sahmeto's website and official communication channels are a compilation of personal opinions and analyses and are not binding. They do not constitute any recommendation for buying, selling, entering or exiting the stock market and cryptocurrency market. Also, all news and analyses included in the website and channels are merely republished information from official and unofficial domestic and foreign sources, and it is obvious that users of the said content are responsible for following up and ensuring the authenticity and accuracy of the materials. Therefore, while disclaiming responsibility, it is declared that the responsibility for any decision-making, action, and potential profit and loss in the capital market and cryptocurrency market lies with the trader.