
CFcryptoTA
@t_CFcryptoTA

What symbols does the trader recommend buying?
Purchase History
پیام های تریدر
Filter
CFcryptoTA
ETH getting ready

Hello everyone, I mainly updated you on BTC lately. So here is a quick update on ETH the prince. With the merge coming eth has now painted a very well-known pattern. We can see we have now almost fully formed a Cup and Handle pattern. Although this pattern is more often than not a continuation pattern it can also be found at the tops and bottoms. We can see the volume has dried throughout the formation and we now have formed the handle. 52 ma is confirming the pattern sustaining this last push with price breaking above. The target would be 4k+. I will wait for the breakout before entering and will use strict stop losses rules. We are close to a possible bottom for Crypto...get ready either way. FOLLOW ME, SHARE. LIKE AND COMMENT.
CFcryptoTA
BTC forming a bottom

There is a chance that BTC is finally forming a bottom here. We have the characteristics of a double bottom in place here. The volume is expanding on the last move up after a selling climax on the first bottom and selling volume shrinking on the second bottom. This formation is a textbook Eve and Eve formation. It is the most reliable among the double bottom with very low failure rates. Traders will need to be patient and buy a valid breakout. So fasten your seatbelt, because either way it will be a rocky road. FOLLOW ME, SHARE, LIKE AND COMMENT.
CFcryptoTA
BTC close to a reversal

Hello Everyone. Let's dive deep into BTC today. We have a very interesting set up at this level. BTC have been moving in an uptrend channel for the past 10 years. We can appreciate that BTC is now flirting with the lower boundary of the channel providing Maximum risk reward ratio. During previous bear markets the bottom trendline of the channel has worked as a strong pivotal point providing support and a level to look for a potential reversal. Probabilities also improve if we apply Elliott Wave analysis. We can appreciate that BTC have suffered a truncation at 70k with the early end of wave 3 of the last cycle. EW suggest that a point of interest for a retracement is the 0.382-0.5 fib level of the previous wave. This is perfectly in line with the current level and previous low of 17k. We can also apply the measurement fib extension tool to see if there is any other level of interest which is in line with the current level. We can see that this last move is the 1.3 fib extension of wave A from the end of wave B which project us to were BTC is standing now. I know there are some warning signs at this level as BTC lost the 208 MA support. However, the mean (208MA) still on upward slope suggesting that the secular trend has not reverted its course yet but instead we are still in a secular bull market. If we go deeper looking at the oscillators and other indicators we can see that the RSI have now crossed up the oversold band from a deep low giving a possible buy signal. Also we are now approaching the RSI bear market trendline, which if penetrated will give a strong buy signal. Looking at the DMI we can see that as per now we are looking at a swing failure with a possible Lower High if we pivot at this level. This would also signal that bear momentum is dissipating and bulls are slowly gaining control. Last but not least is the volume. I personally do not like to look at volume on Bitstamp as I believe it is misleading as it is a low volume exchange compared to coinbase, binance and FTX. Nevertheless we can see we had to above average spike in volume back in May and June, which suggest a possible bear market climax, followed by a below average volume in the next few moves. This suggest interest as dissipated in the market and supply has stalled. These are great conditions for a reversal. If we were to look at Binance however we would notice that volume has actually increase substantially at these levels, increasing the possibility of an accumulation phase at these levels. Nevertheless there is a possibility that we will see one last spike of volatility to the downside, which if it happen will be very quick and painful but I see it unlikely to actually stay below 17 k for a long time, it will be more probably a spring, or spike pattern. This level meet my criteria for a long position and possible reversal, hence I am now looking to position myself at these levels. In case we were to lose the previous peak support at 18900, then I would switch to dry powder and wait on the sideline until a reversal pattern unfold. I hope you enjoyed the analysis and do not hesitate to contact me if you have any question. FOLLOW ME, SHARE, LIKE AND COMMENT
CFcryptoTA
BTC weakening

I haven't posted on here for quite a while, so I decided to update you on BTC. We can appreciate that BTC has been forming bearish flags throughout this bear market. These are typical distribution patterns where traders take profit and bottom pickers gamble based on thin assumptions. We can see that every time BTC broke out these formations it resulted in a strong volatile move to the downside. We also have similarities in how every time BTC recovered above the 52 MA, the loss of it would validate the pattern providing resistance and points of entry for shorts. BTC had a mild reaction based on the last inflation data that had found resistance at the Anchored VWAP of the bottom of 2018. VWAP are level of interest where institutions look for liquidity in either sides (Supply and Demand). Institution and big funds to enter or unload their bags need a high amount of liquidity in order to fill their orders or pass their assets to you, otherwise they would create a strong reaction in the market or simply lose money in the spread created. VWAP is volume weighted average price so track the price average weighted for its volume suggesting areas where the price has strong volume. BTC at the moment has clearly broke out the formation, however this time it seems there is less gasoline on fire. We have a very important level to keep our eyes on which is the previous 2017 peak. This level proved to be a strong support. At the same time the price have been overstretched to the downside which is clearly shown in the oscillators. I would be cautious at this point as strong volatility may enter in both sides at this 18800. The pure target of the formation is down to 11k which is a strong possibility now. However pay attention at the data at 18800 as things may reverse quickly. Short term I expect a retest to the broken support of the formation before a continuation to test the 18800 support. At the moment I am staying on the sidelines waiting for a strong candle signal which either confirm the downtrend and show a potential reversal. In my community we have recognised the warning signs early and we are out since 24000 avoiding a 17% drawdown of the last drop. Just always remember to use sound risk management...DCA can be powerful long term (5 to 10 year) but short term will destroy your capital as I believe we don t have infinate fund and you will find yourself in a strong losing position. DCA is best at the beginning of a bull trend rather then in a bear market. FOLLOW ME, SHARE, LIKE AND COMMENT
CFcryptoTA
BTC is showing strength

BTC has started to show some sign s of strength with this consolidation above the 21500 resistance. It has now formed a bull pennant (half mast formation). As you can see I laid out the EW analysis and I am now expecting the possible start of the new bull run. We are in the first wave of the first wave of primary degree. A perfect spot to enter for my strategy. There is always the risk of failure as the FOMC meeting is set for the 27. However we haven't seen this kind of set up for a long time. The invalidation point is a break below the 19 k level. FOLLOW ME, SHARE, LIKE AND COMMENT. I am also delighted to inform you all that I am now a Chartered Market technician level 1 recognized by FINRA. I have 2 more level to complete to gain the full designation of Chartered Market Technician. This qualification have been inspired by all of you and your support. I am grateful to have you all here following me.
CFcryptoTA
SPY either outlier or on perfect course
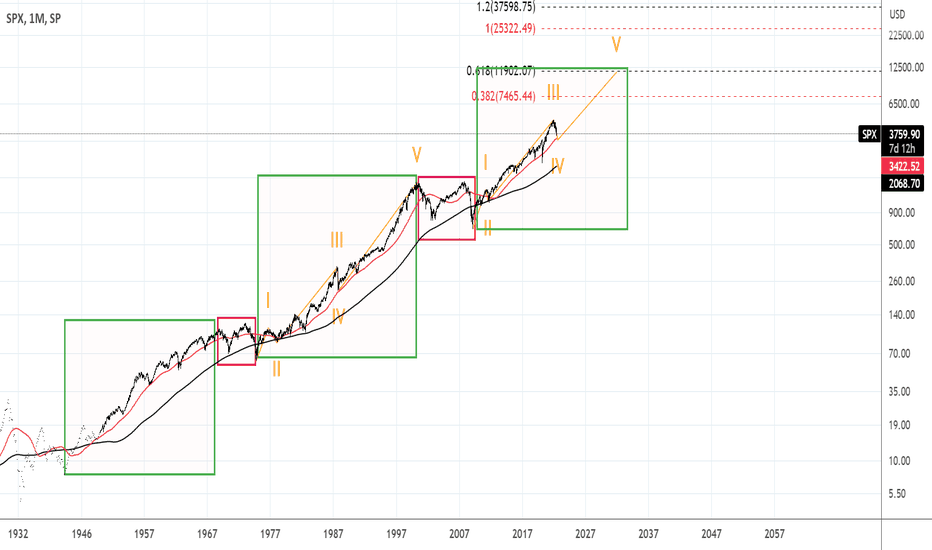
You can see there is a strong difference between the real cyclical bear market and the current correction. Also the primary bull market last 25 years last time from 75' till the 00'. We are now at around half cycle (13 years in). Last cycle SPX did 20x since cycle low the cycle before was around 13x (if data reliable), now we have just done 6x really underperforming. The 52 weeks MA has been the support of the bull market cycle as you can see in the chart. Hence I doubt the current correction will last for much more.
CFcryptoTA
BTC update

LEGEN...wait for it...DARY A break of the channel will be very bad news, a Secular trend would be broken and a full bear market will be on. FOLLOW ME, SHARE, LIKE AND COMMENT
CFcryptoTA
Bottom starting

This is the full EW analysis since 2021. Classic Zig Zag correction with over extended B wave or some may classify this as expanded flat neglecting one wave in wave A back in May 2021. We have completed the 5 waves down of wave C. Personality of the wave was confirmed with volume expansion and fear in the street. The last lower timeframe wave 5 was extended which gave a target of 16800 which is yet to come...in any case crumbles do not matters. Now we are about to flirt with the bottom of the 10 years trend. if we violate this, dark times are ahead, meaning something fundamental has changed in the space. Nevertheless, these are my expectation for the near future. The two levels to e reclaimed are the 22k and 32 k, both with clear 5 waves move. These will give the trigger signal a new cycle has started. The best entry would be on the retracement after the 5 waves move up to 22k. Now any entry is at maximum RR but it could lead to capital erosion due to SL hitting multiple times. Just play safe and wait for a clear trend reversal as these are risky times. FOLLOW ME, SHARE, LIKE AND COMMENT
CFcryptoTA
BTC is close

Few days ago I have posted a chart looking at the possible move of BTC in the short term. If you have seen the post then you were expecting this already. Now this one will be simple and painless. You can see the trend channel BTC is currently following in its downtrend. You can also see the various Fib levels, from the targets of the EW analysis from back in January and to the retracement levels typical of wave 3 and Dow theory. We are in bottom territory, volatility will shrink soon in the next few days, probably just before the FOMC meeting. BTC has now tapped the 200WMA which was also highlighted as a target previously. I can still see a week to touch 20-21 k. I am now waiting for the market to give the signal and settle in. Whether I think is the bottom or not is irrelevant until the markets will give us the signal. My opinion? Yes we are getting there. Any sign? not yet. So let's wait and see. In the meantime a divergence has unfold in the traditional market which could be a bullish sign. The SPY has made a new low but the Russel 2000 has failed to confirm and print a new low. This is potentially bullish, however is very early stages. FOLLOW ME for more updates, SHARE, LIKE and COMMENT
CFcryptoTA
BTC cooking one more leg
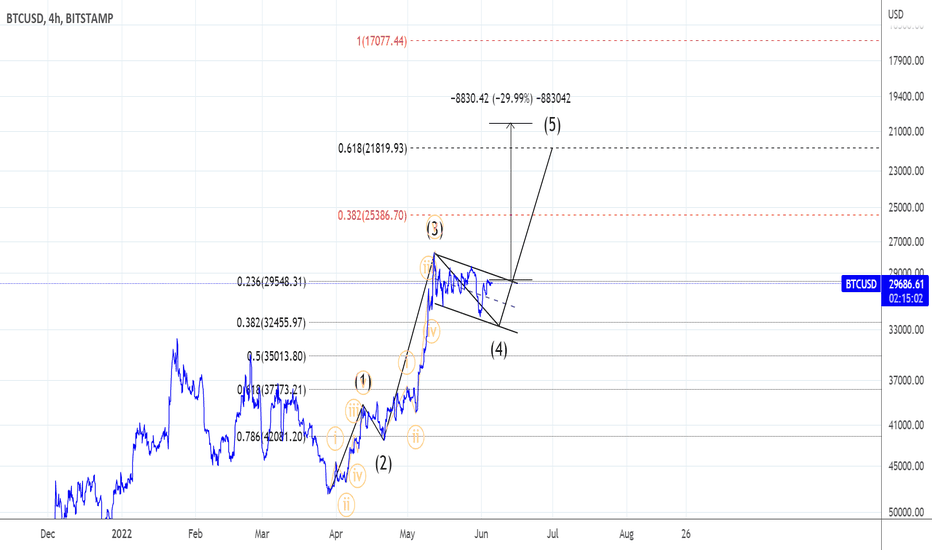
EW analysis. Targets either 0.382 or 0.618. Action signal only on the breakout. Half mast formation usually run 60% of pole distance which is in line with the 0.618 target. Nevertheless once again, the breakout will rule the direction. SL below point 4, the entry on the breakout or pull back after the breakout. Trailing stops will follow the trend. NEVER ACT WITHOUT A SIGNAL (BREAKOUT). The signal should also follow filter breakout based on ATR or STD to account for volatility (advanced concept). P.S inverse chart
Disclaimer
Any content and materials included in Sahmeto's website and official communication channels are a compilation of personal opinions and analyses and are not binding. They do not constitute any recommendation for buying, selling, entering or exiting the stock market and cryptocurrency market. Also, all news and analyses included in the website and channels are merely republished information from official and unofficial domestic and foreign sources, and it is obvious that users of the said content are responsible for following up and ensuring the authenticity and accuracy of the materials. Therefore, while disclaiming responsibility, it is declared that the responsibility for any decision-making, action, and potential profit and loss in the capital market and cryptocurrency market lies with the trader.