
ByteSignals
@t_ByteSignals

What symbols does the trader recommend buying?
Purchase History
پیام های تریدر
Filter
ByteSignals
بیت کوین روی خط قرمز: آیا حمایت کلیدی کانال موازی و میانگین متحرک 50 هفتهای نجاتبخش است؟
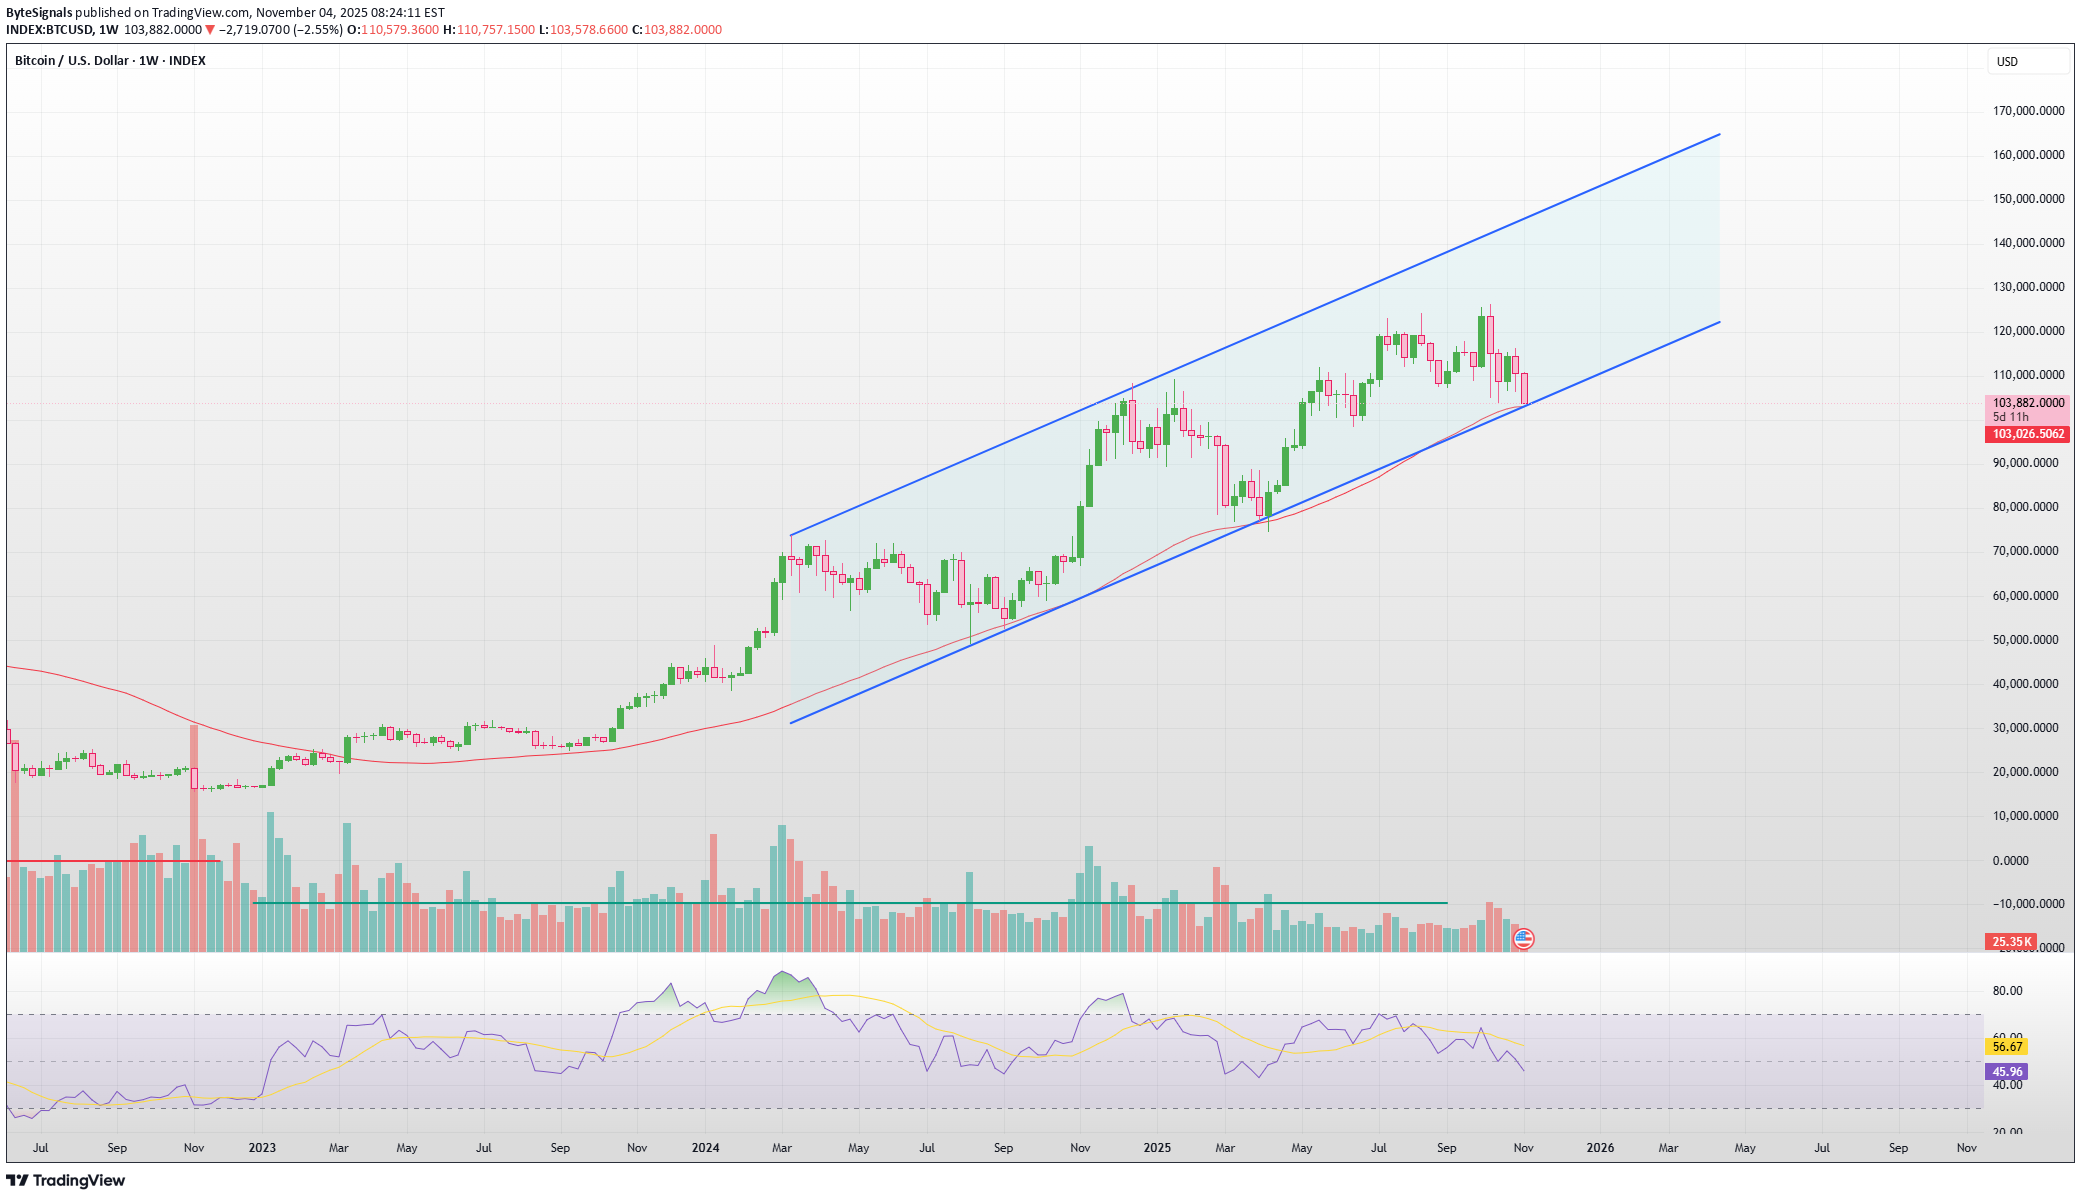
Bitcoin is currently testing a critical confluence zone — the lower boundary of the parallel channel and the 50-week SMA. ✅ The trend structure remains intact as long as BTC holds above this channel support. ⚠️ A weekly close below could invite deeper correction toward the $90K zone. 📊 RSI is cooling down but still above the midline, suggesting potential for a rebound if buyers defend this area. Reasons a Bounce Is Likely 1. Channel Support BTC is exactly at the lower boundary of a long-term ascending channel — historically, these levels have acted as strong dynamic support zones, where previous pullbacks found footing. 2. 50-Week SMA Confluence The 50-week Simple Moving Average (SMA) aligns closely with the current price zone. → Historically, Bitcoin often respects the 50 SMA as a mid-cycle support, especially during healthy bull markets. 3. RSI Reset RSI on the weekly chart has cooled off near mid-level (around 45–50), which is often a “reloading” zone before another leg up. It shows there’s room for momentum to rebuild upward. 4. Volume Decline on Pullback The declining sell volume hints at seller exhaustion. A spike in buy volume could easily trigger a reversal from here. Conclusion: BTC must hold this level to maintain the long-term bullish structure. A strong bounce here could mark the next leg higher within the channel.
ByteSignals
SushiSwap Ready to Serve a 1671% Move against Solana?

SUSHI/SOLUSDT Weekly | Falling Wedge Breakout + High R/R Setup After a multi-year downtrend, SUSHI has finally broken out of a large falling wedge — a classic reversal pattern. This is the first real structural breakout against SOL in over 3 years, and the volume spike confirms strong buyer interest. 📈 Technical Highlights: ✅ Breakout from Falling Wedge (long-term structure) ✅ Weekly RSI breakout from multi-year lows ✅ +171% move already confirmed from local bottom 📊 Volume surge supports a reversal 🎯 Targets based on prior resistance zones TP1: 0.011 (224% gain) TP2: 0.031 (541%) TP3: 0.094 (1671%) This isn’t just a bounce — this could be a cycle-level trend reversal. 🧠 Sentiment & Psychology: Most have written off SUSHI. That’s exactly why this setup is powerful. The market punishes late followers and rewards early contrarians. 🛡️ Risk Management: Always use proper stop-loss. While the setup is high probability, risk is always present. 🚀 Summary: SUSHI vs SOL looks like a classic accumulation breakout. With a huge upside potential and strong technical structure, this might be one of the most asymmetric setups in the market right now. 📌 Add to your watchlist, set alerts, and ride the momentum.
ByteSignals
ETH Breakdown Retest in Progress — More Downside Ahead?

🧱 Breakdown Retest StructureThe triangle/wedge was broken to the downside around May 28–30.After the breakdown, price has rallied back and is now hovering around the lower boundary of the broken triangle—classic bearish retest behavior.This structure often plays out as: Breakdown → retest of support as resistance → continuation down.🔴 Confluence for Bearish Outlook:Lower Highs + Weak Momentum: Recent price spikes are showing rejection wicks near $2,700, indicating seller strength.Volume Drop: Weak follow-through on the bounce suggests it's a corrective rally, not accumulation.EMA Pressure: The price is struggling to hold above the 20 EMA, showing hesitation.Bearish AB=CD Structure: The rally from the bottom might be forming a harmonic ABCD correction before the next leg down.Major Resistance Zone ($2,720–$2,800) is being respected—multiple rejections are evident.⚠️ Bearish price projections:If ETH fails to reclaim $2,720–$2,750 and closes below $2,580 on the 4H chart, expect downside targets:🎯 Target 1: $2,460 (recent support zone)🎯 Target 2: $2,220 (origin of the last rally)🛑 Invalidation: 4H close and hold above $2,800 would invalidate this bearish thesis.🧠 SummaryYou're spotting what looks like a bearish retest after a breakdown, which is a high-probability short setup in technical analysis. While bulls are attempting to push back, unless ETH breaks back into the triangle, the path of least resistance looks down.📌 Conclusion: Wait for a 4H rejection near $2,700 with strong bearish candle for confirmation. Stop above $2,800. Profit targets: $2,460 and lower.
ByteSignals
Raydium (RAY/USDT) - Bullish Continuation Setup

Raydium is currently trading within a well-defined ascending channel, respecting both support and resistance since early 2024. After a healthy pullback to the lower trendline, price has shown a bounce, suggesting renewed buying interest at this key level.🔍 Pattern Observations:Price is holding the channel support strongly, confirming it for the third time.Mid-channel rejections have acted as temporary resistances, while the overall structure remains intact.The recent test of the lower trendline presents a strong risk-reward entry zone for long-term bulls.📊 Bullish Scenario:If RAY continues to respect this channel and breaks above the upper resistance:Breakout Target Projection (measured move from channel height):Current price breakout estimate: ~$2.43Height of channel: ~$4.50➤ Projected Target = $2.43 + $4.50 = ~$6.90 to $7.00Extended Projection (conservative fib extension aligns with your markup):Potential blow-off target: ~$25 to $30🎯 Targets (Post-Breakout):Initial: $6.90 ~184%Mid-Term: $15.00 ~517%Long-Term: $30.00 ~1135%💡 Conclusion:RAY is setting up for a potentially explosive breakout. If the structure holds, current levels may offer a high-probability long entry with favorable upside. Keep an eye on volume confirmation and daily closes above the mid-channel to gauge momentum.#RAYUSDT #CryptoAnalysis #Raydium #BullishPattern #BreakoutSetup #Altcoins #TradingView
ByteSignals
ETH/USDT – Waiting for Retracement After Strong Impulse Move

Ethereum has shown a strong impulsive rally from the $1,750 zone, breaking through key resistance levels. Now, price is approaching a major supply zone and resistance between $2,450–$2,600, suggesting a potential pullback.🔹 Technical Highlights:The current move is a clean vertical impulse leg with little consolidation — a retracement is likely before continuation.Key Fibonacci retracement levels are drawn from the recent swing low to high:0.382 Fib: $2,2180.5 Fib: $2,125 (Buy Zone)0.618 Fib: $2,067A support block and potential bullish reaction zone is aligned with the 0.5 Fib level, marked as a “Buy Here” zone.RSI is deeply overbought (~86), increasing the likelihood of a temporary correction.🟢 Trade Plan Summary:Scenario : Price rejects from $2,450–$2,600 resistance, pulls back to the 0.5–0.618 Fib zone, and then resumes bullish momentum.Buy Zone: Around $2,125, with confluence from Fib, structure, and trendline support.Buy Zone: Around $2,125, with confluence from Fib 0.5, structure, and support.Target: New highs above $2,600, possibly heading toward $3,000+ in the medium term.📌 Outlook: Bullish on confirmation of pullback support — waiting for healthy retracement for re-entry.
ByteSignals
ETH/USDT – Rising Wedge Breakdown Confirmed

Ethereum has officially broken down from the rising wedge pattern on the 1-hour chart, confirming a bearish reversal. The wedge breakdown was accompanied by a clear bearish divergence between price and RSI, where price made higher highs but RSI formed lower highs — a strong early warning of weakening bullish momentum. 🔻The price action has now closed below the wedge support line, signaling potential continuation to the downside.🔹 Current Outlook:Breakdown has been confirmed with a bearish candle close below support.RSI is turning down, suggesting more room for further downside movement.Immediate minor support zones are near $1780 and $1750.Bigger target lies around $1690 based on the measured move of the wedge.🔹 Trade Management: ✅ If you are already short from the wedge break, managing the trade with stop-loss above $1850 would be reasonable.\ ✅ First take-profit levels: $1750, then $1690 for extended targets.📌 Note: Watch for retest scenarios — price might come back toward the broken wedge support (~$1800–$1810) before continuing the drop ("kiss of death" retest pattern).
ByteSignals
Gold at Key Support – Potential Reversal Trade Setup

Gold (XAU/USD) is testing a strong support zone after a bearish move. This level has historically acted as a demand zone, making it a high-probability buying opportunity.Entry: Near the support zone around $2,880-$2,885Stop Loss: Below the support at $2,862 to manage riskTake Profit 1: $2,920 – Previous resistance levelTake Profit 2: $2,953-$2,964 – Upper range resistance📊 RSI is oversold, signaling a potential bounce.📈 If price holds above support, a bullish reversal could follow.🚀 A breakout above $2,900 could accelerate the move.🔔 Risk management is key! If price breaks below support, reassess the trade.#XAUUSD #Gold #Trading #PriceAction #Support #Forex
Disclaimer
Any content and materials included in Sahmeto's website and official communication channels are a compilation of personal opinions and analyses and are not binding. They do not constitute any recommendation for buying, selling, entering or exiting the stock market and cryptocurrency market. Also, all news and analyses included in the website and channels are merely republished information from official and unofficial domestic and foreign sources, and it is obvious that users of the said content are responsible for following up and ensuring the authenticity and accuracy of the materials. Therefore, while disclaiming responsibility, it is declared that the responsibility for any decision-making, action, and potential profit and loss in the capital market and cryptocurrency market lies with the trader.