
Buyhim
@t_Buyhim

What symbols does the trader recommend buying?
Purchase History
پیام های تریدر
Filter
Buyhim
Wyckoff Distribution Schematic #1 – Explained
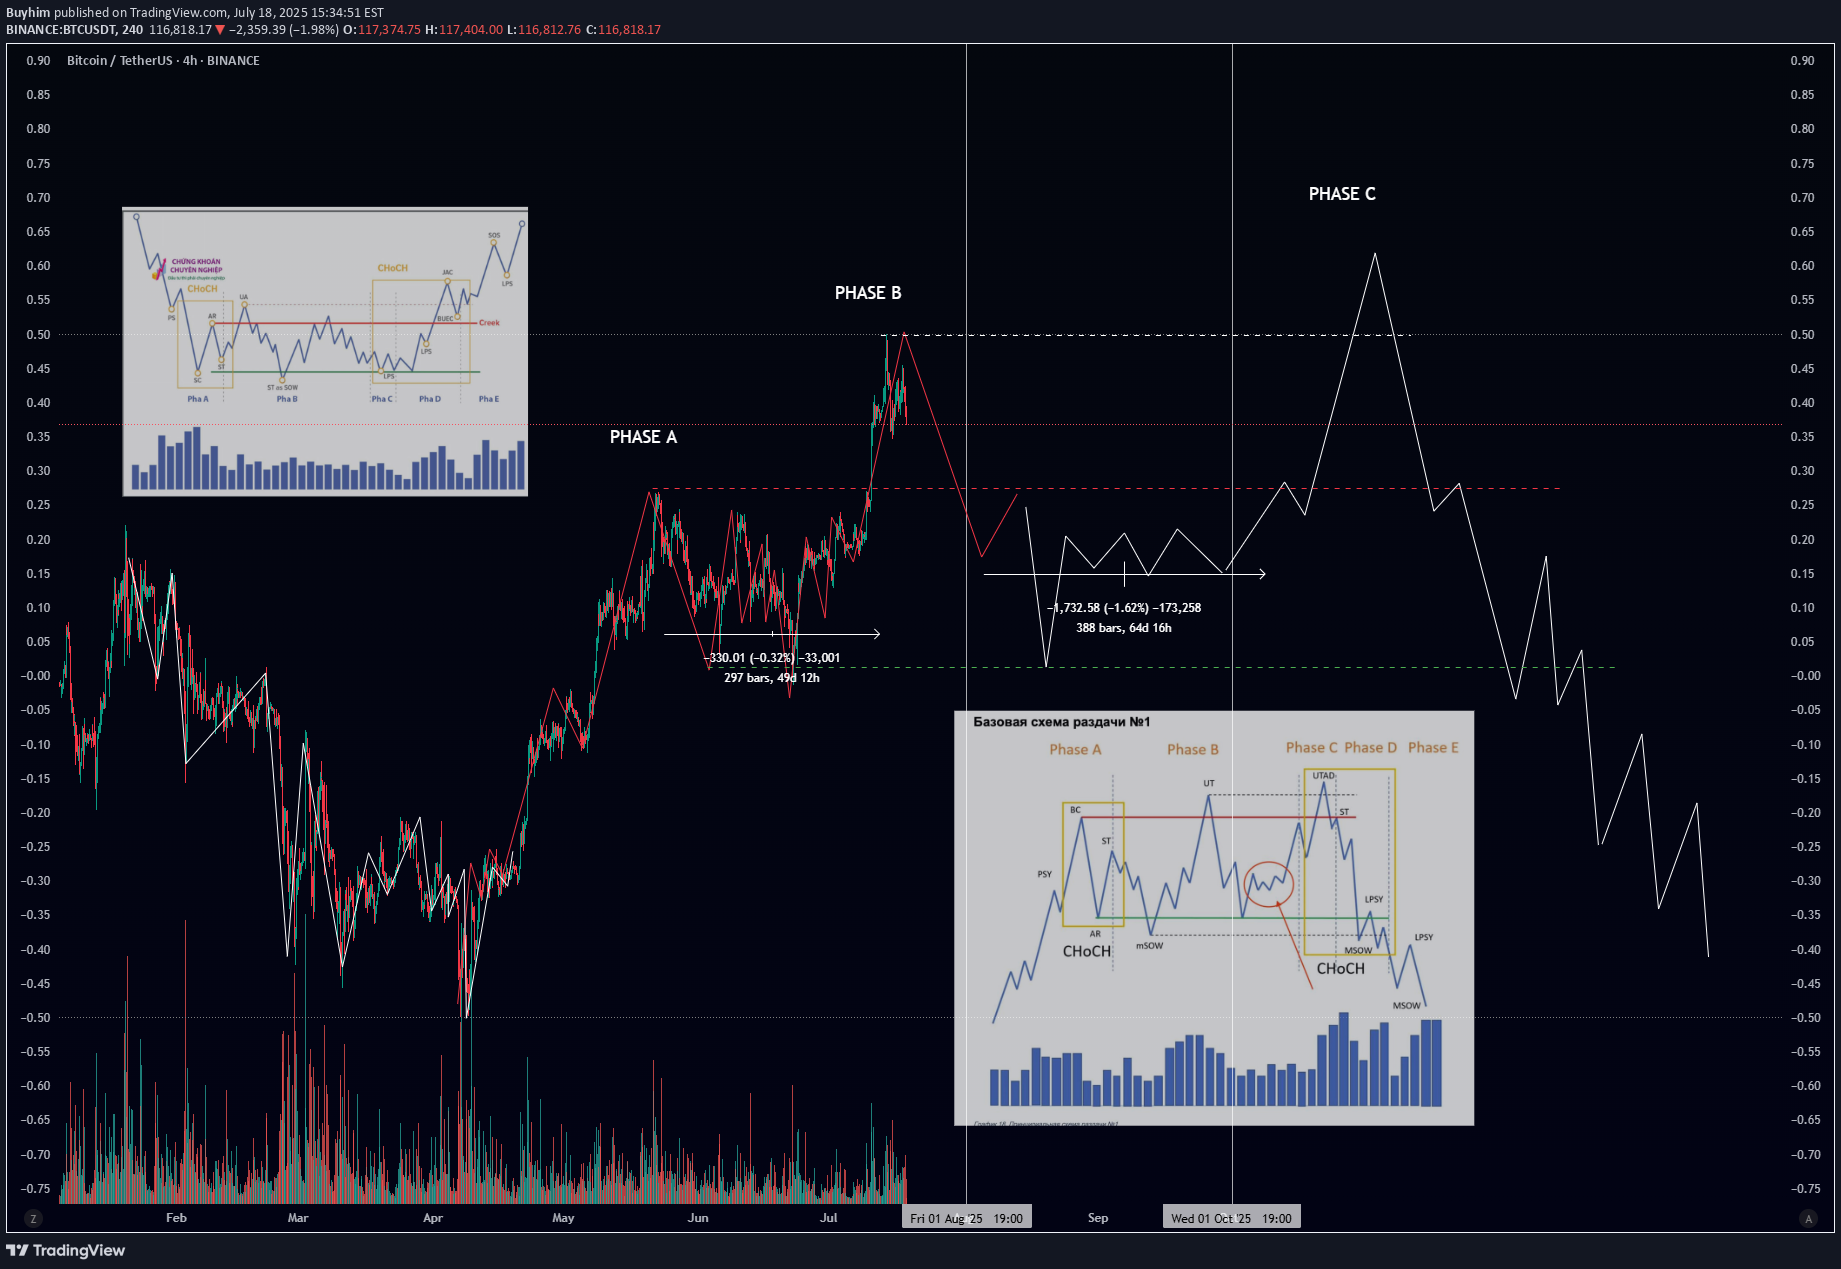
If you’ve ever wondered how smart money offloads their positions before a major downtrend — this is it. The Wyckoff Distribution Schematic #1 is the mirror opposite of accumulation. It reveals how institutions distribute (sell) to retail before the market collapses. 🔍 Phases Breakdown: 🟠 Phase A – Preliminary Supply & Buying Climax PSY (Preliminary Supply): First signs of selling pressure. BC (Buying Climax): Sudden surge in price with high volume – often traps late buyers. AR (Automatic Reaction): Price drops as buyers lose momentum. ST (Secondary Test): Retest of the top – often with lower volume. 🔄 CHoCH (Change of Character): Early warning sign that supply is increasing. 🟡 Phase B – Building the Cause Sideways price action where large players distribute their holdings. UT (Upthrust): Fake breakout above resistance. mSOW (Minor Sign of Weakness): Slight breakdowns showing cracks in structure. 🔴 Phase C – The Trap UTAD (Upthrust After Distribution): Final fakeout to trap bulls before the real drop. Market often shows strength… right before the collapse. Another CHoCH confirms the shift toward bearish control. 🔵 Phase D – Breakdown Begins LPSY (Last Point of Supply): Final bounces with weak demand. MSOW (Major Sign of Weakness): Strong breakdown on high volume — momentum shifts decisively. ⚫ Phase E – Downtrend Distribution complete. Price trends downward with weak rallies. Retaiя is left holding the bag. 📊 Volume matters: look for volume spikes on upthrusts and breakdowns, and declining volume on bounces. 🔁 Compare with Accumulation: Accumulation ends in Spring → Uptrend 📈 Distribution ends in UTAD → Downtrend 📉
Buyhim
ETH FAST TRADE [15M]
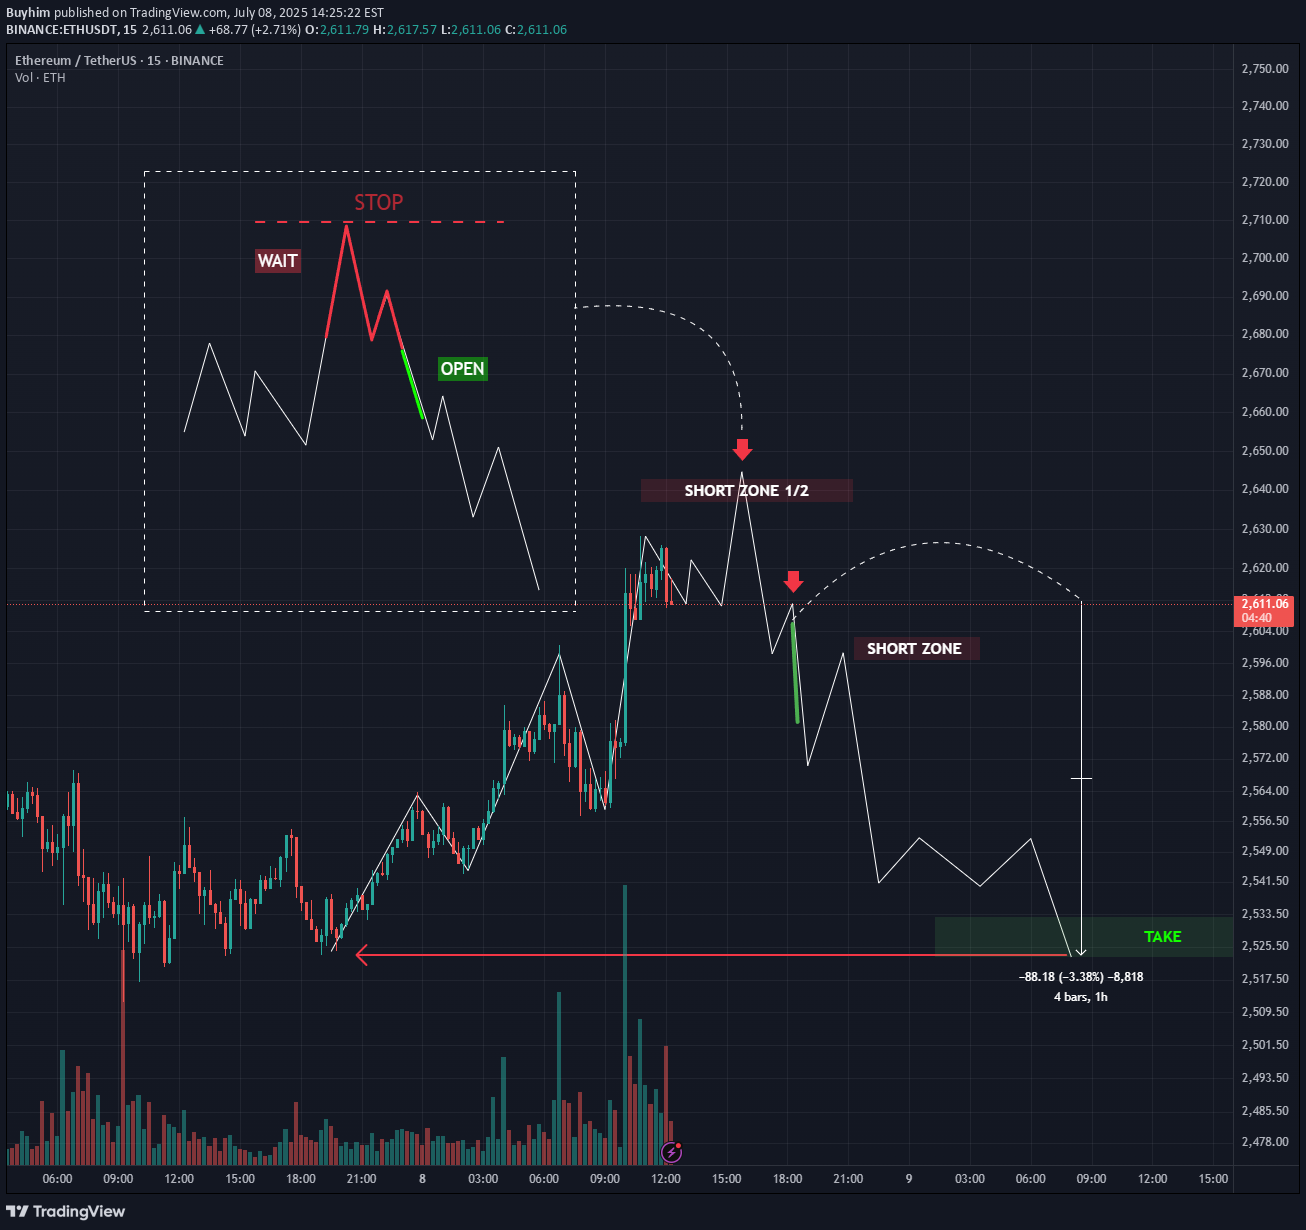
📝 My ETH Short Idea (Test Trade)This is a test idea where I’m simply practicing my analysis and trade execution. It’s built entirely on my own personal strategy, so it’s primarily for self-development and tracking.💡 The main setup:I’m looking for a short position on ETH, but this idea will only be valid if all my levels and conditions align exactly.Otherwise, I’ll skip the trade.📌 How to enter:I’ve detailed exactly how to enter the trade:Wait for my specific trigger conditions to be met (price levels + confirmation by my indicators).Enter only after the setup is fully formed — no early entries.Manage risk properly with stop-losses beyond key invalidation levels.Scale in only if price structure continues to validate my scenario.⚠️ Important:This is not financial advice. I’m using this idea mainly to test and refine my strategy. Sharing it here for transparency and to improve my analytical discipline.✅ Plan:If the setup completes exactly as planned, I’ll look for targets according to my strategy’s rules, trailing stops along the way.
Buyhim
SHIBA BULL/BEAR
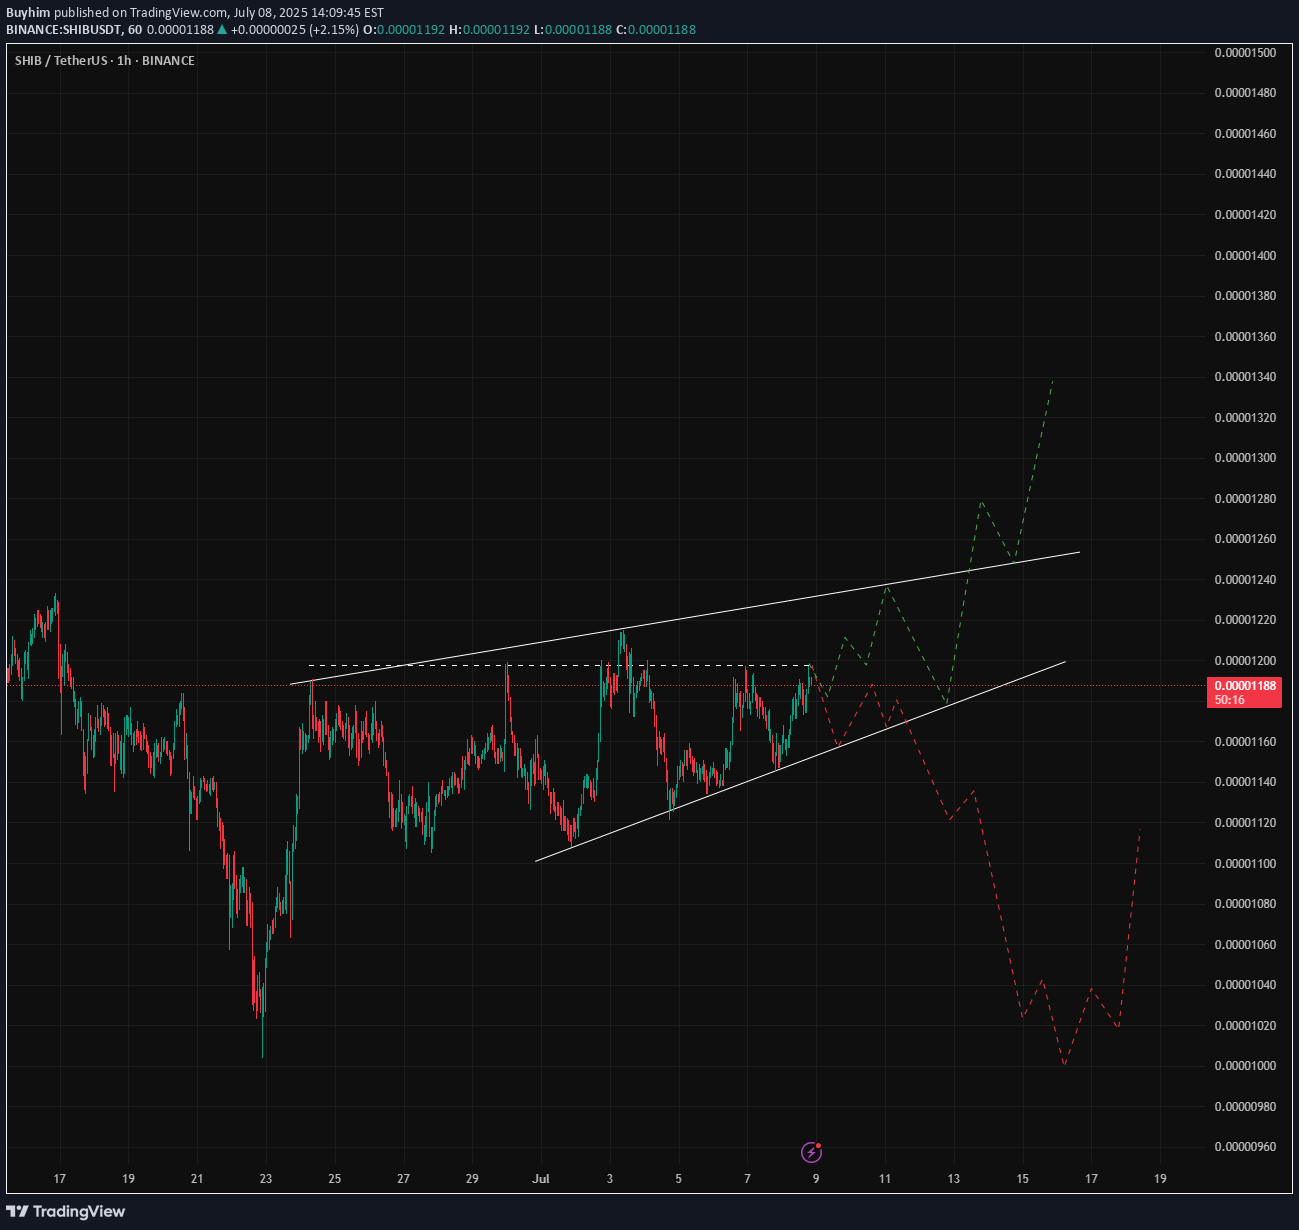
📊 SHIB/USDT (1H) AnalysisPrice is consolidating inside a rising wedge pattern. A strong breakout is expected soon.Possible scenarios:✅ Bullish case: Break above the upper trendline (~0.0000124) could push SHIB towards 0.0000130 - 0.0000134.❌ Bearish case: If support around 0.0000115 fails, a drop toward 0.0000100 - 0.0000104 is likely.🔎 Key levels to watch:Resistance: ~0.0000120 — critical for confirming a bullish breakout.Support: ~0.0000115 — losing this level could trigger a sharper decline.Watch RSI and volume for breakout confirmation.💡 Trading idea:Long on breakout & retest above 0.0000124, targets at 0.0000130+.Short on breakdown below 0.0000115 with targets near 0.0000100.Use tight stops outside the wedge for risk management.
Buyhim
[1H] FLOKI x BUYHIM
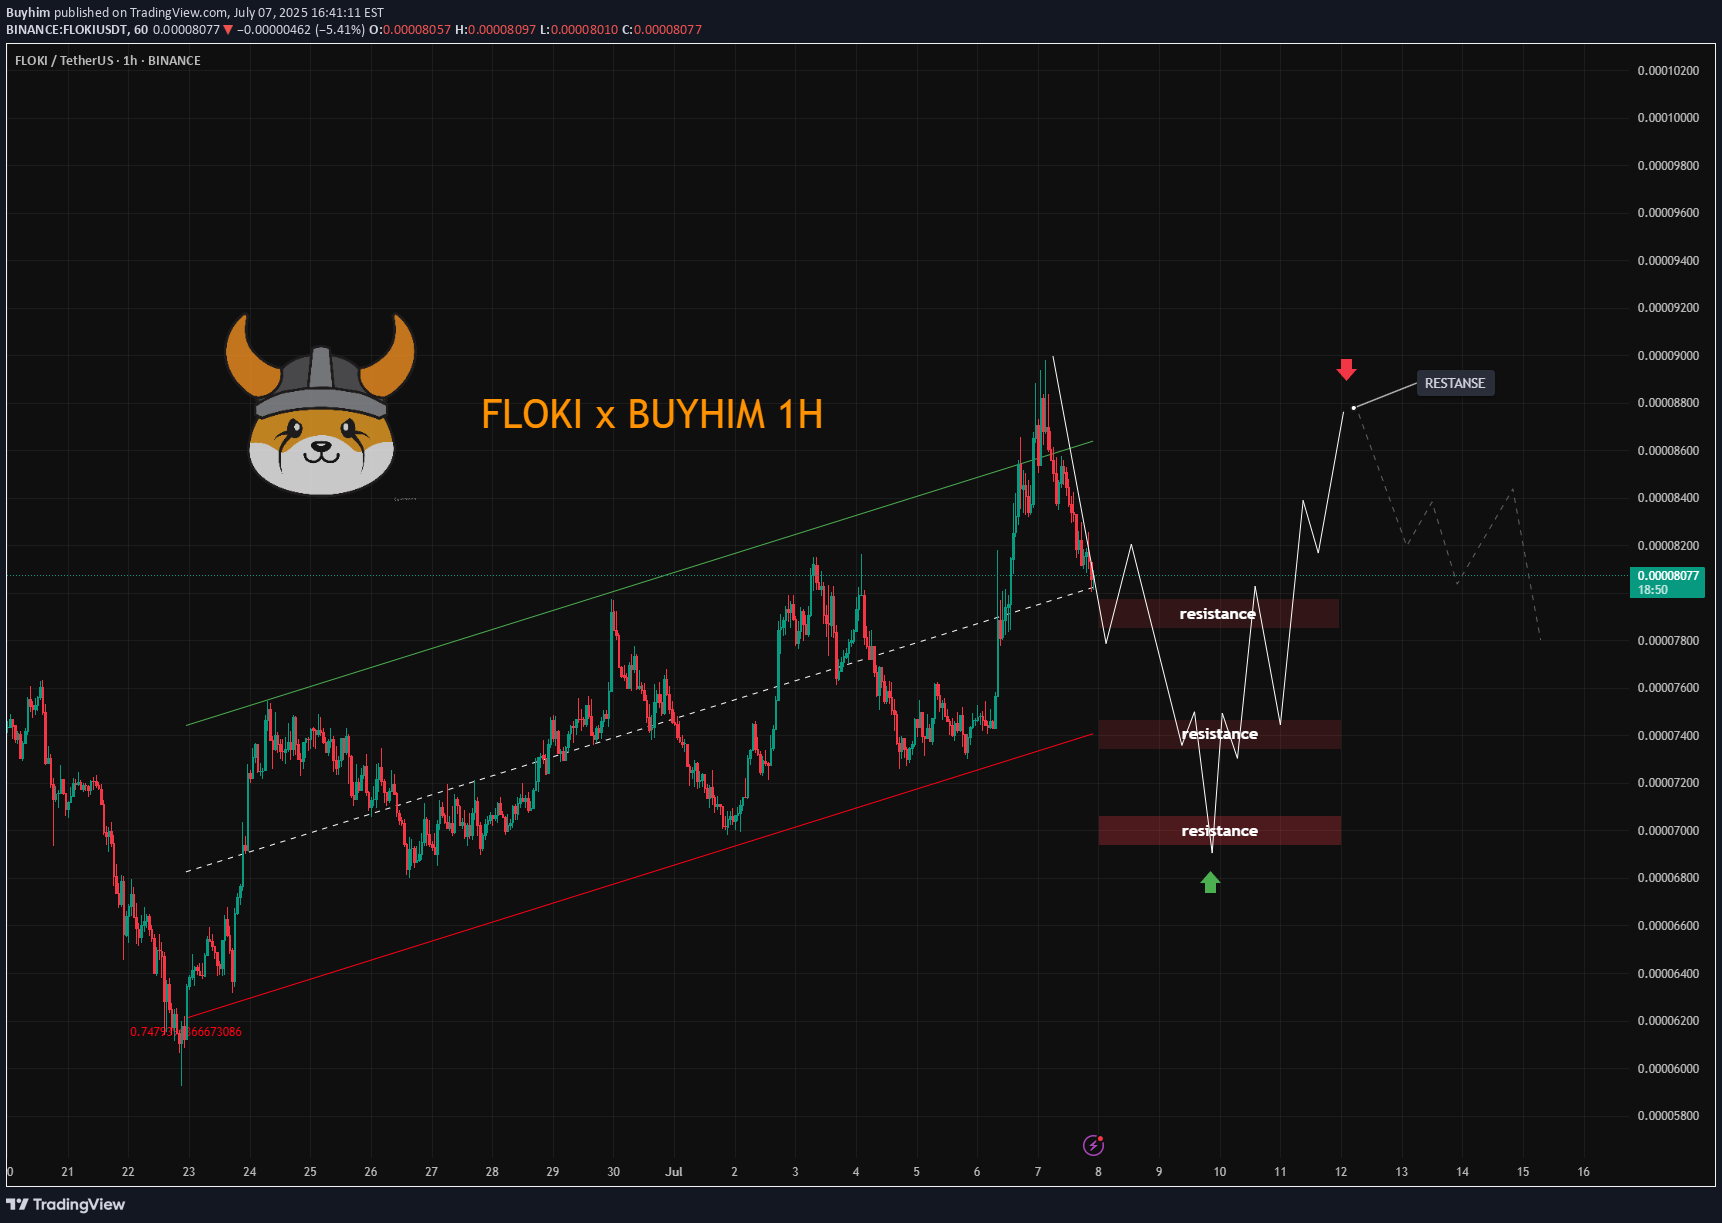
This chart presents an hourly analysis of the FLOKI/USDT pair with a potential scenario for price movement. The current trend is developing inside an ascending channel, where price recently bounced from the lower boundary and reached the upper one, triggering a correction.📝 Key points:The price tested the upper boundary of the channel and started moving down.Three key resistance zones are highlighted where reactions or profit-taking might occur:First zone around 0.00007800Second zone around 0.00007400Third zone around 0.00007000A further decline toward the red support line is expected, where a local bottom may form.After reaching this support, there is a potential for an impulsive move back up to retest the upper levels and possibly break recent highs.📈 Idea:Watch for the scenario to play out with a correction into the red zone and a bounce.Look for buying opportunities if reversal patterns appear on lower timeframes around the lower support.Targets on the rebound are set toward a return to 0.00008200 and higher.⚠️ Risk:If the red support breaks downward, the scenario becomes invalid, opening the way for deeper levels.Looking for experienced traders with deposits from $10,000+ to exchange insights and strategies, telegram: t.me/thebuhim
Buyhim
JASMYUSDT — Midterm Outlook | Buy & Sell Zones
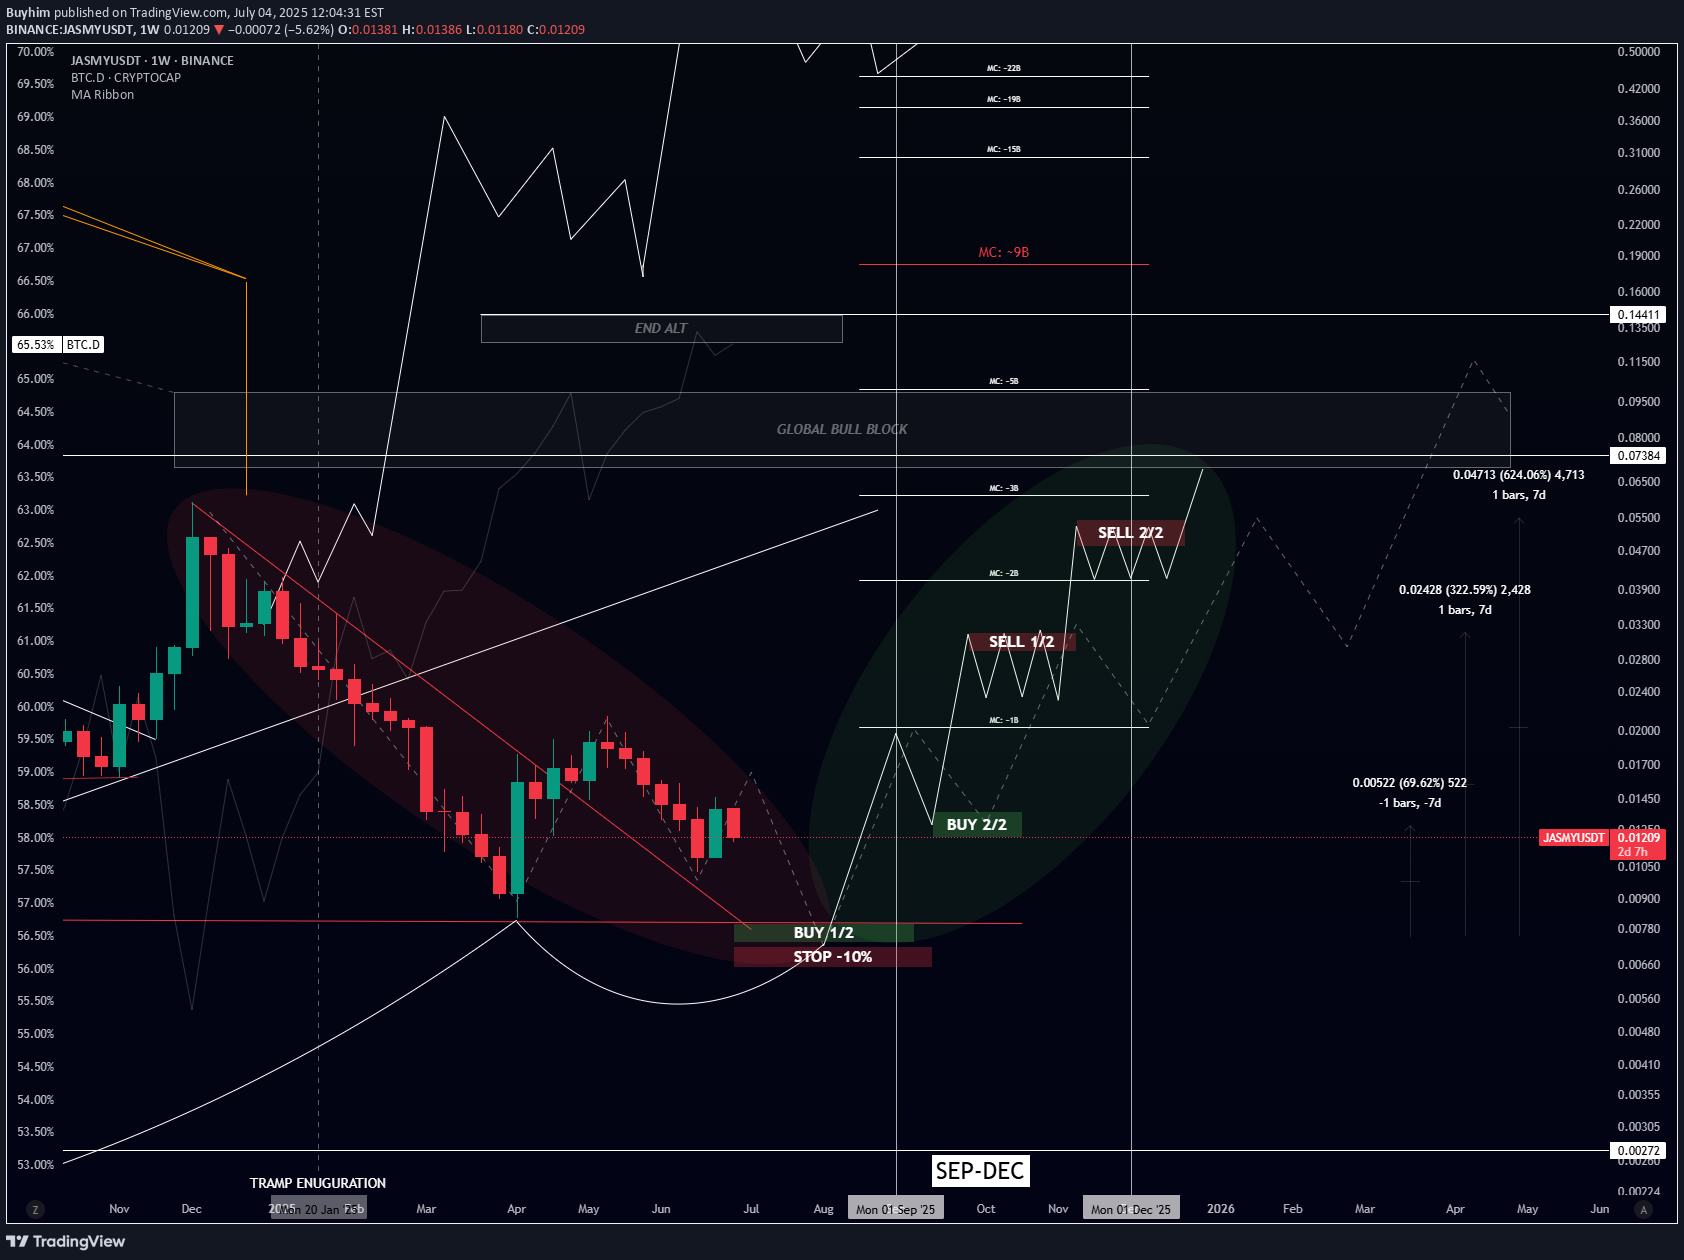
🚀 JASMY 2025-2026 Roadmap — What to WatchHere’s my condensed view on JJASMY for the next few quarters:🔹 Q2 2025 (Jul–Sep)Expect the alpha launch of the Jasmy App, first partnerships with local governments & sports teams, plus the big debut of JANCTION Mainnet L2, DEX and staking.Could fuel a 20–40% rally on hype and fresh use-cases.🔹 Q3 2025 (Oct–Dec)Rollout of MyResume (HR-focused product), more JANCTION node sales and ecosystem build-out.Should support a 10–20% steady appreciation if adoption shows up.🔹 Q4 2025 – Q1 2026Payments system to go live, aiming for 20,000 nodes, plus new banking & sports partnerships.Could drive a 15–25% gradual climb into early 2026 if executed as planned.💡 Bottom line:This is shaping up as a multi-stage roadmap — short-term speculation in Q2, then more fundamentals in late 2025 to early 2026. If milestones hit and the broader market stays healthy, we might see a decent stair-step move higher.🔥 Watching: JANCTION Mainnet deployment, real usage of MyResume, and partnership announcements.👍 Like & drop your targets below if you’re tracking JASMY. 🚀 Let’s see how this plays out!
Disclaimer
Any content and materials included in Sahmeto's website and official communication channels are a compilation of personal opinions and analyses and are not binding. They do not constitute any recommendation for buying, selling, entering or exiting the stock market and cryptocurrency market. Also, all news and analyses included in the website and channels are merely republished information from official and unofficial domestic and foreign sources, and it is obvious that users of the said content are responsible for following up and ensuring the authenticity and accuracy of the materials. Therefore, while disclaiming responsibility, it is declared that the responsibility for any decision-making, action, and potential profit and loss in the capital market and cryptocurrency market lies with the trader.