
Bro-of-Ced-Rich
@t_Bro-of-Ced-Rich

What symbols does the trader recommend buying?
Purchase History
پیام های تریدر
Filter
Bro-of-Ced-Rich
بیت کوین در آستانه سقوط؟ نشانههای هشداردهنده و هدف ۷۶ هزار دلاری!
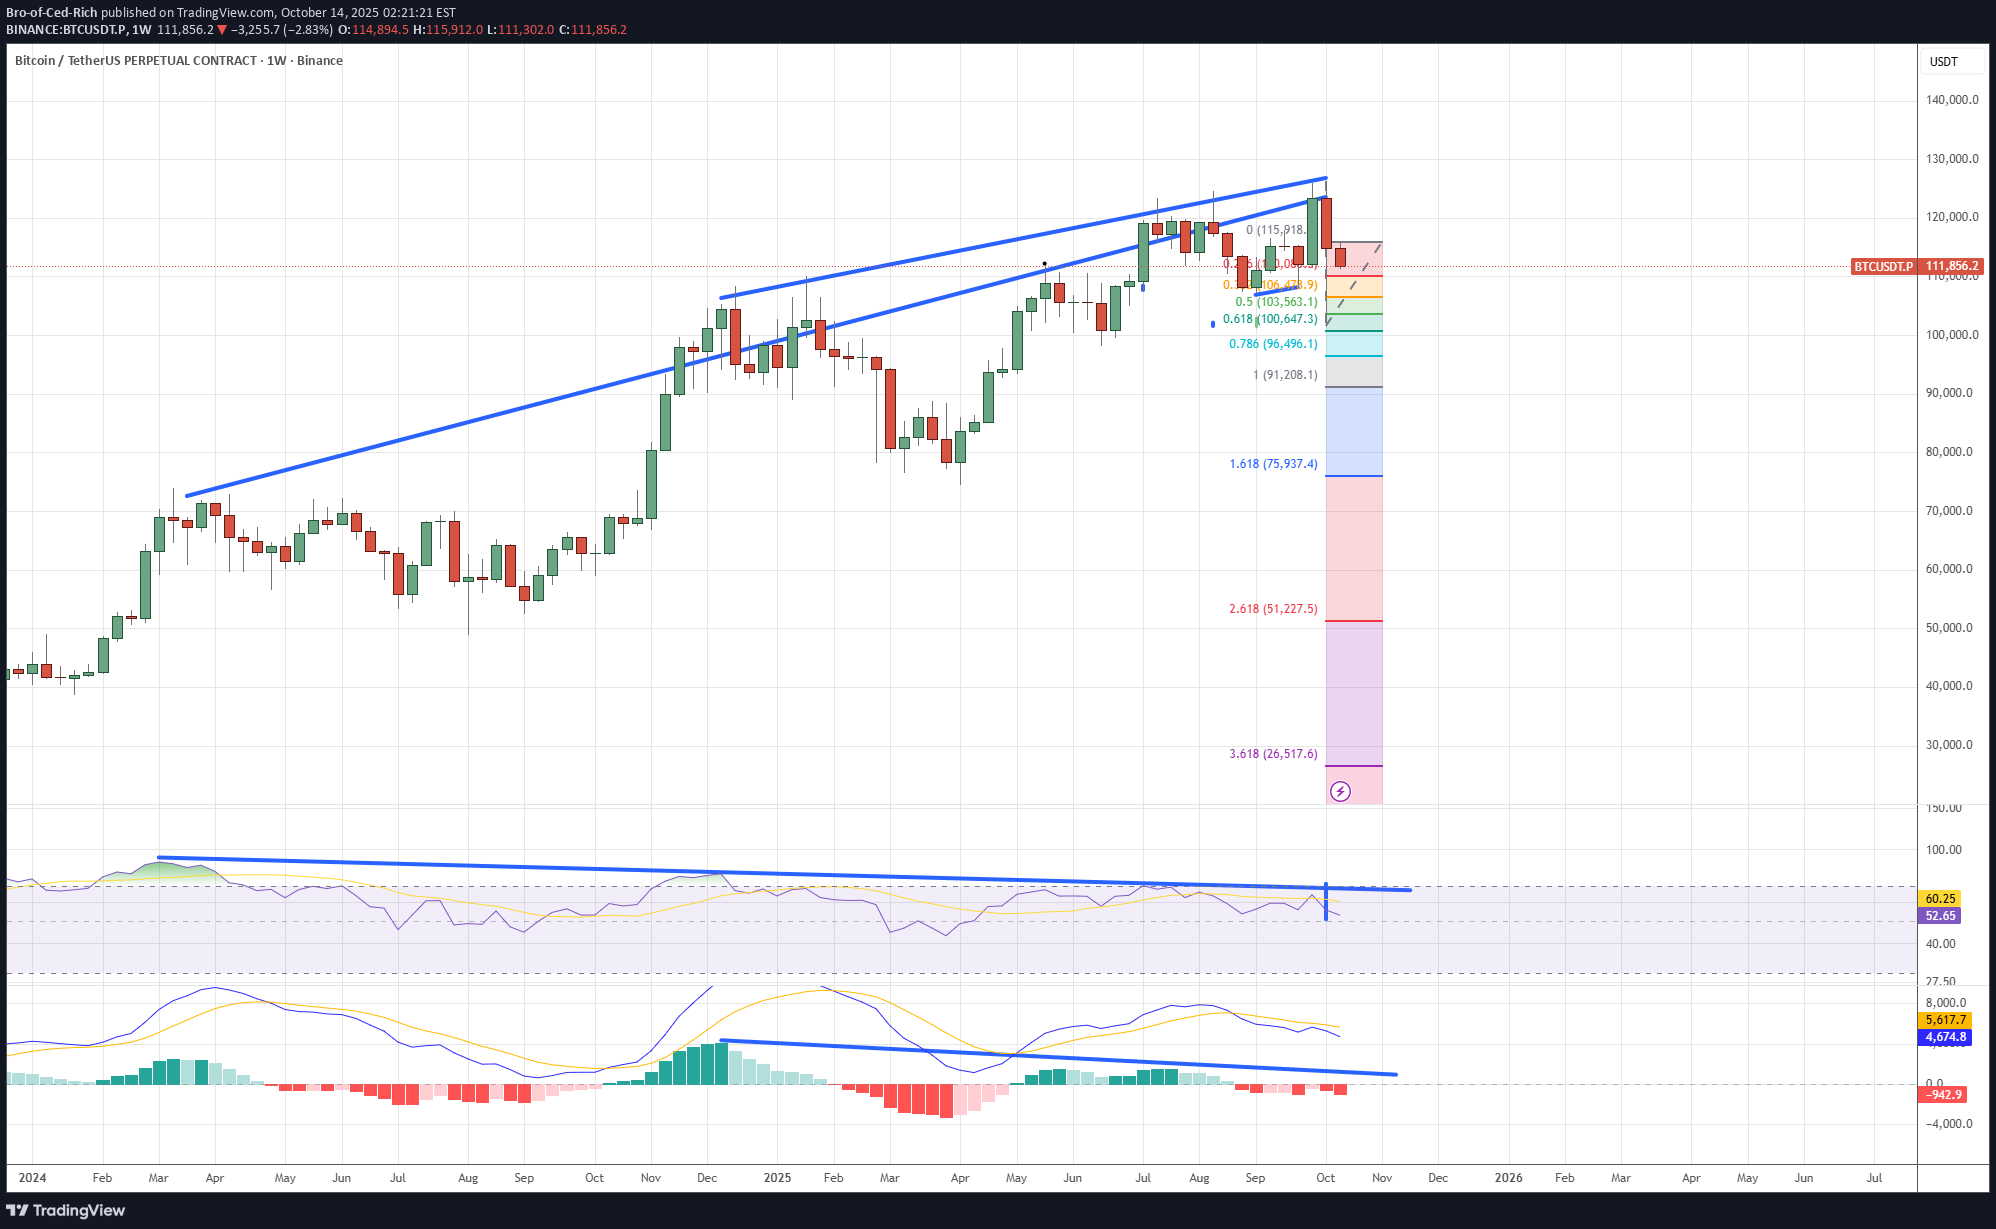
Bitcoin Showing Major Cracks — Divergences Are Screaming My Weekly Polynomial Average (113,700) has just been broken — a key structural shift. Next leg down towards the major Fibonacci extension (1.618) points toward a $76,900 target. Bitcoin’s bearish divergence has been running far too long — and history shows this kind of setup never ends quietly. RSI divergence: nearly 19 months MACD divergence: close to 10 months That’s a massive disconnect between price momentum and underlying strength. The market’s been grinding higher on fumes while the internals have been rolling over for more than a year. We’ve seen this before. In 2007, the S&P 500 ran an extended divergence for almost a year — price kept pushing higher while internals weakened. The result? The global financial crisis that followed soon after. Now, Bitcoin looks eerily similar — cracks forming beneath the surface while sentiment remains euphoric. When these long divergences finally resolve, the unwind tends to be fast and ugly. Caution here isn’t bearishness — it’s survival instinct.
Bro-of-Ced-Rich
Double Top Monthly Timeframe
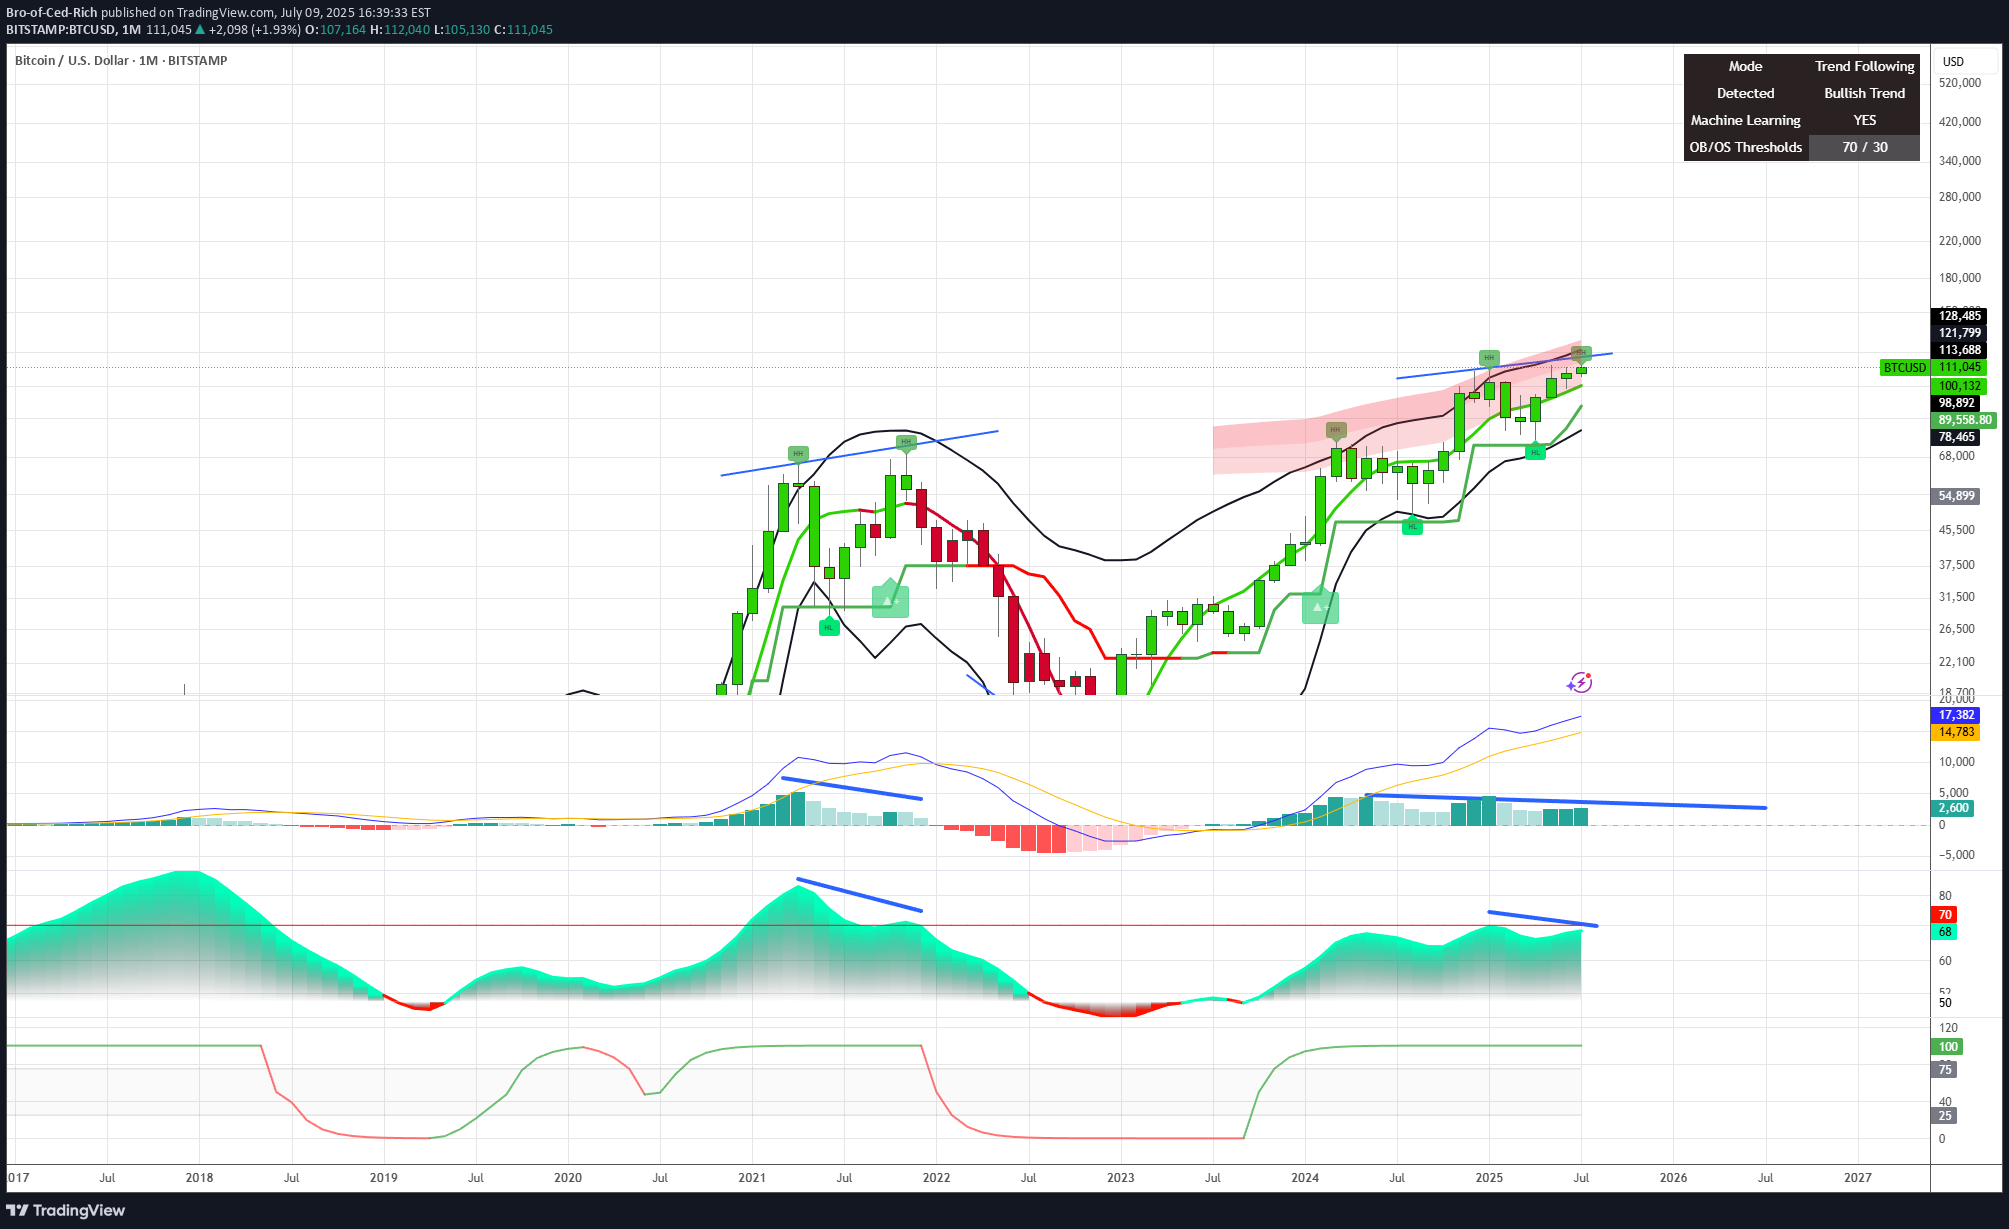
Bitcoin Monthly – Double Top + Bearish Divergence (MACD & RSI) | Bull Cycle Over? [/b Technical Breakdown: We're witnessing strong signals that the Bitcoin bull cycle could be over. Here's why: 1. Monthly Double Top Price has failed to break convincingly above the previous ATH 112k Two clear peaks on the monthly chart, forming a classic double top pattern. 2. Bearish Divergence – RSI & MACD MACD and RSI: Lower highs while price made equal/higher highs → Momentum weakening. Trend reversal likely - level to watch 89k breaking this bullish trend line level, bitty will be shifting to a bearish trend.. It's too early and too bold to short and call the top is in — you need to trust your chart. Bearish divergence confirmed Likely end of 2023-2025 bull cycle The permabulls won’t like this — but charts don’t bend to hopium
Bro-of-Ced-Rich
Bitcoin Facing Rejection Around the $86K Marker.

Based on Daily TF chart key level to watch is $84.5K. The Case of bulls and bears: If bulls fail to reclaim and hold above this 84.5K level, we could see a potential drop toward the $FWB:67K – 59K zone. Re-capturing 84.5k level pump target 88k to 99k level. What’s especially worth watching now is the MACD: Will it cross above the zero line, hinting at renewed bullish momentum, or will it roll below and confirm a stronger downtrend continuation? No predictions here — just sticking to the trend and watching price action unfold.
Bro-of-Ced-Rich
Is Bitcoin poised to reach the 48,000 mark

The market holds the potential to astonish everyone as it appears to be on the brink of a significant dive from its current position. #30k target or daily 200 moving average.. my indicator and macd is indicating time for reversal..
Bro-of-Ced-Rich
Btc Hidden Bearish Divergence

A hidden bearish divergence in Bitcoin trading chart suggests that the asset is likely to continue a downtrend. Divergence in trading refers to a situation where the price action of an asset is moving in the opposite direction of a technical indicators, such as the Stoch Relative Strength Index (RSI) and Moving Average Convergence Divergence (MACD). In a hidden bearish divergence, the price makes a lower high (which is less than the previous high), while the indicator makes a higher high. This is considered a sign of a potential continuation of a downtrend. In simpler terms, despite the indicator suggesting a strengthening market (with higher highs), the price action is not confirming this (with lower highs). This divergence can be a signal that the selling pressure is still present and that the downtrend may continue. However, it's important to note that while technical analysis tools like divergences can be useful, they are not foolproof and should be used in conjunction with other market analysis techniques and tools. next possible support 19.5k to 20.4k #shortbtc #BTC
Bro-of-Ced-Rich

Bro-of-Ced-Rich
btc going to drop box 12.6k - 9k

btc going to drop box 12.6k - 9k the hidden bearish divergence is a signal that there will be a downtrend continuation. daily negative divergence is a confirmation that uptrend is finished. price dropping below the 200ma of weekly is a sign price is moving towards the downside. a close below 23.3k the daily 200ma will confirm price will drop toward the previous low of 15.5k. most likely this 15.5k low will not hold and we will create a new lower low. a new lower low in price and a higher and high in oscillators, be it monthly chart, weekly chart and daily chart. this will give us a signal the start of real bullrun.. key level to note 23,3k 15.5k, 12.6k and 8.9k
Bro-of-Ced-Rich
short btc

daily rsi divergence and failure to hold the 200ema. bitty will drop to 15k to even 12ktrend will change once price will cross the daily 9ma.DYOR, this is just my personal trend analysis.
Bro-of-Ced-Rich
chiliz is hot

possible price will touch the 0.33 level first target, expect chz to go higher as the world cup is fast approaching.
Bro-of-Ced-Rich
long apee! 20usdt is full target

tracking apee, since the drop and we are observing some sideways movement on hourly, IMO could be the bottom. trading and holding apee from 5 to 20usdt. need a nerve of steel to avoid selling too early.stop loss at circa 4.9
Disclaimer
Any content and materials included in Sahmeto's website and official communication channels are a compilation of personal opinions and analyses and are not binding. They do not constitute any recommendation for buying, selling, entering or exiting the stock market and cryptocurrency market. Also, all news and analyses included in the website and channels are merely republished information from official and unofficial domestic and foreign sources, and it is obvious that users of the said content are responsible for following up and ensuring the authenticity and accuracy of the materials. Therefore, while disclaiming responsibility, it is declared that the responsibility for any decision-making, action, and potential profit and loss in the capital market and cryptocurrency market lies with the trader.