
BlueHatInvestor
@t_BlueHatInvestor

What symbols does the trader recommend buying?
Purchase History
پیام های تریدر
Filter
Signal Type
BlueHatInvestor

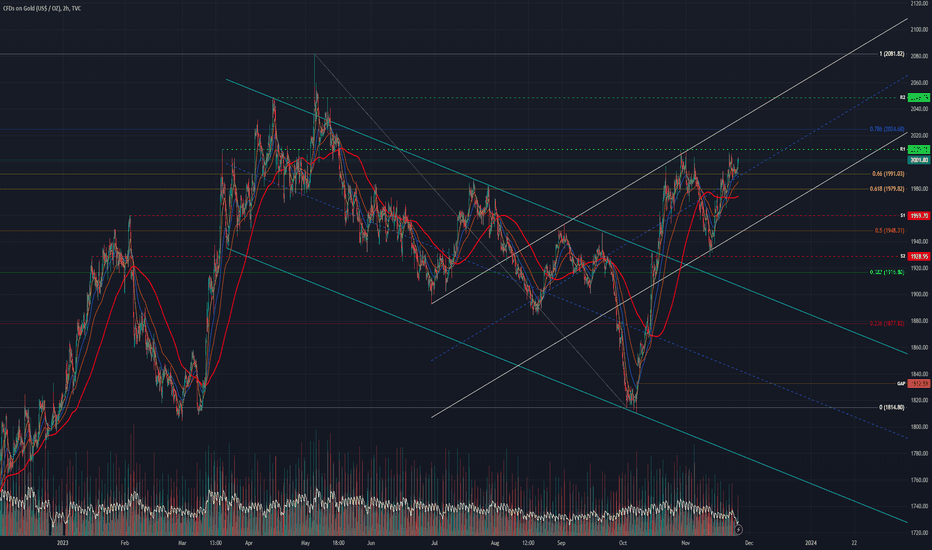
GOLD chart mapping/analysis. Gold's massive (algo-triggered) blow-off top killed the bullish momentum - pending further selling pressure if DXY/bond yields decide to rally into end of the year.. Trading scenarios into EOY: Selling pressure towards 50% Fib initial support zone. Bearish EOY capitulation target = Golden Pocket support zone. Expect any bullish reversal to be met with sellers, pending underlying relative strength in DXY/bond yields. 38.2% Fib / 200SMA confluence zone as potential target for short positioning, TBC.Gold chart update (Thurs 14/12): Price action held 50% Fib - ripper bounce post-FOMC to re-test ascending trend-line (green dashed). Initial consolidation range = ~2040 psych &/or upper range of parallel channel (light blue) / 38.2% Fib. Expect further strength in precious metals if US bond yields &/or DXY extend weakness into EOY.
BlueHatInvestor
GOLD chart mapping/analysis for last week of November. TBC further details/write-up via ideas section.
BlueHatInvestor

BTCUSD chart mapping/analysis for last week of November. TBC further details/write-up via ideas section.Bitcoin BTCUSD Write-up (29th Nov) BTC - what a beast. Price action continues to grind higher since rallying off lower range ascending parallel (white) back on 16th October. ~38000 playing key psychological level & failed to break-out twice, while middle parallel trend-line (dark blue dashed) acts as rising support + bullish flat-top pattern development. Punter consensus = anticipated ETF launch as catalyst for breakout towards upper range parallel (white)/50% Fib confluence zone...or could be a "Buy the News, Dump the Fact" event, TBC. We shall see.. DYOR.BTC rips higher, just short of tapping 50% Fib - now consolidating within tentative trading range ~42160 - ~41320.
BlueHatInvestor

Bitcoin BTCUSD ~ November TA Outlook (Daily Chart) BTCUSD chart mapping/analysis. Bitcoin continuing to march higher & higher after bouncing back in Nov-Dec 2022 off lower range of ascending parallel channel (light blue).
BlueHatInvestor

Gold / XAUUSD ~ Bearish H&S Dump / Emerging Asset Divergence GOLD undergoing Bearish H&S - clear break below neckline; trying to establish a base to reverse momentum & re-test support. Unusually strong selling off no immediate news - feels like possible "Sell The News/Buy The Fact" event ahead of US CPI release, TBC.. DXY - up/flat/within range US Treasuries (long-dated) - down/flat/within range Silver - down/flat/holding support Only Asset Class exhibiting similar volatility is Bitcoin, up over 4% (potential divergence with Gold, TBC). Bullish Support Confluences: - 38.2% fib retrace (~1903) - July 2022 trend-line (~1900) - Psychological level (~1900) - August 2023 lows / demand zone (~1885) Bearish H&S Extrapolation Targets: - Primary = gap fill (~1870) - Undershoot = psychological level / trend-line / August lows (~1900-1885) - Overshoot = 50% fib retrace (~1850) Wait for re-test/neckline rejection to confirm H&S pattern is in play...alternatively higher than usual implied volatility from macro-economic influences warrant risk mitigation (ie wait for the dust to settle) before entering a position.. Trade at your own risk! GC1! XAUUSD SILVER BTCUSD DXY DX1! US10Y US20Y US30Y
BlueHatInvestor

GOLD seizing on relativeness weakness from Bond Yields across the long-ended spectrum.While Bullish momentum is encouraging, a definitive close above ~1913 (61.8% Fib) will be transformational.Resurgence in Bonds will most likely pressure Gold back into downward trend towards Gap Fill/78.6% Fib, or further capitulation towards $1800 territory.Traders will be paying close attention to Jackson Hole Symposium.Note:- DXY has also been rallying while Gold shows relative strength - demonstrating that Bond Yields are indeed the underlying driving force, interesting.Boost/Follow appreciated, cheers :) XAUUSD GC1! GC2! US05Y US10Y US20Y US30Y
Disclaimer
Any content and materials included in Sahmeto's website and official communication channels are a compilation of personal opinions and analyses and are not binding. They do not constitute any recommendation for buying, selling, entering or exiting the stock market and cryptocurrency market. Also, all news and analyses included in the website and channels are merely republished information from official and unofficial domestic and foreign sources, and it is obvious that users of the said content are responsible for following up and ensuring the authenticity and accuracy of the materials. Therefore, while disclaiming responsibility, it is declared that the responsibility for any decision-making, action, and potential profit and loss in the capital market and cryptocurrency market lies with the trader.