
Bilge_Kagan_Bakircioglu
@t_Bilge_Kagan_Bakircioglu

What symbols does the trader recommend buying?
Purchase History
پیام های تریدر
Filter
Bilge_Kagan_Bakircioglu
تحلیل هفتگی آوالانچ (AVAX/USDT): سیگنال جذاب فنی اما یک نگرانی بزرگ!
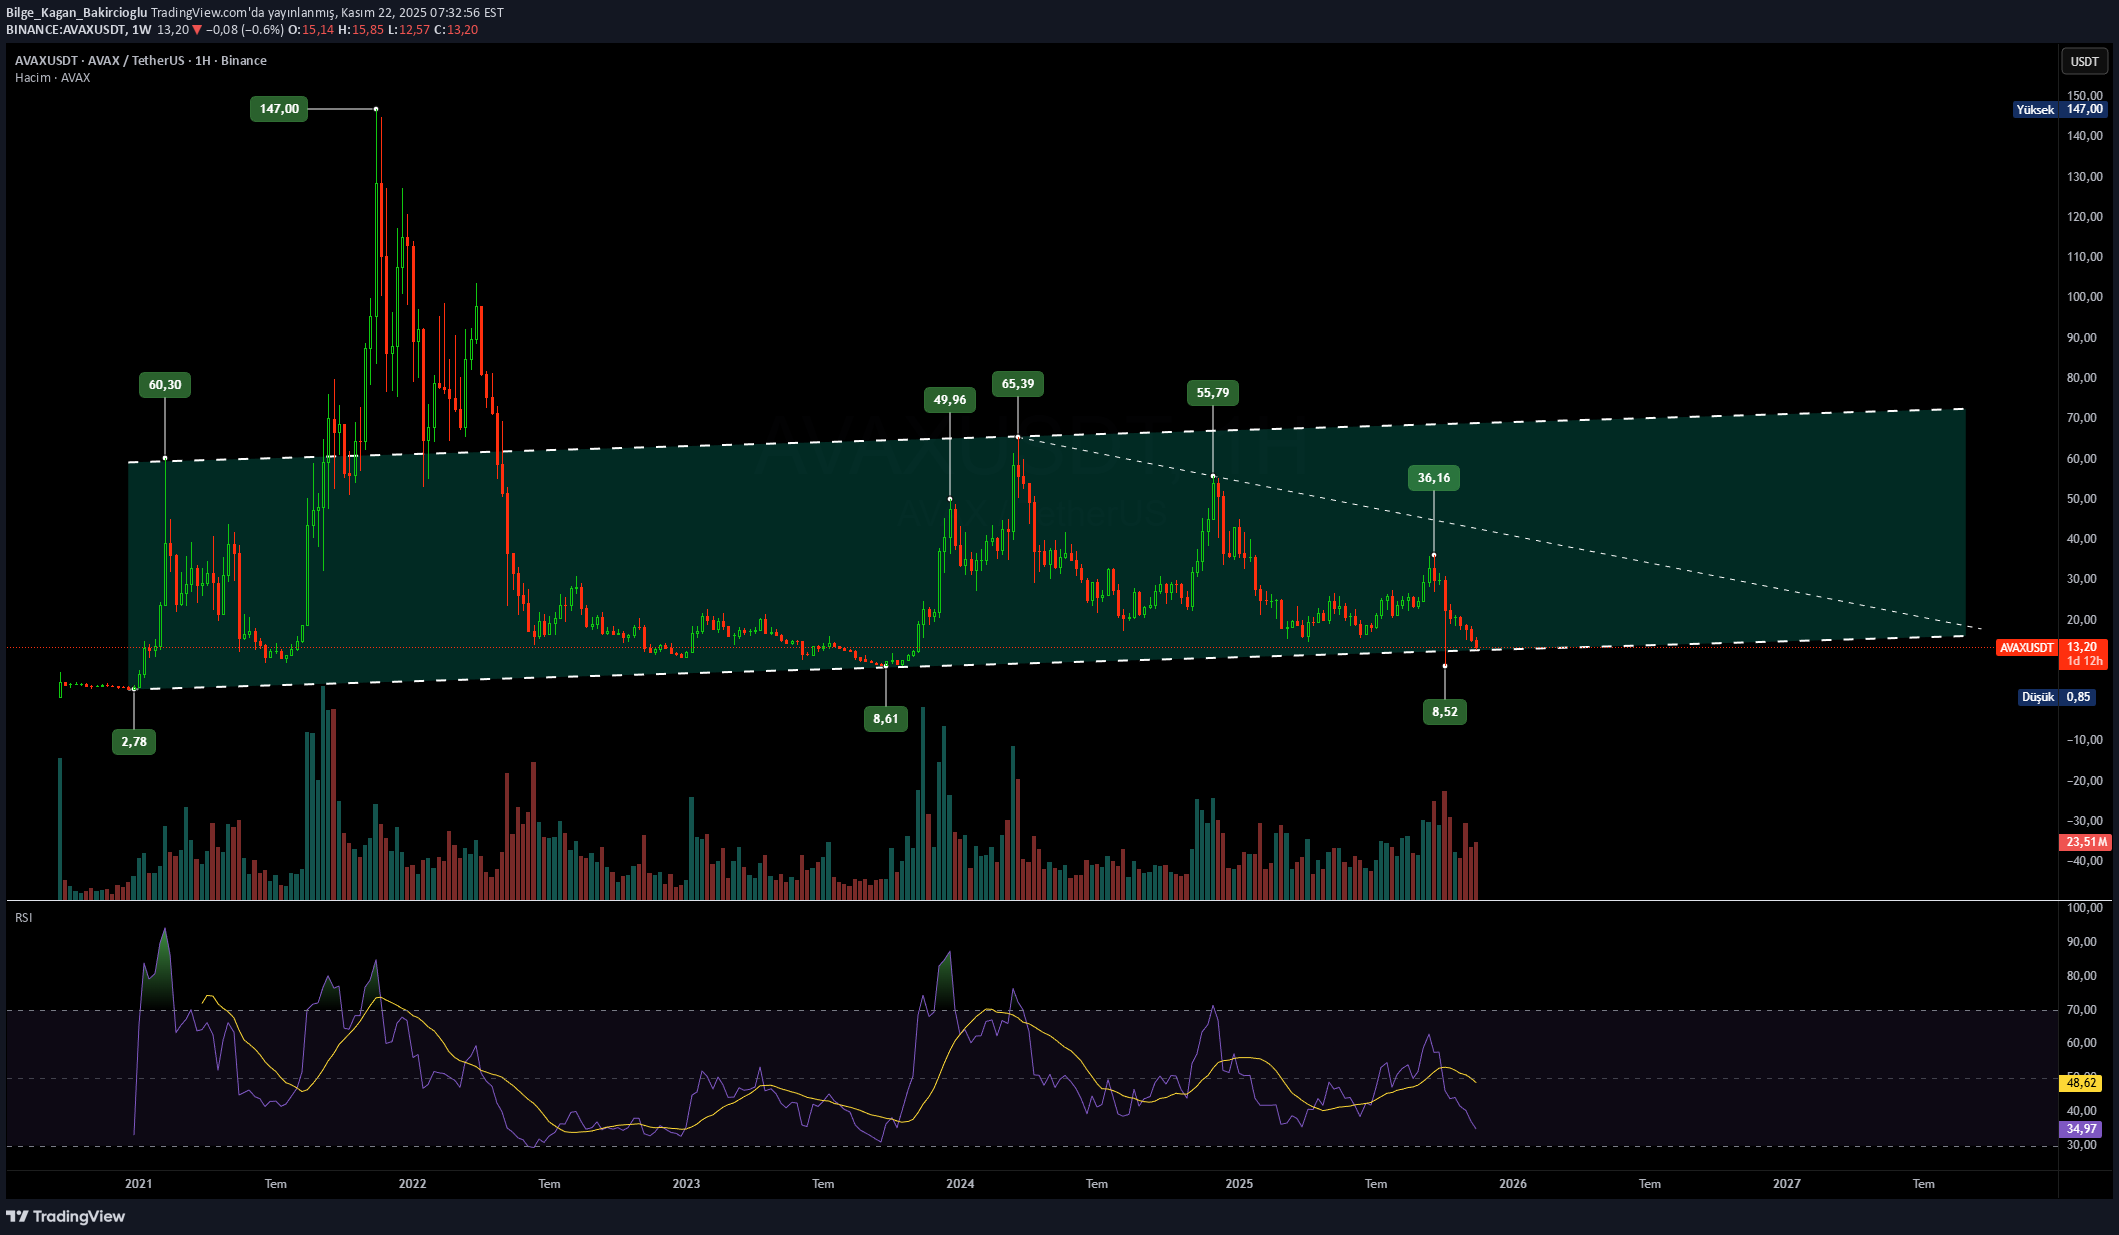
AVAXUSDT, WEEKLY CHART Technically it looks so good, but I wish it wasn't alt coin.
Bilge_Kagan_Bakircioglu
BTCUSD GRAFİĞİ
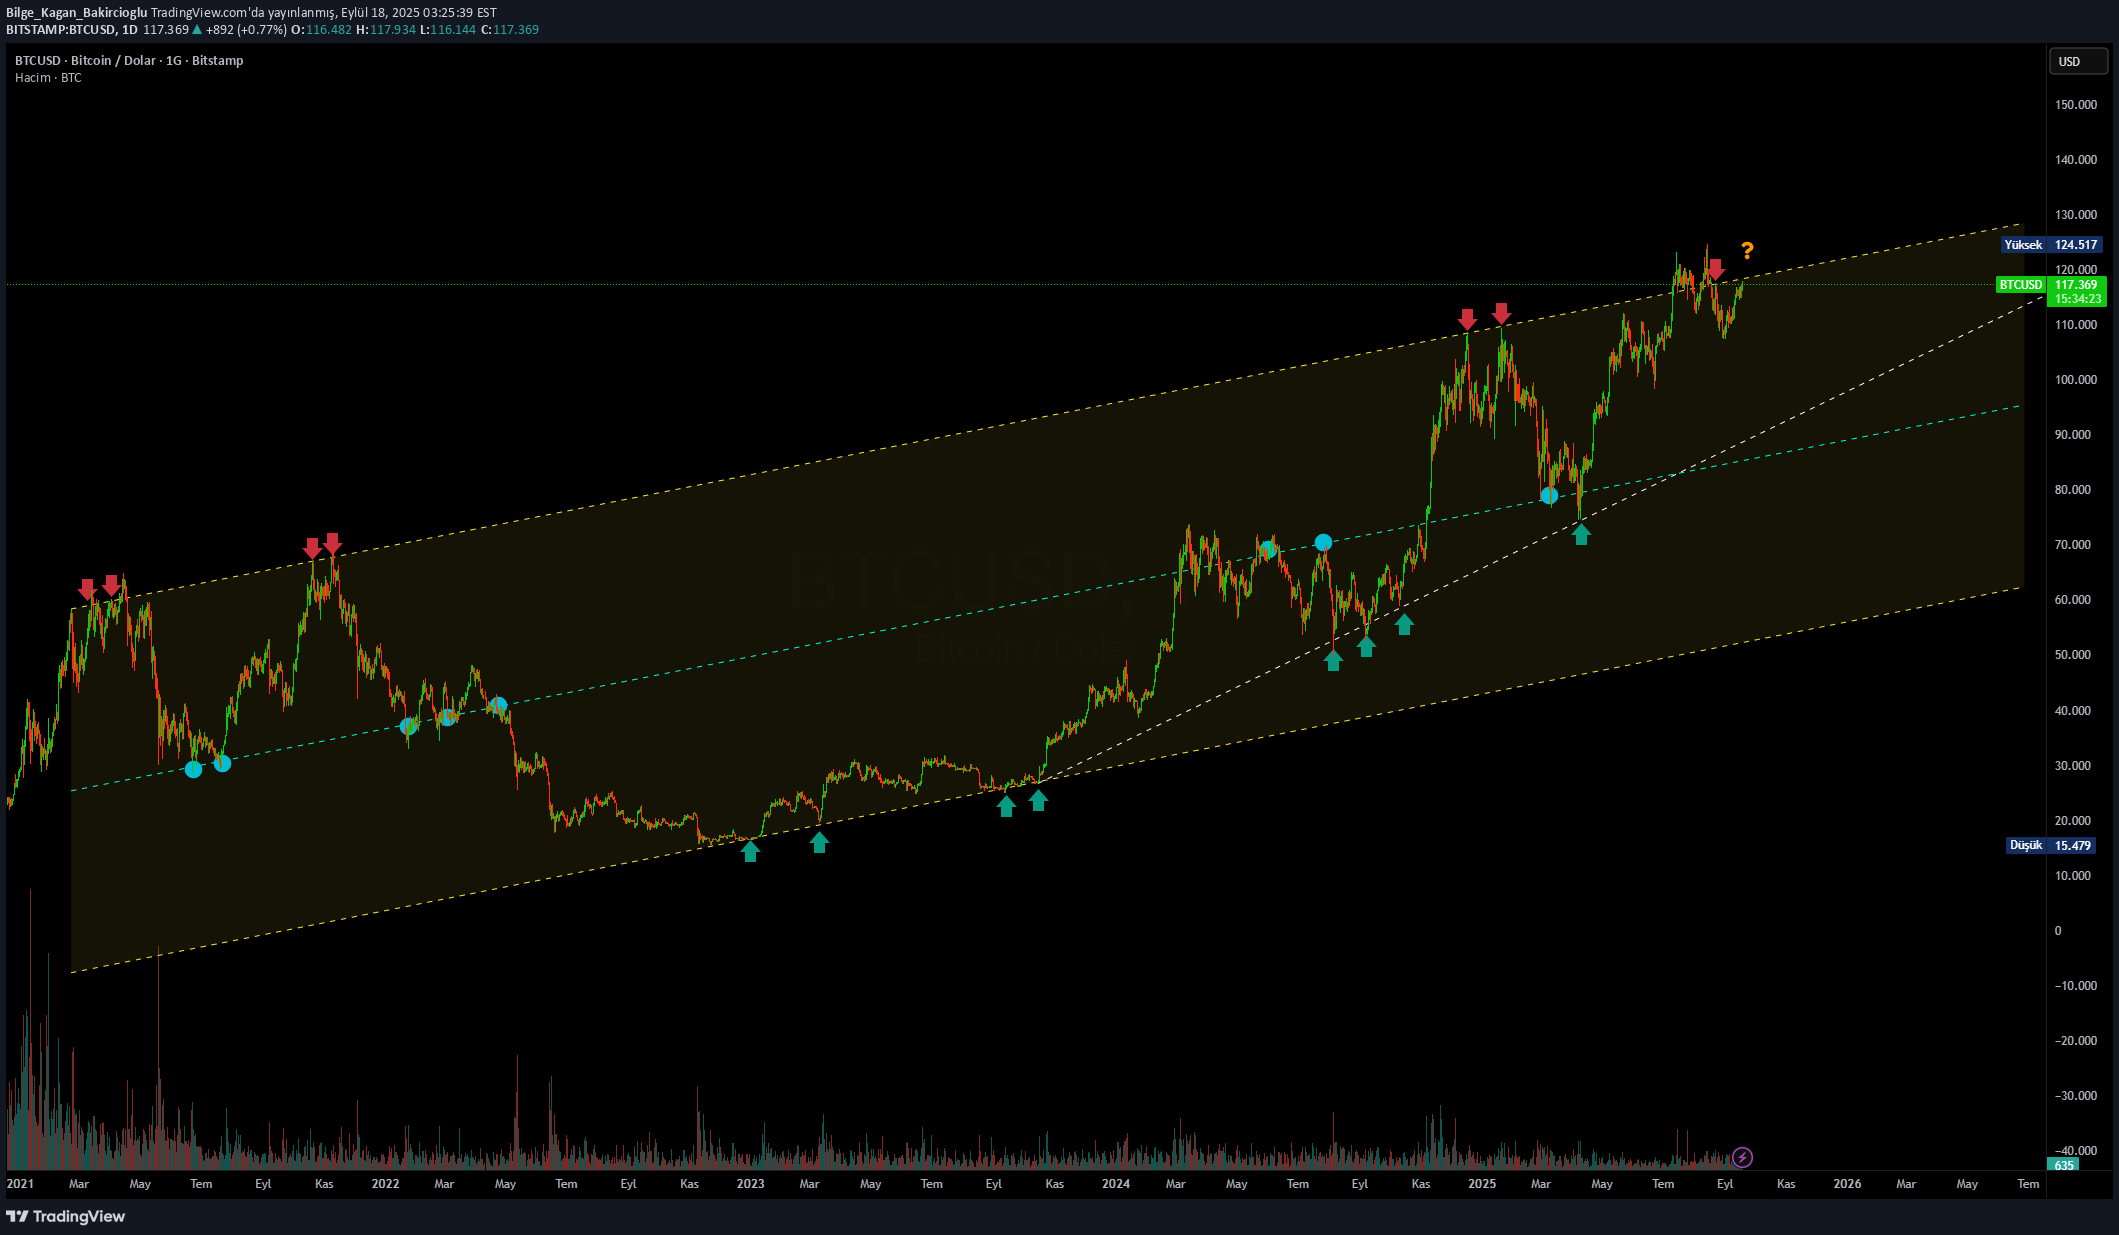
Bitcoin 2021 hills I have not been able to pass the trend line. This trend line is an important area for the future of BTC. Closing above the trend line brings new ATH s. The fact that it remains below the trend line indicates that I will descend to the support I have drawn below. Finally, the channel alt completes the decrease in the line.
Bilge_Kagan_Bakircioglu
SOL/USDT HAFTALIK GRAFİK
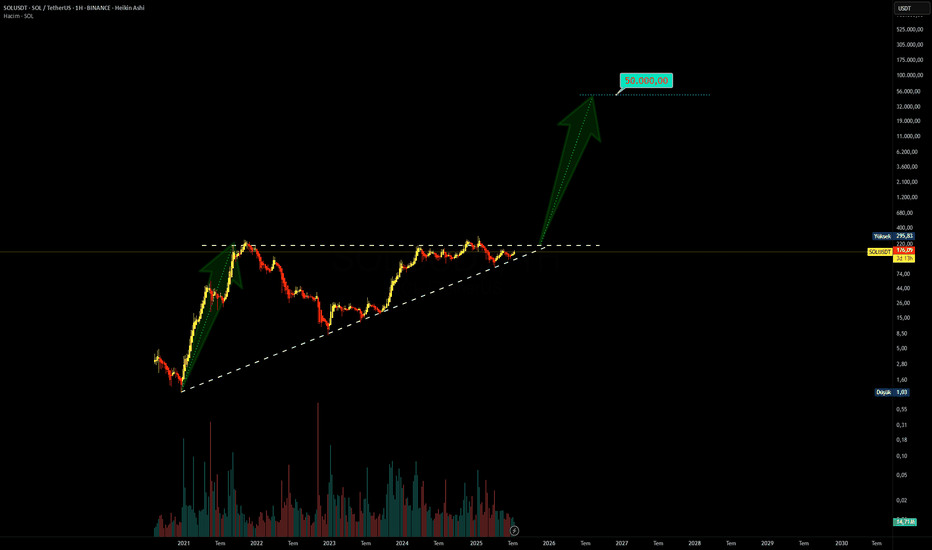
Isn't it even beautiful ($ 50,000)? It is not on the weekly logarithmic graph, but it is a graph that is certain to make many people happy.
Bilge_Kagan_Bakircioglu

Bilge_Kagan_Bakircioglu
BİTCOIN NE ZAMAN ALINMALI, NE ZAMAN SATILMALI

If you don't know when to buy and when to sell BTCUSD Bitcoin, this chart is for you. You will wait patiently and start buying bit by bit when it reaches the buy zone, and start selling bit by bit when it reaches the sell zone.
Bilge_Kagan_Bakircioglu
ARBUSDT

ARBUSDT I tried to show possible target prices for Arb coin.
Bilge_Kagan_Bakircioglu
KAVAUSDT

KAVAUSDT: I tried to show possible support and resistance points that may occur in the KAVAUSDT Price.
Bilge_Kagan_Bakircioglu
FILUSDT

FILUSDT I tried to show #filusdt possible formations, support and resistance prices on the chart. Let's watch together as the price reaches the target prices.
Bilge_Kagan_Bakircioglu
XAUUSD / ONS ALTIN

This is a post I made for the history and future monitoring of the ONS Gold price.
Bilge_Kagan_Bakircioglu
LTCUSDT HAFTALIK

LTCUSDT CHART: LTC rose to prices of $370.66 in 2017 and $413.00 in 2021. I assume that in 2024 it will rise to the prices of 2017 and 2021. While making this output, I tried to show possible support and resistance prices on the chart. I also showed the possible price targets on the chart in case it exceeds the $413.00 price it reached in 2017 and 2021.
Disclaimer
Any content and materials included in Sahmeto's website and official communication channels are a compilation of personal opinions and analyses and are not binding. They do not constitute any recommendation for buying, selling, entering or exiting the stock market and cryptocurrency market. Also, all news and analyses included in the website and channels are merely republished information from official and unofficial domestic and foreign sources, and it is obvious that users of the said content are responsible for following up and ensuring the authenticity and accuracy of the materials. Therefore, while disclaiming responsibility, it is declared that the responsibility for any decision-making, action, and potential profit and loss in the capital market and cryptocurrency market lies with the trader.