
Babenski
@t_Babenski

What symbols does the trader recommend buying?
Purchase History
پیام های تریدر
Filter
Babenski
تحلیل هفتگی بیت کوین: سطح حیاتی "همه یا هیچ"؛ آیا خرسها پیروز میشوند؟
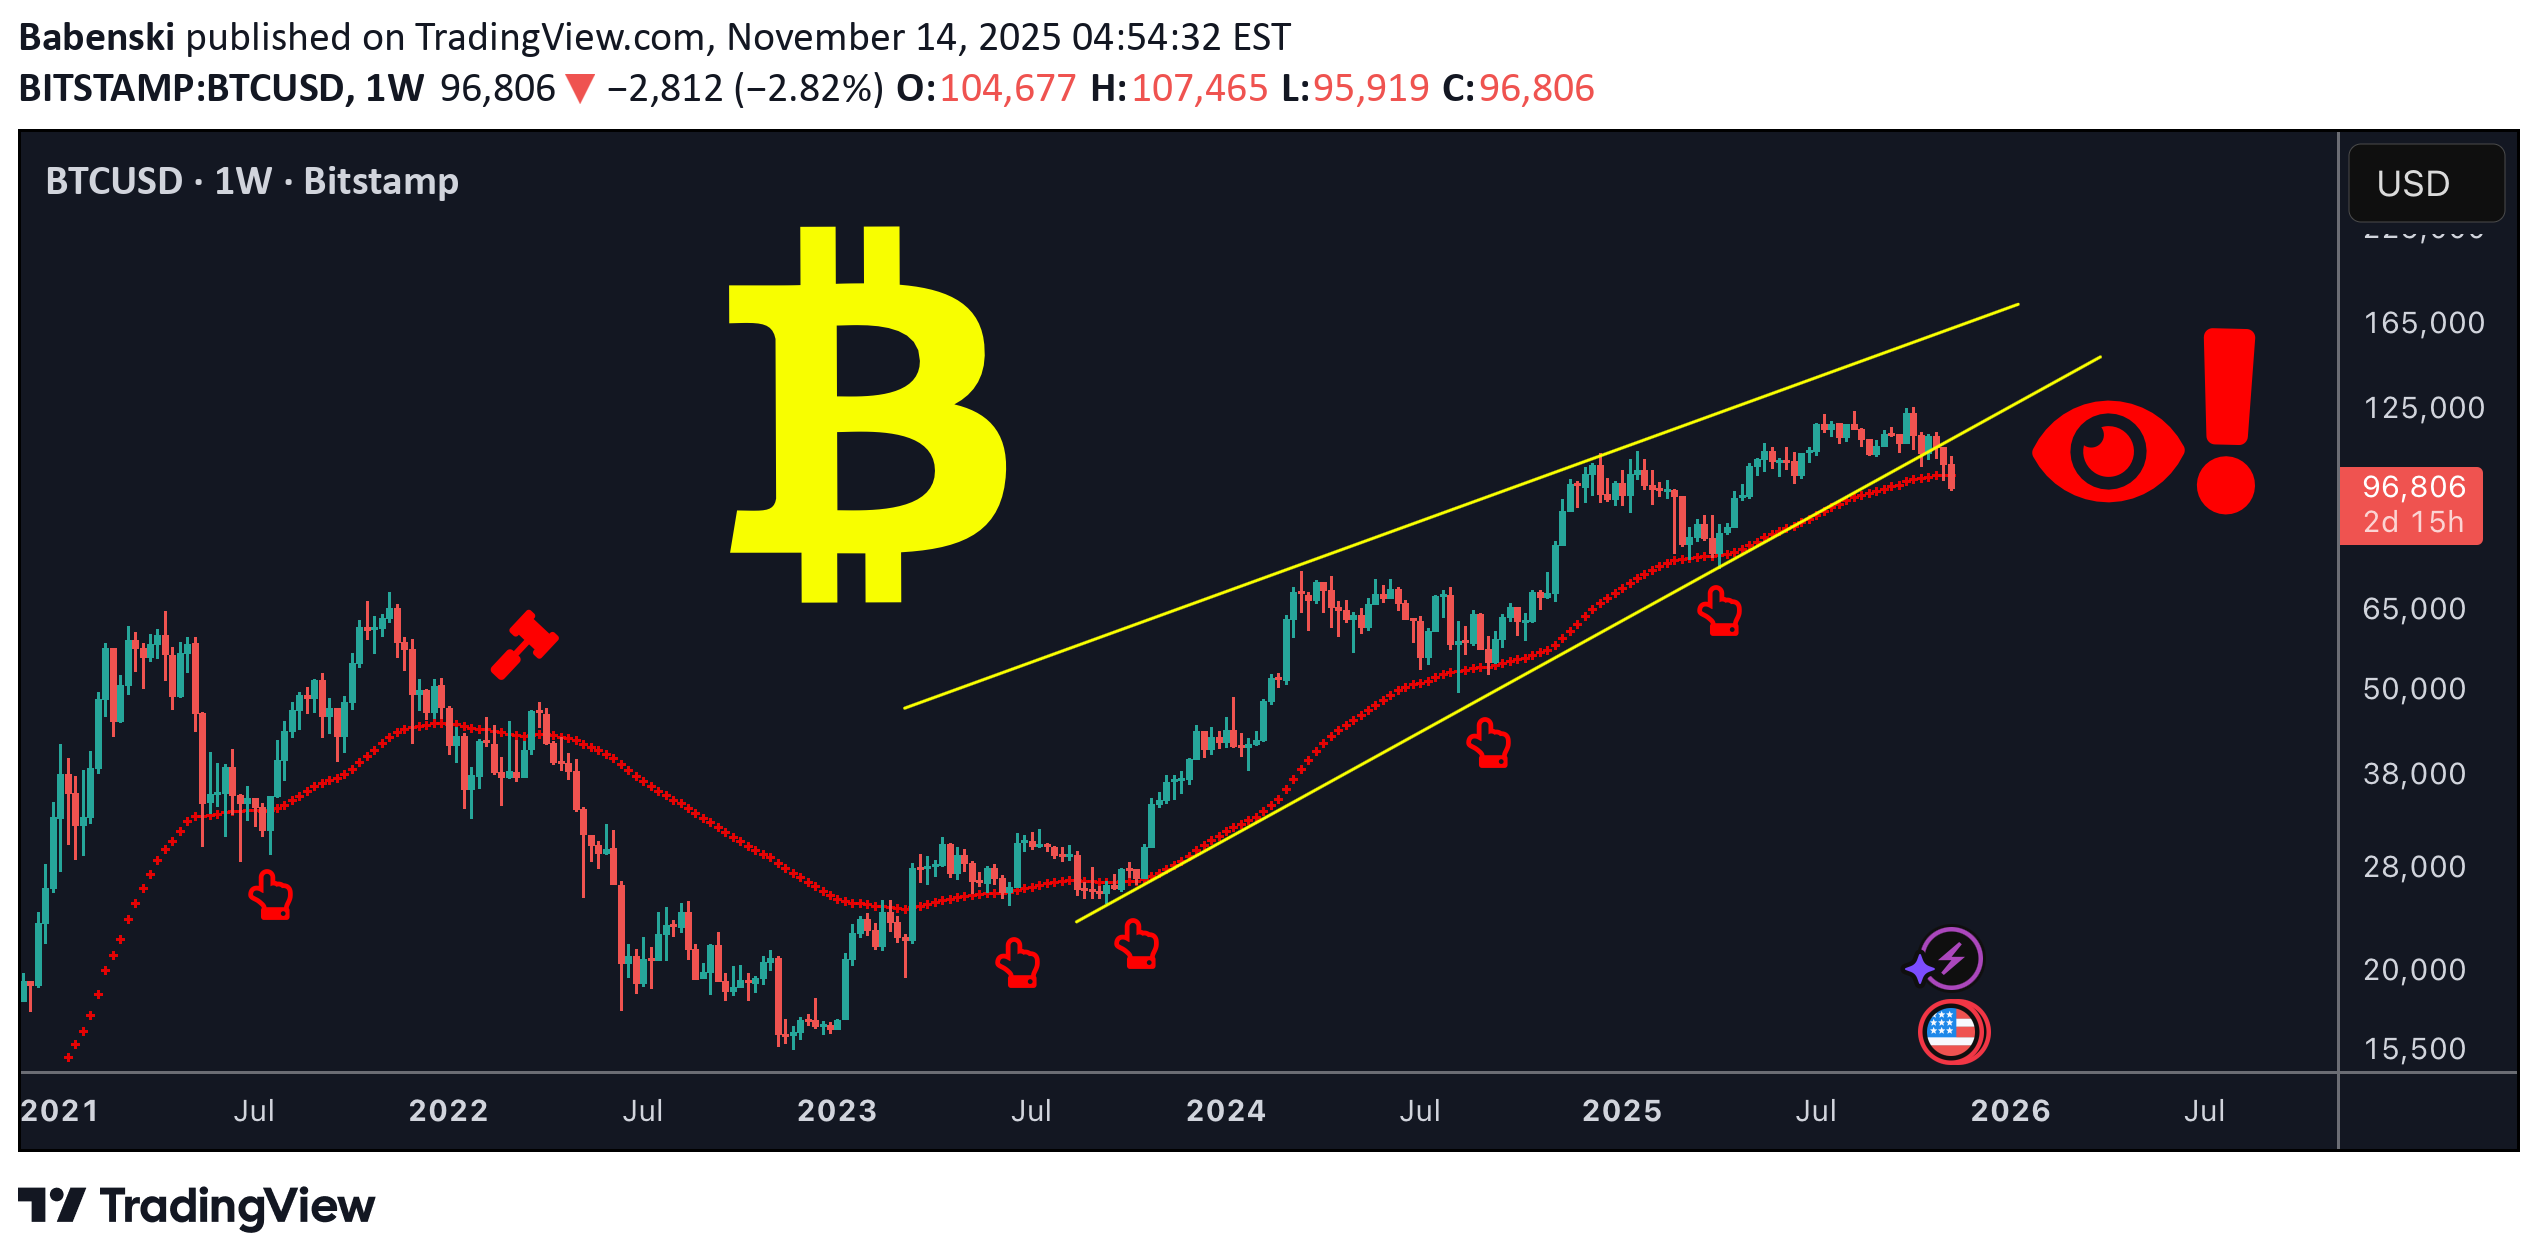
BTC / USD Bitcoin (BTC) followed my previous analysis on October 30th, dropping from $110,000 to its current price of $96,000. check here What's Next? Take a Look at the weekly chart: Bitcoin is currently at a "do or die" support level (trend line + 50-week moving average). This moving average has been a turning point in previous cycles. If the price breaks below this level, it will confirm a mid-term bear trend with minimal target around 74k so keep an eye on this chart.All eyes on current level .. Price action here will determine the market's path in the medium termBTC fells below 90k … stay tuned for more updates
Babenski
آیا NEAR بالاخره مقاومت را میشکند؟ راز حرکت بزرگ بعدی در اینجاست!
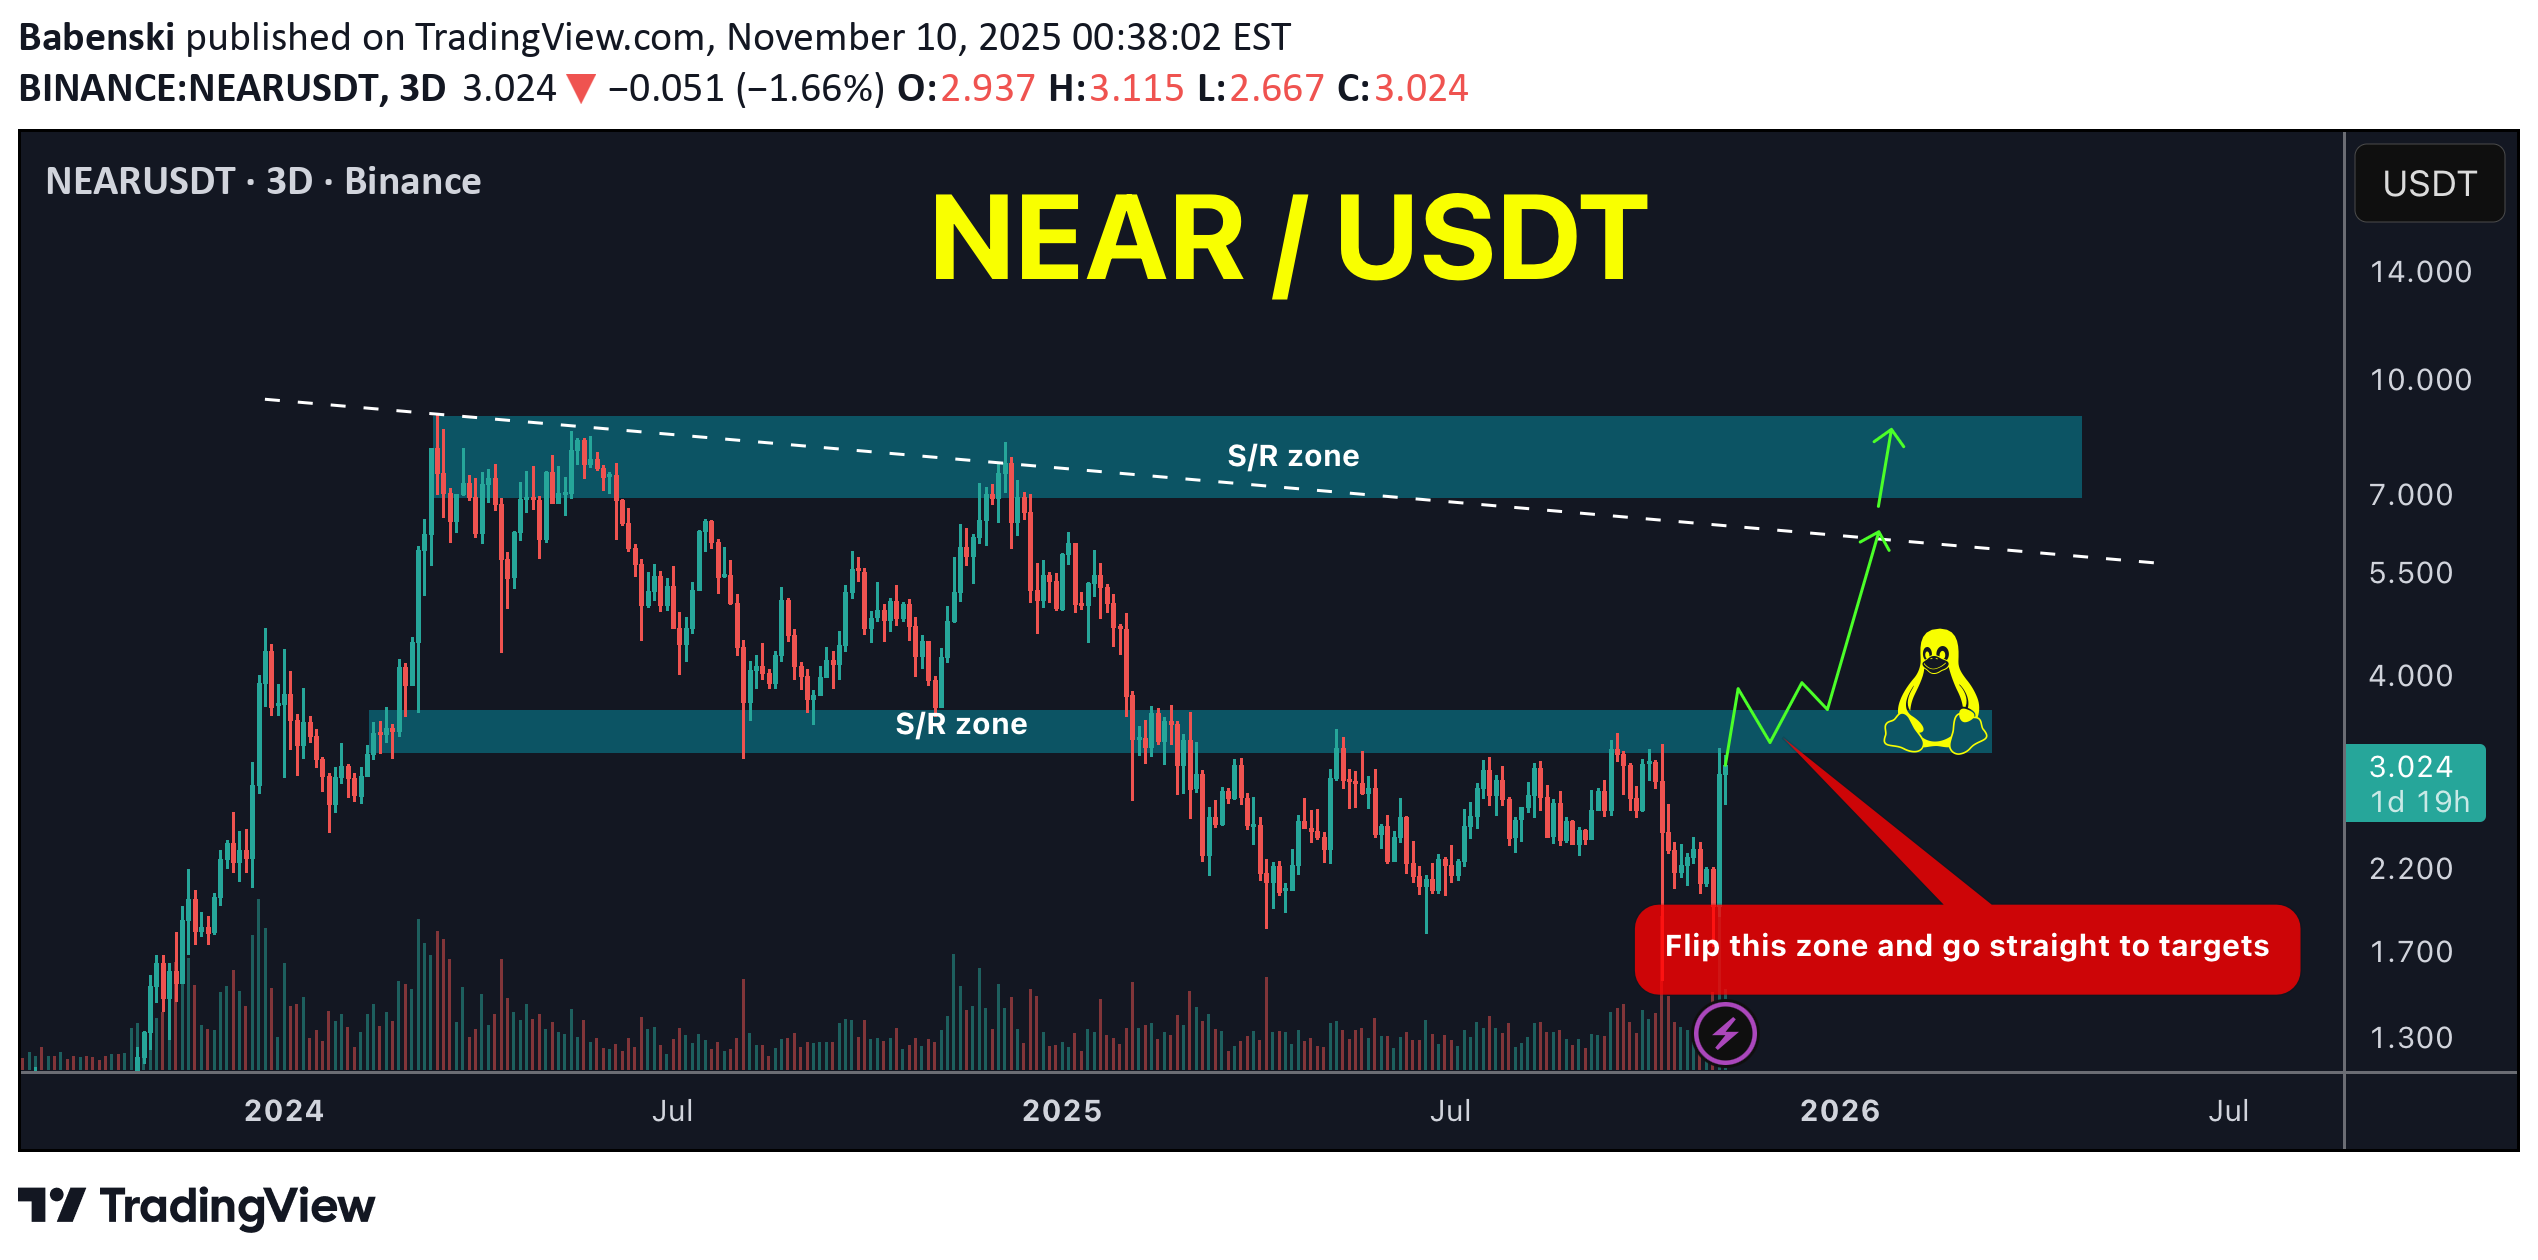
#NEAR / USDT NEAR is trying to breakout resistance area with strong volume … once we got valid breakout and stability above the first R/S we go straight to next one in my chart For the best approach Keep your eye on resistance area and monitor price action Best of wishes
Babenski
هشدار: آلتکوین مرده زنده شد! آیا ICP آماده انفجار قیمت است؟
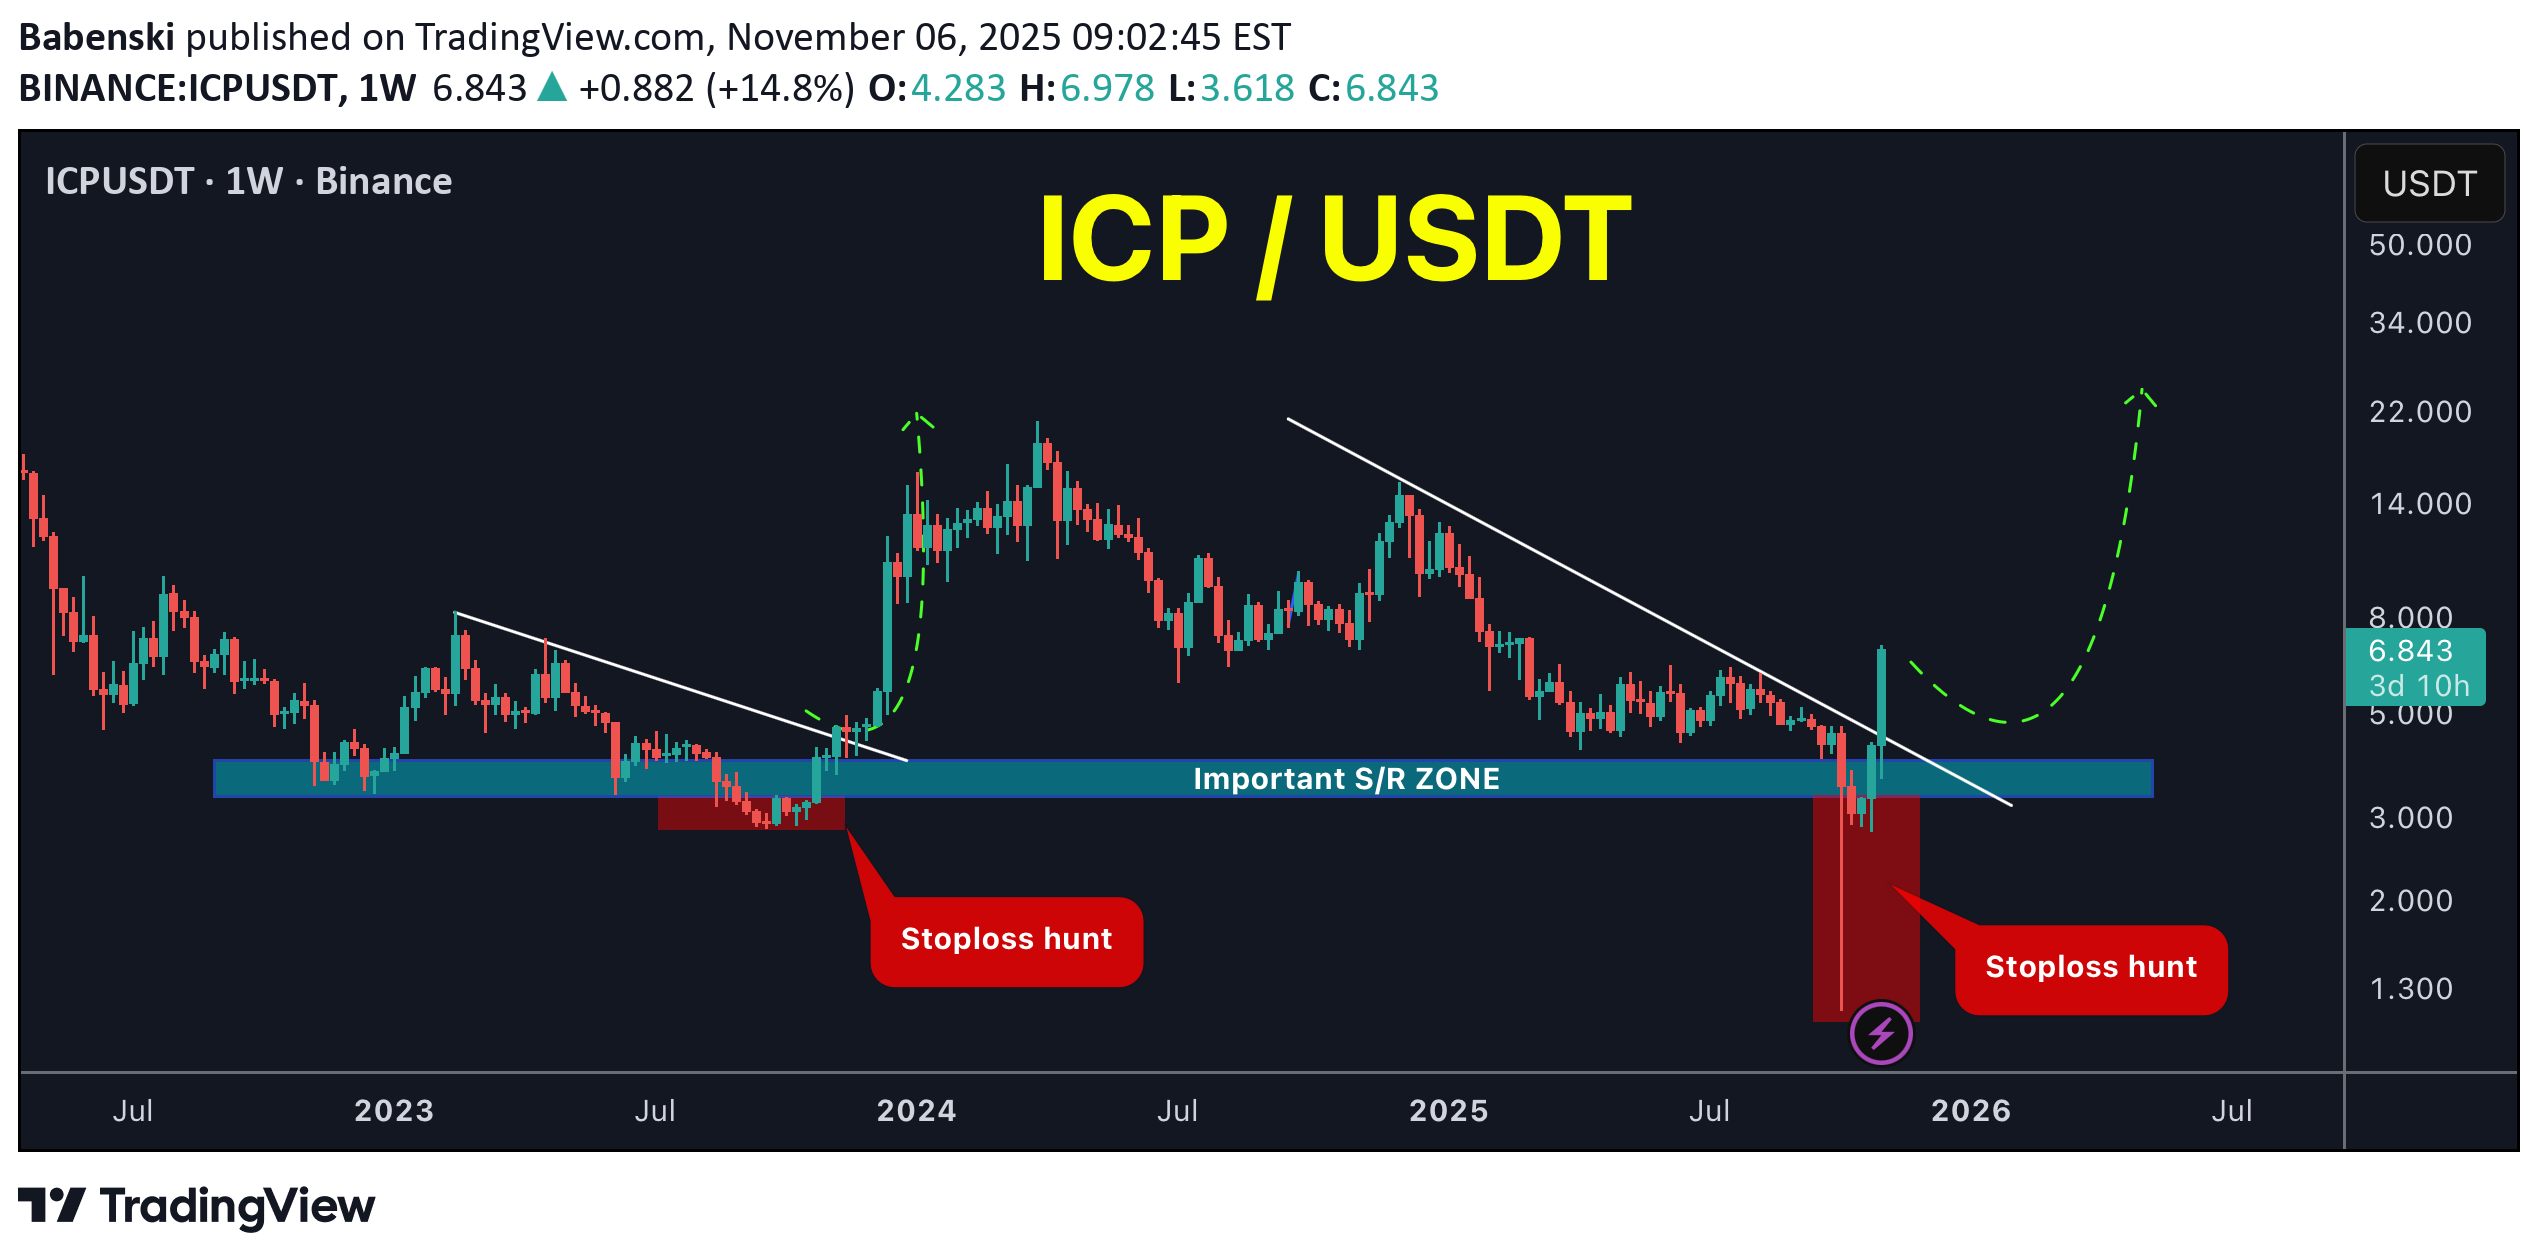
#ICP / USDT After being useless for several months this coin made a similar movements like the one in late 2023 Price dropped below the most important S/R zone in chart taking the liquidity and after that massive volume started to enter the coin Such movement in late 2023 ends up in X5 increase in its price in next months (after restoring the S/R)… price can make the similar movement here … ICP is waking up from the dead !BOOOOM!
Babenski
تحلیل بیت کوین ۳۰ اکتبر: هشدار! الگوی نزولی "گُوِه صعودی" و سقوط احتمالی تا مرز ۸۹ هزار دلار
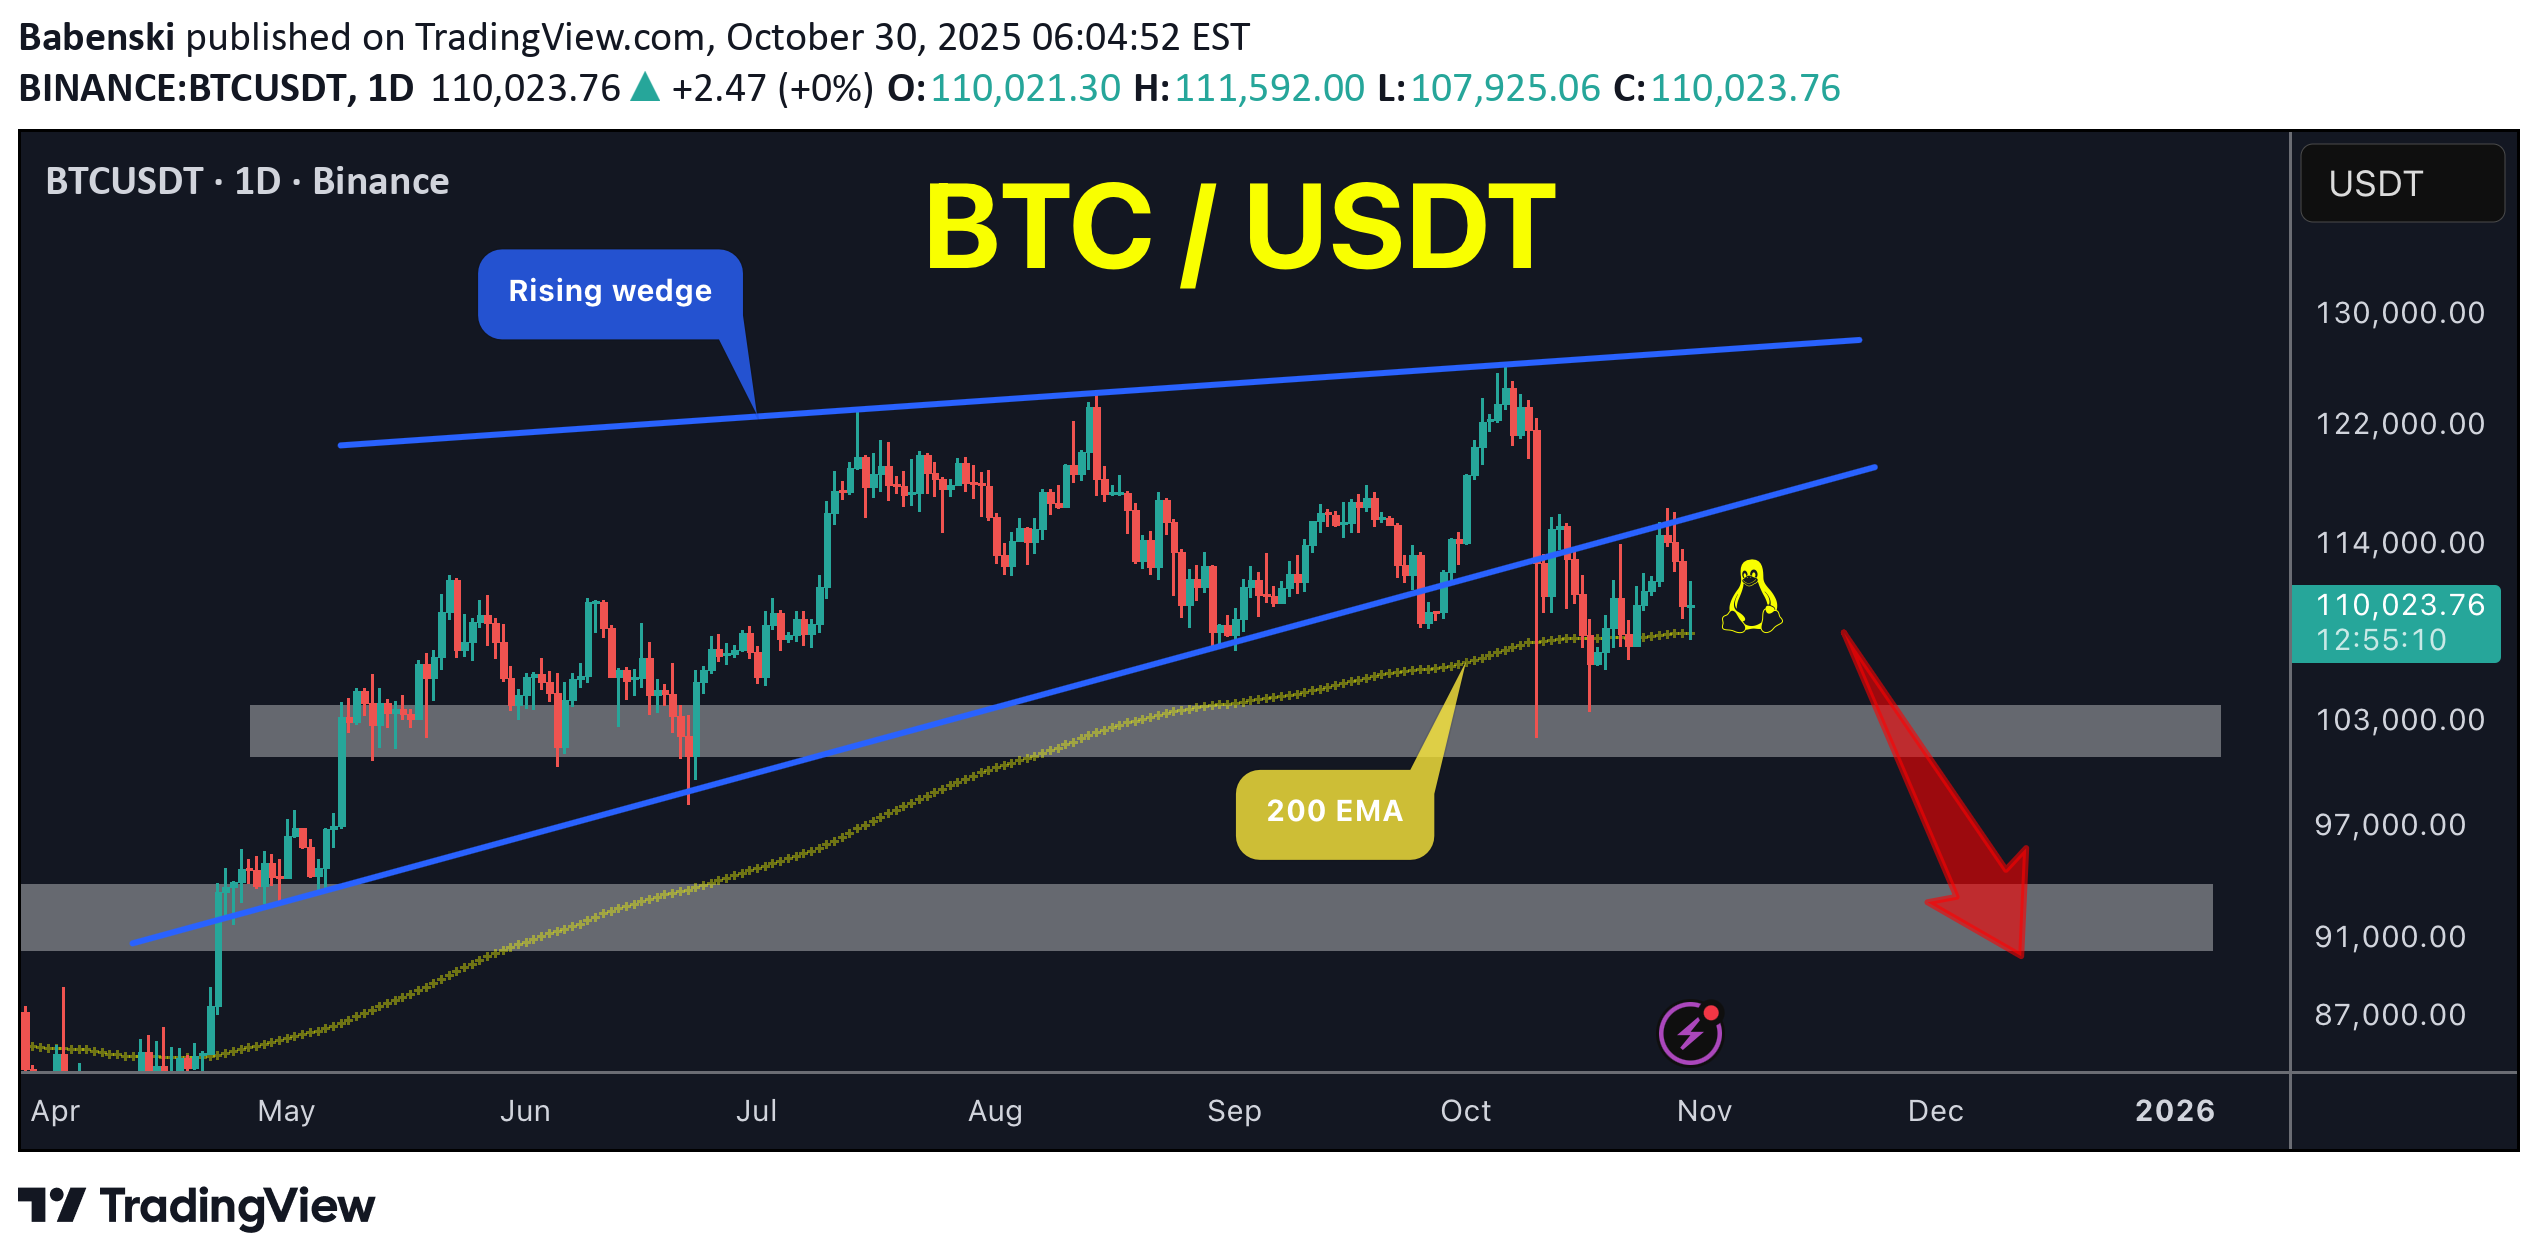
BTC / USDT Bitcoin is forming a massive ascending wedge pattern, a bearish pattern currently undergoing a bearish retest. The 200-day EMA is a significant support level and has been tested multiple times in the past few weeks. The more it is retested, the weaker the support becomes. The sharp drop on October 10th impacted the market's direction. Bearish targets for this scenario: First support: 103,000 - 100,000 Major support: 94,000 - 89,000 Summary: The market is currently bearish, and we can revise our analysis if Bitcoin manages to stabilize above 117,000.First area reached BTC hit 103kheavy dump started and BTC hit 99k and soon the major support … stay tuned for next update
Babenski
شروع بازار خرسی پنگو؟ این سطح کلیدی را از دست داد!
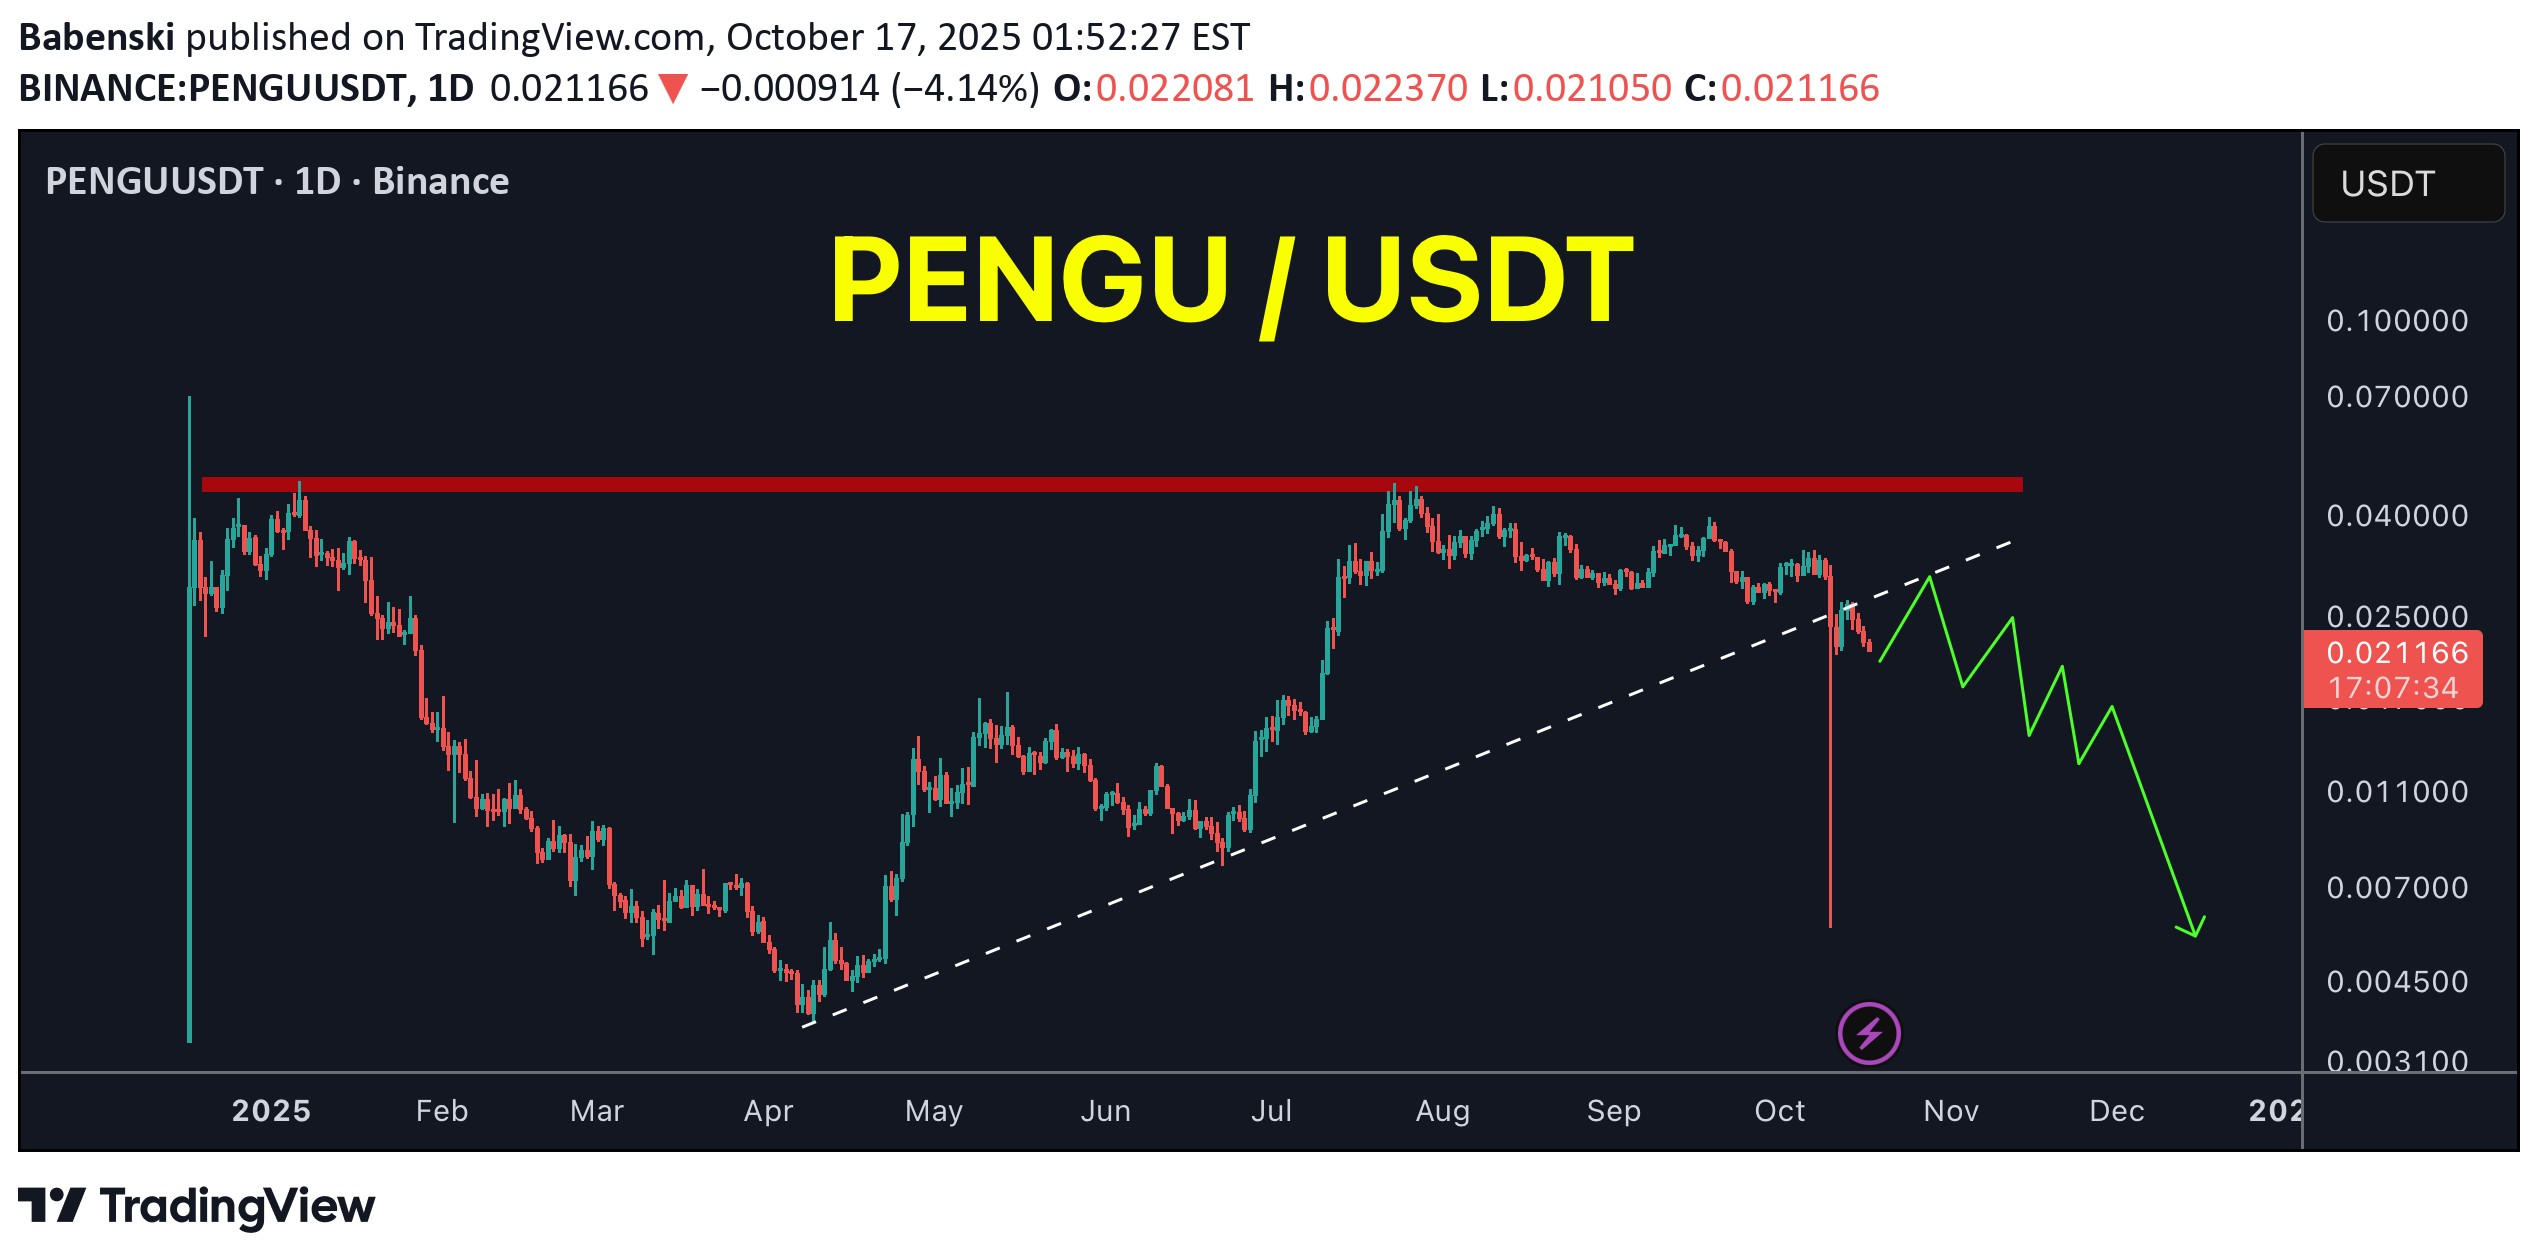
#PENGU / USDT Price lost 6 months uptrend line which is breakdown bullish structure As result this could be just the beginning of bearish market for it in the coming weeks Invalidation: price will turn bullish if ONLY able to breakout and hold above red zone marked in my chart Note : price wont drop as straight line it moves like wavesBear market started for it as expected
Babenski
Babenski
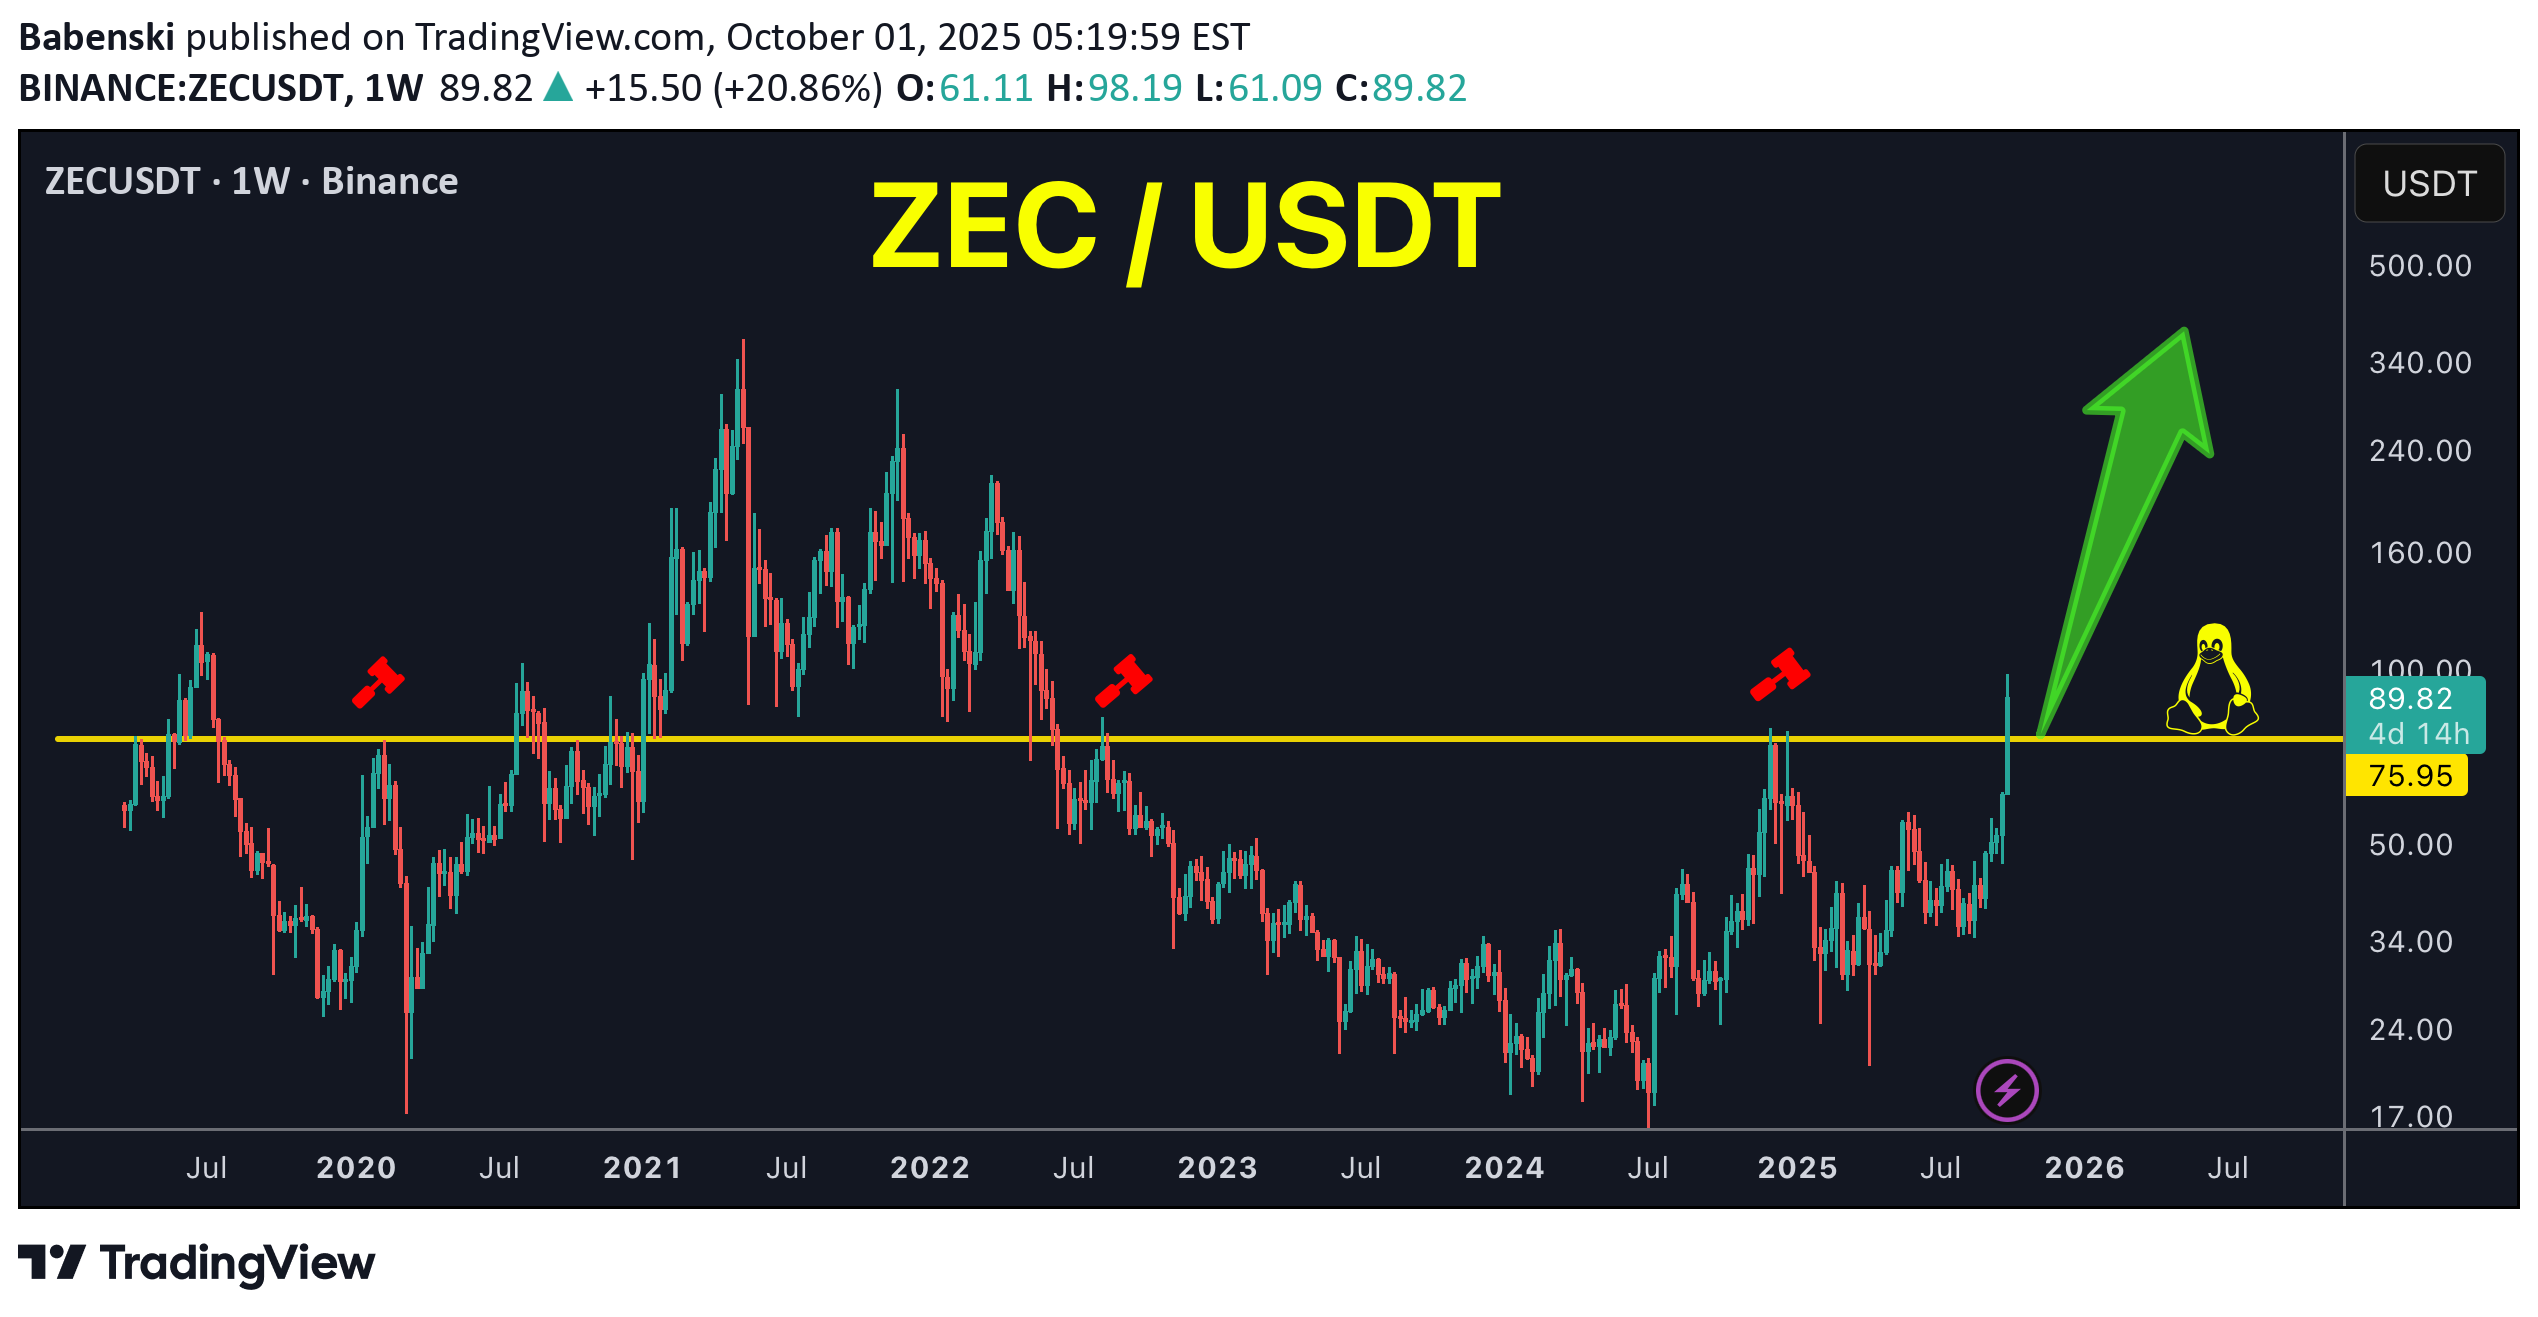
شکست تاریخی ZEC: ورود به فاز صعودی پس از سالها مقاومت!

ZEC / USDT Price broke multi-years resistance line (2024/2022/2020) which is a huge breakout for this coin ! Simple thing , Holding above = bullish Invalidation: candle close below it
Babenski
شکست تاریخی قیمت ZEC: آیا دوران صعودی جدید آغاز شده است؟

ZEC / USDT Price broke multi-years resistance line (2024/2022/2020) which is a huge breakout for this coin ! Simple thing , Holding above = bullish Invalidation: candle close below it
Babenski
Babenski
OG more than 4 years of accumulation!
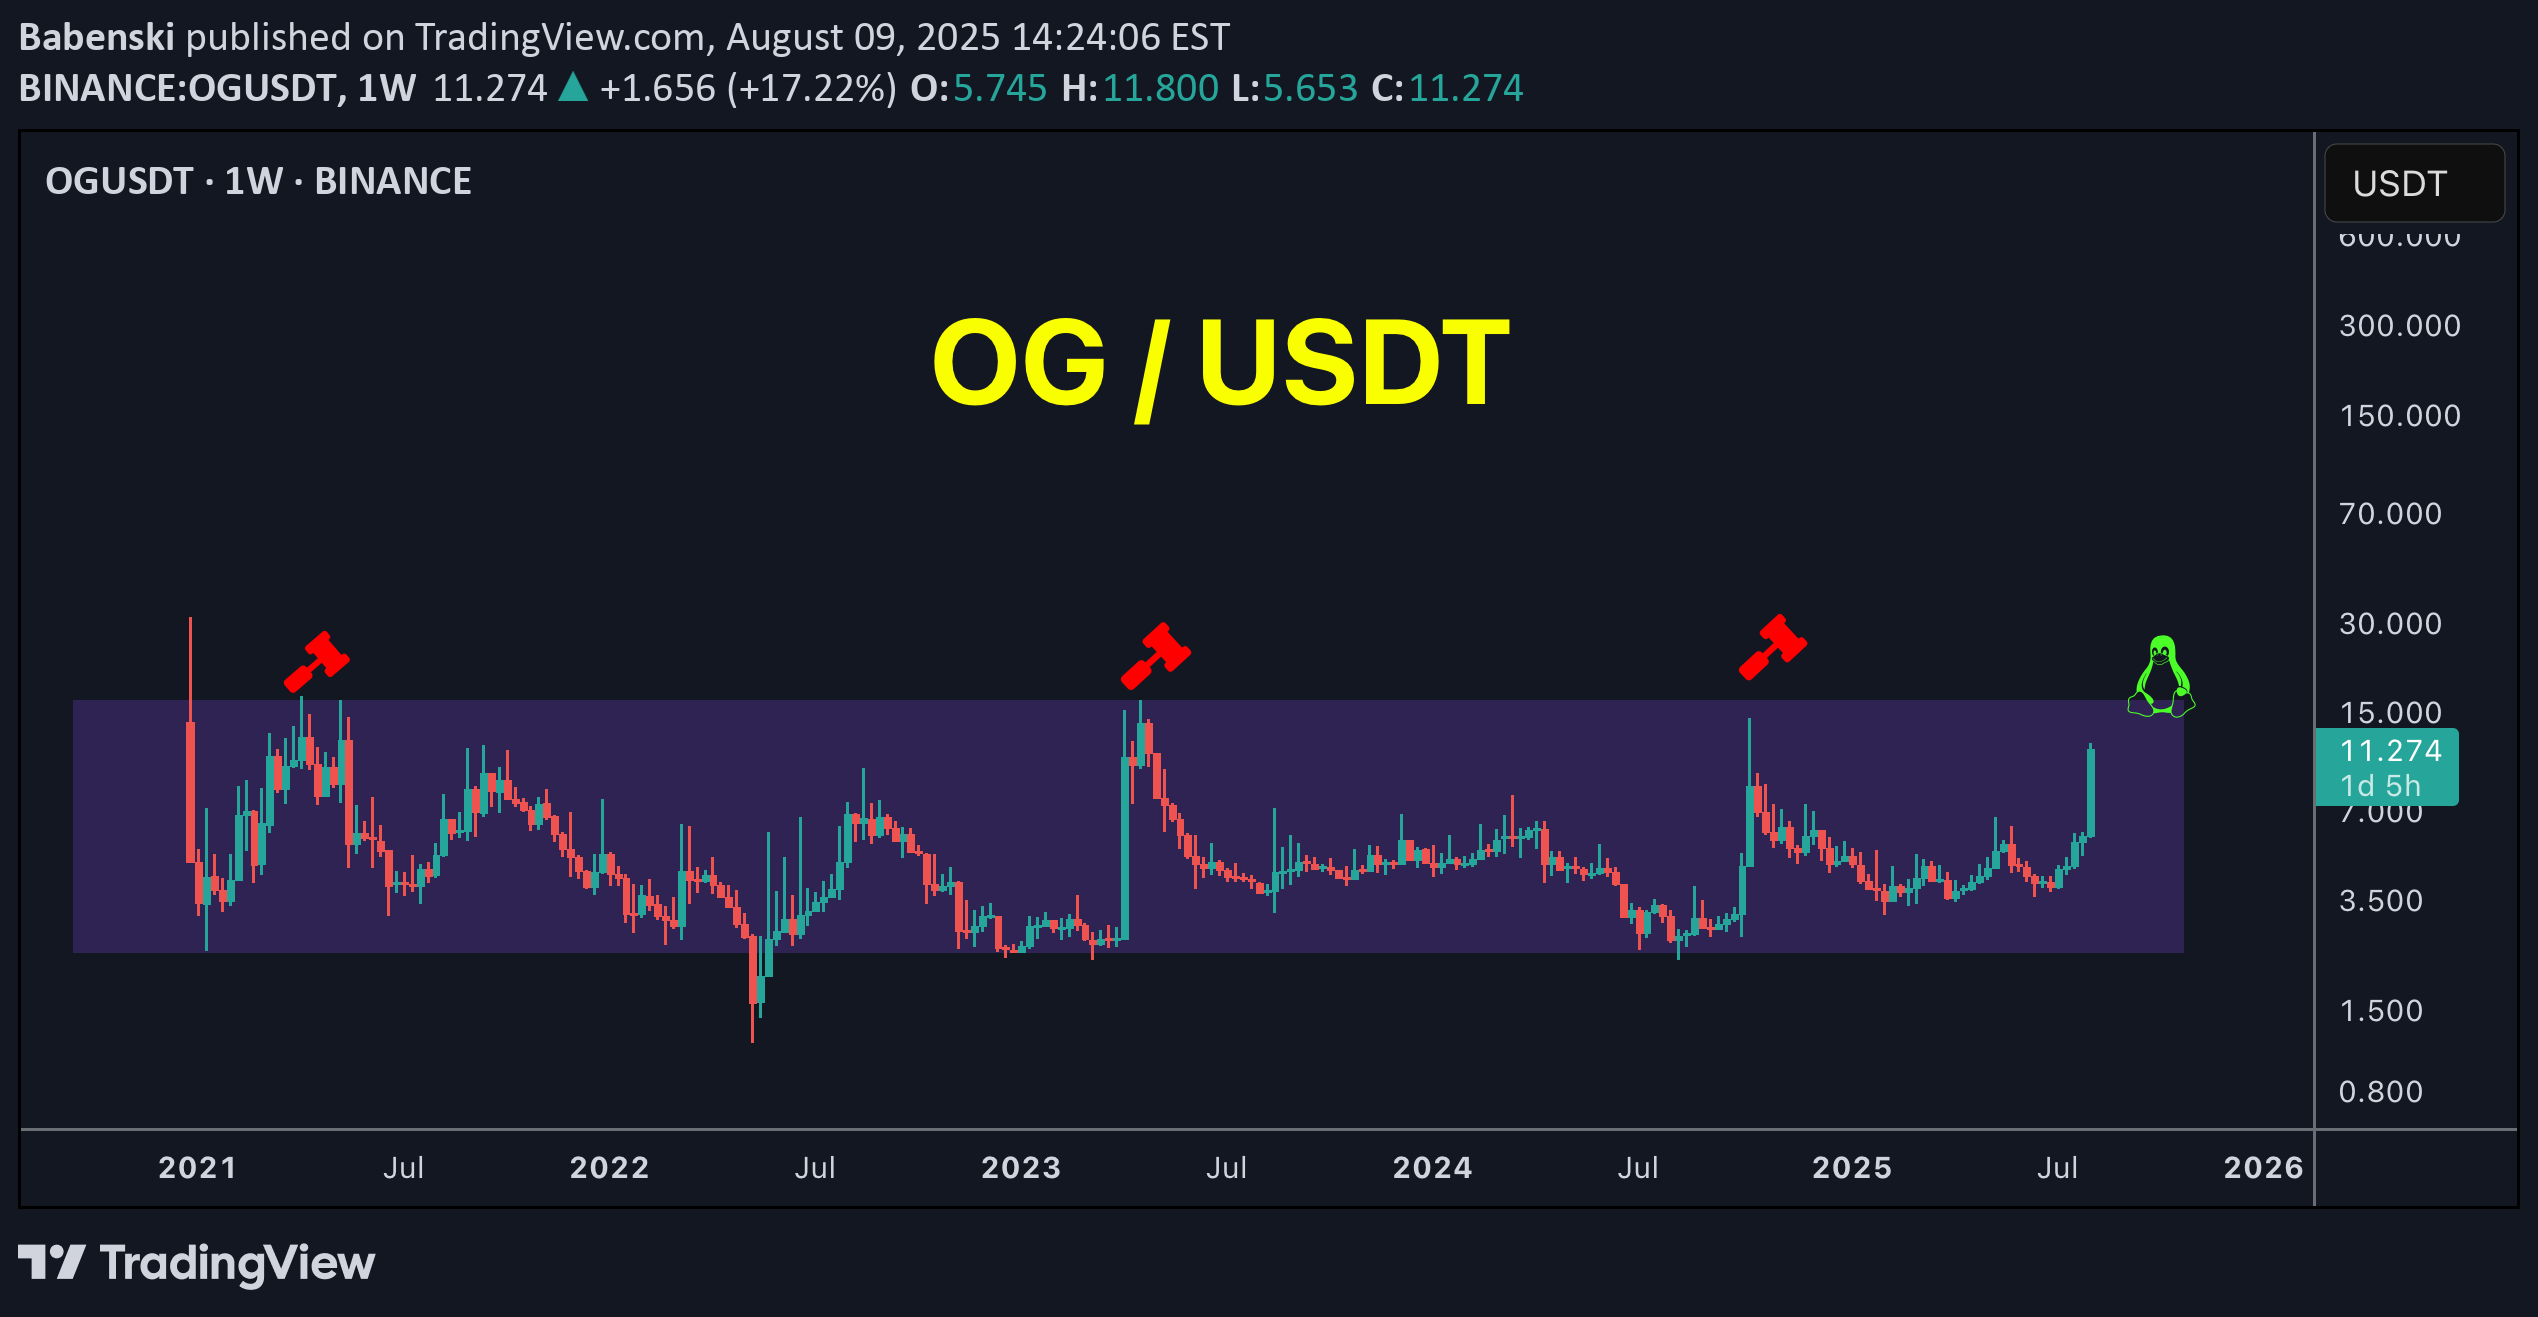
OG / USDT Price is playing in long term accumulation between 2$ as support and 14$/16$ as resistance Every time price hit resistance zone it rejected hard but once again we see another try to breakout with big volume Breakout here and we will see fireworks Keep an eye on itPrice hit 15$ with +40% increase in less than 1 day after sharing my idea .. congrats 🎉 Now we are testing historical resistance .. lets see what will happen here 👀UPDATE : +112% profits in spot Congrats if u bought it
Disclaimer
Any content and materials included in Sahmeto's website and official communication channels are a compilation of personal opinions and analyses and are not binding. They do not constitute any recommendation for buying, selling, entering or exiting the stock market and cryptocurrency market. Also, all news and analyses included in the website and channels are merely republished information from official and unofficial domestic and foreign sources, and it is obvious that users of the said content are responsible for following up and ensuring the authenticity and accuracy of the materials. Therefore, while disclaiming responsibility, it is declared that the responsibility for any decision-making, action, and potential profit and loss in the capital market and cryptocurrency market lies with the trader.